Abstract
Objective
The aims of this study were to investigate the ability of contrast-enhanced dual-energy computed tomography (DECT) for assessing regional perfusion in a model of acute lung injury, using dynamic first-pass perfusion CT (DynCT) as the criterion standard and to evaluate if changes in lung perfusion caused by prone ventilation are similarly demonstrated by DECT and DynCT.
Methods
This was an institutional review board–approved study, compliant with guidelines for humane care of laboratory animals. A ventilator-induced lung injury protocol was applied to 6 landrace pigs. Perfused blood volume (PBV) and pulmonary blood flow (PBF) were respectively quantified by DECT and DynCT, in supine and prone positions. The lungs were segmented in equally sized regions of interest, namely, dorsal, middle, and ventral. Perfused blood volume and PBF values were normalized by lung density. Regional air fraction (AF) was assessed by triple-material decomposition DECT. Per-animal correlation between PBV and PBF was assessed with Pearson R. Regional differences in PBV, PBF, and AF were evaluated with 1-way analysis of variance and post hoc linear trend analysis (α = 5%).
Results
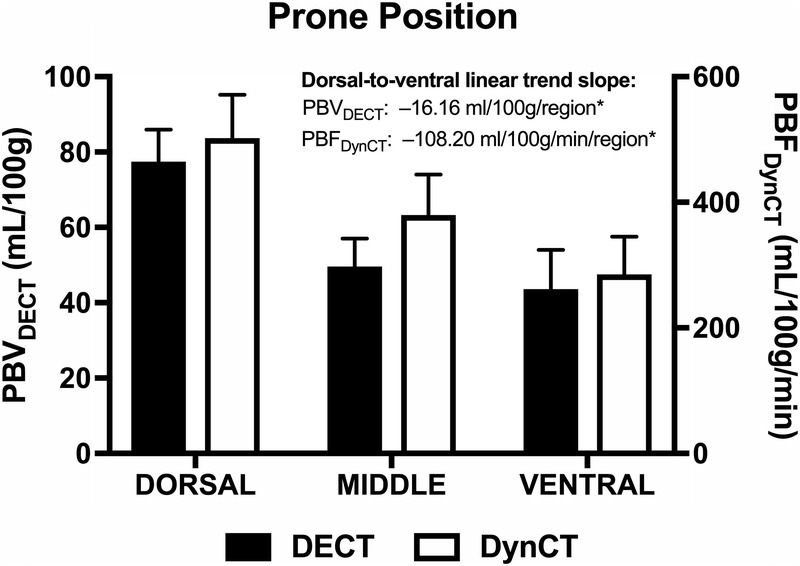
Mean correlation coefficient between PBV and PBF was 0.70 (range, 0.55–0.98). Higher PBV and PBF values were observed in dorsal versus ventral regions. Dorsal-to-ventral linear trend slopes were −10.24 mL/100 g per zone for PBV (P < 0.001) and −223.0 mL/100 g per minute per zone for PBF (P < 0.001). Prone ventilation also revealed higher PBV and PBF in dorsal versus ventral regions. Dorsal-to-ventral linear trend slopes were −16.16 mL/100 g per zone for PBV (P < 0.001) and −108.2 mL/100 g per minute per zone for PBF (P < 0.001). By contrast, AF was lower in dorsal versus ventral regions in supine position, with dorsal-to-ventral linear trend slope of +5.77%/zone (P < 0.05). Prone ventilation was associated with homogenization of AF distribution among different regions (P = 0.74).
Conclusions
Dual-energy computed tomography PBV is correlated with DynCT-PBF in a model of acute lung injury, and able to demonstrate regional differences in pulmonary perfusion. Perfusion was higher in the dorsal regions, irrespectively to decubitus, with more homogeneous lung aeration in prone position.
Key Words: acute lung injury, biomarker, dual-energy computed tomography
Over the past decade, dual-energy computed tomography (DECT) has emerged as a promising method capable of enhancing anatomical data yielded by conventional computed tomography (CT). Although different approaches have been developed to obtain DECT data,1 all have similar abilities for estimating elemental or molecular densities of objects by using material decomposition algorithms.2 Previous studies have shown the feasibility of extracting pulmonary perfusion information from iodine density maps in DECT scans.3,4 For example, iodine maps of the lungs obtained from DECT scans have shown a sensitivity of 77% and a specificity of 98% for the diagnosis of pulmonary embolism (PE), outperforming the specificity of perfusion single-photon emission CT/CT.5
Biological markers, also known as biomarkers, are measurable characteristics of normal biological or pathogenic processes, which can serve to monitor therapeutic interventions objectively.6 Dual-energy CT iodine density maps can potentially act as biomarkers of pulmonary perfusion, comparing favorably in terms of radiation dose and longitudinal axis coverage with first-pass dynamic perfusion CT,7,8 and in terms of signal-to-noise ratio and spatial resolution with magnetic resonance perfusion imaging.9 For example, a noninvasive DECT biomarker of pulmonary perfusion was used to support a vascular etiology for smoking-induced inflammatory lung disease.10 Perfused blood volume (PBV), a DECT biomarker of lung perfusion, has also shown promise for stratifying the severity and prognosis of patients with PE. This biomarker was not only inversely correlated with thrombus load and signs of right-sided heart strain in PE, but was also predictive of intensive care unit admission.11 In patients with chronic thromboembolic pulmonary hypertension, DECT hypoperfusion scores have been correlated with pulmonary artery and right ventricular pressures.12 A study showed that improvements in DECT perfusin biomarkers were accompanied by better hemodynamic indicators and clinical parameters in CTEPH patients treated with balloon angioplasty.13
Although the role of a DECT biomarker of pulmonary perfusion has been widely studied in the context of PE and some aspects of oncology,14 little is known about the validity or feasibility of its application in the assessment of acute respiratory distress syndrome (ARDS). Acute respiratory distress syndrome is a frequent condition with high mortality in critical patients15,16 and is characterized by a stereotyped response to different factors leading to acute alveolar damage, loss of pulmonary compliance, and hypoxemia.17,18 A better understanding of the correlation between DECT biomarkers and pulmonary perfusion is a key element in future applications of the technique in the study and treatment of patients with ARDS.
The aim of this study was to test whether a DECT perfusion biomarker correlates with pulmonary perfusion, as measured by first-pass perfusion CT, in a pig model of acute lung injury.
MATERIALS AND METHODS
Preparation of Study Subjects
This study was approved by the relevant institutional ethics committee and complied with international guidelines for humane care of laboratory animals. Six landrace swine (n = 6, average weight = 34 kg) were anesthetized with a combination of intramuscular ketamine (5.0 mg/kg), acepromazine (0.1 mg/kg), and midazolam (0.5 mg/kg), followed by 1% propofol intravenously (3.0 mL/kg), orotracheal intubation, and noninvasive monitoring of vital signs. Ventilation was installed in controlled pressured mode with fixed inspiratory pressure to obtain a tidal volume (ΔP) of 10 mL/kg, positive end-expiratory pressure (PEEP) of 5 cm H2O, respiratory frequency of 20 cycles/min, inspiratory time of 1.0 second, and inspiratory fraction of 100% O2. Continuous infusion of ketamine, thionembutal, and pancuronium was started to improve analgesia, sedation, and muscular relaxation. Signs of pain and respiratory discomfort were actively monitored, and appropriate adjustments were made as needed.
The lung injury protocol19 consisted of surfactant depletion by repeated alveolar lavage with isotonic saline (0.9%, 37°C, 30 mL/kg), followed by alveolar distension with ΔP = 35 cm H2O and an increase in the PEEP from 1 to 13 cm H2O. The aim of the protocol was to induce local inflammation through alveolar collapse and cyclic hyperdistention (Fig. 1). Before image acquisition, alveolar recruitment was achieved by a stepwise increase of PEEP (from 25 to 45 cm H2O, in 5-cm H2O steps, applied over a period of 2 minutes, with fixed ΔP = 15 cm H2O). All animals received an additional analgesic and sedative dose by the end of image acquisition and were euthanized with an intravenous injection of 19.1% KCl.
FIGURE 1.

Acute lung injury effects. Sample computed tomography images obtained from 3 different pigs, demonstrating the effects of acute lung injury, namely, ground-glass opacities (*) and interlobular septal thickening (arrows).
Image Acquisition
All CT images were acquired with a 64-slice multi–detector-row single-source rapid kilovolt peak-switching scanner (Discovery CT 750HD; GE Healthcare, Waukesha, Wis). A helical single-phase postcontrast DECT image was obtained from the top of the lungs through the costophrenic sulci, using a 0.8-second rotation time, 64 × 0.625-mm collimation, in-plane pixel resolution of 0.39 × 0.39 mm, peak tube voltage switching from 80 to 140 kV, and 260-mA tube current. The data were reconstructed into contiguous 5-mm-thick slices at 2 virtual monochromatic levels: 70 and 140 keV.20 To simulate the degree of enhancement obtained during a PE CT angiography protocol, intravenous injection of 20 mL of 300 mg I/mL iobitridol (Henetix 300; Guerbet, Villepinte, France) was given at a 4-mL/s flow rate, followed by a 20-mL normal saline flush at the same flow rate. Dual-energy CT scans were started with a 15-second delay after the beginning of contrast injection.21
After a 5-minute washout delay, a second set of single-energy dynamic CT (DynCT) images was obtained through a 20-mm-thick slab immediately above the diaphragm, using 0.4-second rotation time, 0.2-second temporal interval between reconstructions, 120-second total scan duration, 32 × 0.625-mm collimation, in-plane pixel resolution of 0.39 × 0.39 mm, 80-kV peak tube voltage, and tube current of 300 mA. The data were reconstructed into 4 slices of 5-mm thickness each. Contrast injection started immediately after CT scanning commenced and consisted of 20 mL of 300 mg I/mL iobitridol administered at a flow rate of 10 mL/s, followed by 20 mL of normal saline flush at the same flow rate.
Upon completion of the first set of CT acquisitions, the animals were shifted from supine to prone position. After stabilization and an approximate 30-minute delay, a second set of DECT and DynCT images was acquired, following the same protocol.
Image Quantification
A slice avoiding the diaphragm and artifacts was chosen at the lung bases. Dual-energy CT and DynCT images were matched according to their respective location with respect to the Z axis coordinate. Minimal spatial incongruences between acquisitions were resolved by using an intensity-based automatic image registration algorithm in MATLAB (v. 2015b; Natick, Mass). Lungs were segmented with a fast-level set-based algorithm using coherent propagation (Mia plug-in for OsiriX; Pixmeo, Bernex, Switzerland),22 and the results were reviewed, edited, and validated by a radiologist with 2 years of experience in research with CT images of swine (F.K.). We further segmented the lungs into 3 regions of interest, namely, dorsal, middle, and ventral zones, using an automated script written in R (R Software version 3.1.3; The R Foundation of Statistical Computing, Vienna, Austria) that takes a column of pixels in respect to the animal orientation along the gravitational axis (Fig. 2) and divides it into 3 equally sized bins according to the anteroposterior axis. These volumes of interest measured 14.23 ± 1.78 mL (mean ± SD) on the right and 13.46 ± 1.25 mL on the left side in supine position, and their sizes were 12.82 ± 1.61 and 12.72 ± 1.19 mL in prone position, respectively.
FIGURE 2.
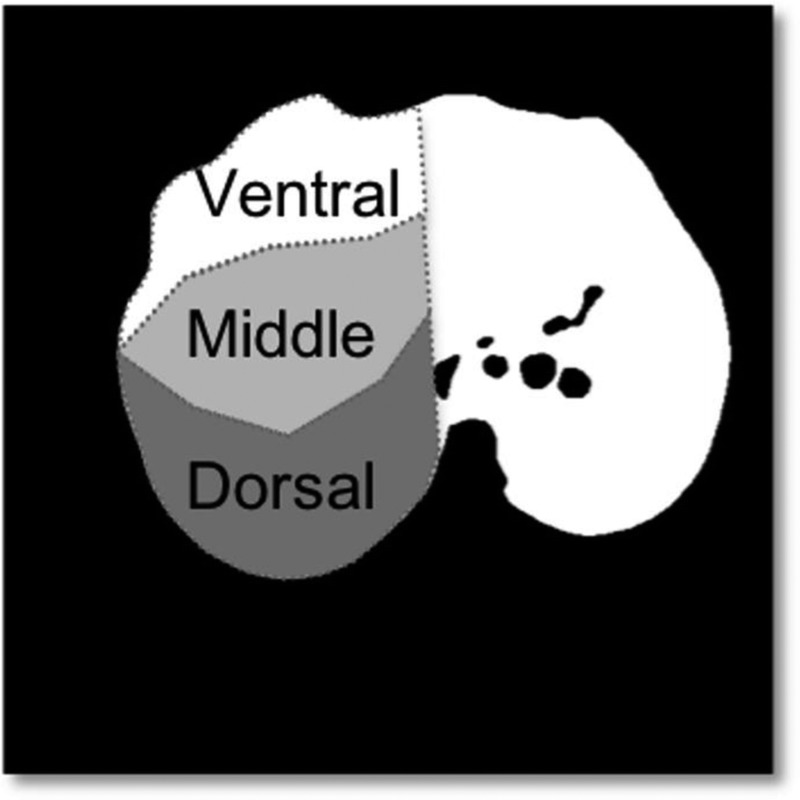
Perfusion maps by DECT and DynCT. An algorithm applied to the lung segmentation mask divides anteroposterior columns of pixels into 3 regions: ventral, middle, and dorsal.
Dual-energy CT image pairs were smoothed using a moving average spatial kernel to reduce noise and were loaded into a triple-material decomposition algorithm implemented in MATLAB (v. R2015b).23 Tissue, air, and blood fraction images were returned as material decomposition outputs from respective inputs of region-of-interest attenuation measured in the paravertebral musculature, within the large airways, and within the largest branch of the pulmonary artery (Fig. 3).
FIGURE 3.

Triple-material decomposition. Tissue, air, and blood fraction maps as outputs of the triple-material decomposition algorithm. Figure 3 can be viewed online in color at www.jcat.org.
In DECT, PBV (PBVDECT) was calculated as:

where Blood% represents the blood fraction; Air%, the air fraction (AF); and k, the capillary-to-large vessel hematocrit ratio (for a hematocrit ratio of 0.70, k = 0.86).
Pulmonary blood flow (PBFDynCT) was calculated via a single-input deconvolution algorithm24 in CT Perfusion 4 software (AW Workstation; GE Healthcare) (Fig. 4). Images were preprocessed with a moving average spatial kernel. The largest pulmonary artery branch in the image plane was defined as the arterial input vessel, and deconvolution of time-attenuation data resulted in a pixel-wise impulse residue function. PBFDynCT was defined as the value of impulse residue function at t = 0, normalized by the density of the pulmonary parenchyma, as defined elsewhere.8
FIGURE 4.
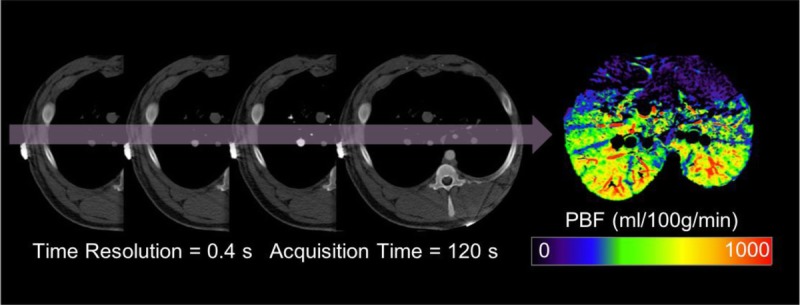
First-pass dynamic computed tomography perfusion. Pulmonary blood flow was calculated via deconvolution of time-attenuation data. Figure 4 can be viewed online in color at www.jcat.org.
Statistical Analysis
We assessed the correlation between PBVDECT and PBFDynCT using a per-animal Pearson r coefficient for all segmented zones: 3 zones per lung (dorsal, middle, and ventral) × 2 lungs per swine (right and left) × 6 swine × 2 experimental settings (supine and prone) = 72 zones (average volume of 13.36 ± 1.51 mL per zone). We tested for the presence of regional differences in lung perfusion (ie, regional perfusion heterogeneity) and aeration using matched analysis of variance with post hoc linear trend analysis. We used a statistical significance level of 0.05. Statistical tests and graphical analyses were performed in GraphPad Prism (v. 7.0d; La Jolla, Calif).
RESULTS
The mean correlation between PBVDECT and PBFDynCT among animals was r = 0.70 (range, 0.57–0.98) (Fig. 5).
FIGURE 5.
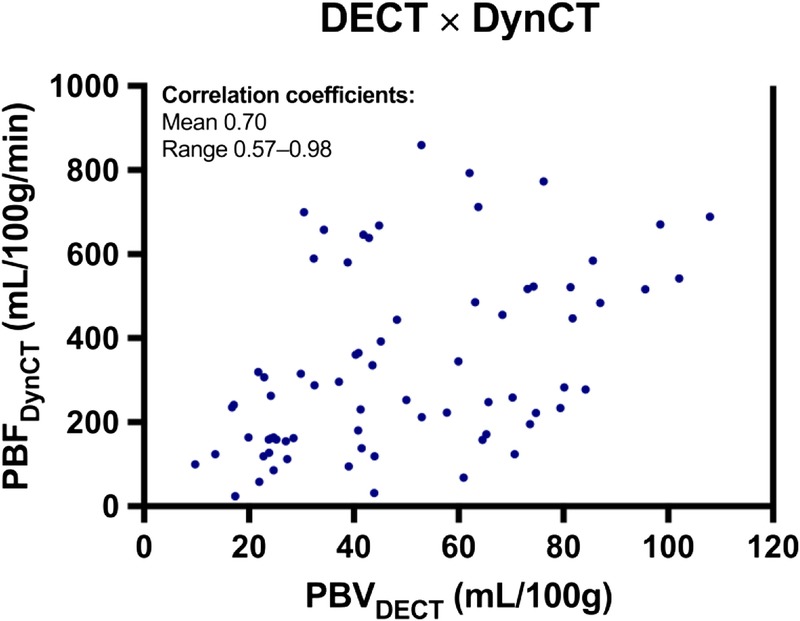
Dispersion graph between PBVDECT and PBFDynCT. Data points represent each lung region of all animals. Mean per animal r and range are shown. Figure 5 can be viewed online in color at www.jcat.org.
In the supine position, PBVDECT values were higher in the dorsal region (24.88 mL/100 g) and progressively decreased toward the middle (12.91 mL/100 g) and ventral (9.36 mL/100 g) regions. Similarly, higher PBFDynCT values were observed in the dorsal (619.68 mL/100 g per minute), followed by the middle (268.93 mL/100 g per minute) and ventral (148.77 mL/100 g per minute) regions, respectively. We noted a significant dorsal-to-ventral PBVDECT trend of −10.24 mL/100 g per region (P < 0.001) and a dorsal-to-ventral PBFDynCT trend of −223.0 mL/100 g per minute per region (P < 0.001) (Fig. 6).
FIGURE 6.
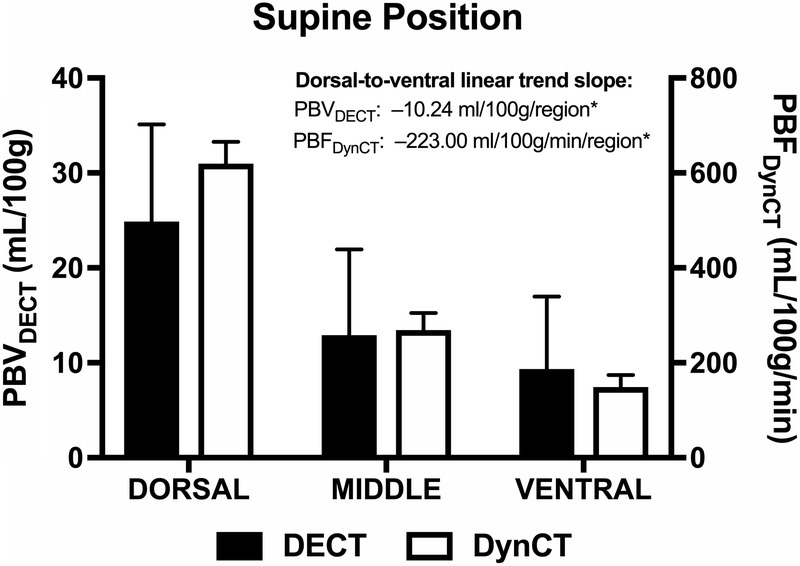
Regional PBVDECT and PBFDynCT. Bar charts showing mean and SE of PBVDECT (black boxes) and PBFDynCT (white boxes) for each lung region (dorsal, middle, and ventral) in supine position. Trend slopes are displayed. *P < 0.001. Figure 6 can be viewed online in color at www.jcat.org.
In the prone position, PBVDECT values were higher in the dorsal region (77.47 mL/100 g) and progressively decreased toward the middle (49.67 mL/100 g) and ventral (43.66 mL/100 g) regions. Similarly, higher PBFDynCT values were observed in the dorsal region (502.18 mL/100 g per minute), followed by the middle (379.98 mL/100 g per minute) and ventral (285.16 mL/100 g per minute) regions, respectively. We again noted a significant dorsal-to-ventral PBVDECT trend of −16.16 mL/100 g per region (P < 0.001) and a dorsal-to-ventral PBFDynCT trend of −108.2 mL/100 g per minute per region (P < 0.001) (Fig. 7).
FIGURE 7.
Regional PBVDECT and PBFDynCT. Bar charts show the mean and SE of PBVDECT (black boxes) and PBFDynCT (white boxes) for each lung region (dorsal, middle, and ventral) in the prone position. Trend slopes are indicated. *P < 0.001. Figure 7 can be viewed online in color at www.jcat.org.
In the supine position, AFs obtained by DECT were 62.57% and 74.11% in the dorsal and ventral regions, respectively, with a significant dorsal-to-ventral trend slope of 5.77%/region (P = 0.020). In the prone position, AFs were 68.00% and 69.08%, respectively, with no significant dorsal-to-ventral trend (P = 0.74) (Fig. 8).
FIGURE 8.
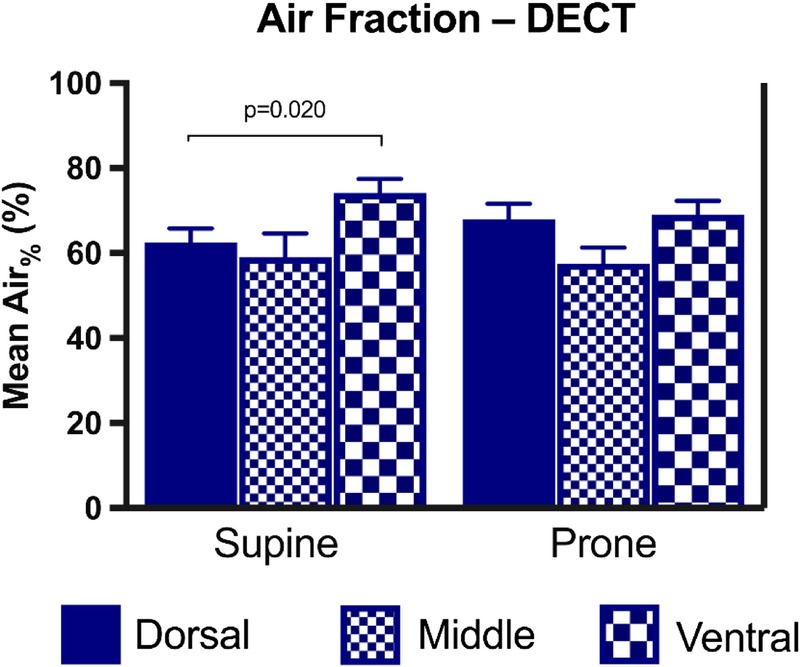
Regional AF (Air%) obtained by material decomposition on DECT. Bar charts showing mean and SE for each lung region (dorsal, middle, and ventral) in the supine and prone positions. Only statistically significant P values are displayed. Figure 8 can be viewed online in color at www.jcat.org.
DISCUSSION
We demonstrated correlation between a biomarker obtained from a single-phase contrast-enhanced DECT (PBVDECT) and PBF measured by first-pass DynCT perfusion in a model of alveolar injury. Although DynCT is a robust method for assessing organ perfusion, already tested in phantoms,25 animal models,7,8,26 and humans,27 its clinical application has been hampered by concerns about the potential stochastic effects of high radiation doses.28 In comparison to standard single-energy CT and DECT, DynCT usually involves repetitive scanning of a limited anatomic region, resulting in higher radiation doses directed at a restricted volume. For instance, a typical effective dose for DynCT with only 8-cm extension in the longitudinal axis is approximately 12.5 mSv,29 whereas the average whole-chest dose for a clinical CT scan is approximately 7 mSv.30 In contrast, DECT protocols for PE diagnosis have promoted radiation doses similar to or even lower than those of single-energy CT scans, without a loss of imaging quality.31,32 Therefore, our results showing moderate (0.57) to almost perfect (0.98) correlation between DECT and DynCT for assessing lung perfusion in alveolar injury provide support for the clinical use of this DECT perfusion biomarker in patients with ARDS.
To estimate lung perfusion in a single scan, DECT relies on accurate measurements of intravascular iodinated contrast distribution in the pulmonary parenchyma.4 Such capability is based on physical principles that were described more than 40 decades ago,2 but were only recently refined after developments in scanner technology.1 In late-generation fast kVp-switching DECT scanners, measurements of iodine concentration are within an error margin of 10% to 33%, depending on the reference anthropomorphic phantom chosen (medium-size vs obese phantoms, respectively).33 Clinically, iodine density maps have been used as surrogates of lung perfusion in DECT studies for PE diagnosis over the last decade. A preliminary study by Thieme et al3 compared the use of DECT with that of lung scintigraphy for assessing lung hypoperfusion in 13 patients suspected of having PE. Per-segment sensitivity and specificity for lung hypoperfusion were 83% and 99%, respectively. Pontana et al34 used DECT to assess 117 patients suspected of having PE and found that 82% (14/17) of the segmental or subsegmental clots were associated with distal perfusion defects on iodine density maps. Later, Thieme et al5 evaluated 15 patients with possible PE using DECT and single-photon emission CT/CT; the authors found sensitivities/specificities of 77%/98% and 86%/88% for these methods, respectively.
Clinical utilization of DECT biomarkers of lung perfusion was also accompanied by experimental validation of the technique. For example, Zhang et al35 used a model of embolization of the pulmonary arteries in rabbits, showing sensitivity and specificity for the diagnosis of PE with iodine DECT maps of 100% and 98%, respectively, against a histopathologic standard of reference. The perfusion scintigraphy sensitivity and specificity were, respectively, 68% and 81% in the same animals. Fuld et al36 tested a DECT biomarker of lung perfusion in 2 pig models, comprising varying degrees of occlusion of the pulmonary artery with a Swan-Ganz balloon and different degrees of lung inflation. The authors found correlation between DECT and DynCT biomarkers of lung perfusion, with correlation coefficients of 0.73 to 0.91 and 0.69 to 0.94 for the first and second models, respectively. In this study, we showed that correlations between DECT and DynCT biomarkers of lung perfusion held true in a model of acute lung injury and yielded similar values to those observed by Fuld et al36 in normal lungs.
We observed a decreasing perfusion gradient from the dorsal to the ventral regions in the supine position with both DECT and DynCT. Classic physiologic studies had already shown that regional lung perfusion heterogeneity was independent of anatomic segmentation.37–40 Earlier studies showed that lung perfusion is generally diverted to gravitational-dependent regions, leading West41 to propose a gravitational model of lung perfusion. However, later studies have shown that anatomic elements have equal or even greater importance than gravitational effects.42–44 Our results are in agreement with the latter observations. The dorsal-to-ventral perfusion gradient was maintained after animals were switched from a supine to a prone position, which would not occur in a purely gravitational model. Jones et al45 studied lung perfusion using DynCT in 6 normal volunteers in the supine and prone positions. The authors estimated that gravity was responsible for 22% to 34% of perfusion heterogeneity in the supine position, whereas its contribution in the prone position was approximately 27% to 41%.45
Conversely, DECT showed an increasing dorsal-to-ventral lung aeration gradient in the supine position in our model. When animals were switched to a prone position, we did not observe significant AF gradients between regions, reflecting a more homogeneous ventilation of the lung parenchyma. Therefore, a more favorable ventilation/perfusion ratio is obtained in the prone position. This finding was in agreement with studies that showed improved blood oxygenation in approximately 70% of ARDS patients ventilated in the prone position.46–48 Thus, future studies may investigate if perfusion and ventilation DECT biomarkers could potentially be applied for tailoring appropriate ventilation strategies for ARDS patients.
The study had some limitations. First, all comparisons between DECT and DynCT were limited to a small section through the base of the lungs because of limitations of Z axis extension of DynCT. However, we do not anticipate that extrapolation of the conclusions to different regions would incur in significant bias, given the consistency of prior studies that compared DECT with whole-lung scintigraphy methods.3,5 Second, even though we allowed a washout interval between experiments in each of the animals, the study design, involving the use of multiple contrast injections, could have increased the iodine density over acquisitions. This finding has been confirmed with post hoc analysis of our data, which showed an average increase of 0.7 mg/mL of iodine in the blood pool after each injection. Notwithstanding, we would expect that this bias would underestimate, rather than overestimate, the correlation between the DECT biomarker and lung perfusion. Last, although swine and human physiology and anatomy are significantly similar,49 assumptions of the validity of these findings in humans must be confirmed in future clinical studies.
In conclusion, PBVDECT is correlated with lung perfusion in a model of lung injury. This DECT biomarker can reflect the perfusion heterogeneity across the dorsal-to-ventral regions. Dual-energy CT findings in the prone position support the relative independence of gravitational factors in the genesis of perfusion heterogeneity and show a more favorable relation between perfusion and ventilation, in agreement with the prone ventilation strategies proposed for ARDS patients.
Further studies in humans may confirm the potential application of perfusion and ventilation DECT biomarkers as surrogates of lung perfusion in patients with ARDS, with a view to tailoring ventilation strategies, assessing prognosis, and monitoring response to therapy.
Footnotes
The authors declare no conflict of interest.
Funding Institution: São Paulo Research Foundation (FAPESP). Grant identifier: 2012/07221-0.
REFERENCES
- 1.McCollough CH, Leng S, Yu L, et al. Dual- and multi-energy CT: principles, technical approaches, and clinical applications. Radiology. 2015;276:637–653. [DOI] [PMC free article] [PubMed] [Google Scholar]
- 2.Macovski A, Alvarez RE, Chan JL, et al. Energy dependent reconstruction in x-ray computerized tomography. Comput Biol Med. 1976;6:325–336. [DOI] [PubMed] [Google Scholar]
- 3.Thieme SF, Becker CR, Hacker M, et al. Dual energy CT for the assessment of lung perfusion—correlation to scintigraphy. Eur J Radiol. 2008;68:369–374. [DOI] [PubMed] [Google Scholar]
- 4.Thieme SF, Johnson TR, Lee C, et al. Dual-energy CT for the assessment of contrast material distribution in the pulmonary parenchyma. AJR Am J Roentgenol. 2009;193:144–149. [DOI] [PubMed] [Google Scholar]
- 5.Thieme SF, Graute V, Nikolaou K, et al. Dual Energy CT lung perfusion imaging—correlation with SPECT/CT. Eur J Radiol. 2012;81:360–365. [DOI] [PubMed] [Google Scholar]
- 6.Biomarkers Definitions Working Group. Biomarkers and surrogate endpoints: preferred definitions and conceptual framework. Clin Pharmacol Ther. 2001;69:89–95. [DOI] [PubMed] [Google Scholar]
- 7.Won C, Chon D, Tajik J, et al. CT-based assessment of regional pulmonary microvascular blood flow parameters. J Appl Physiol (1985). 2003;94:2483–2493. [DOI] [PubMed] [Google Scholar]
- 8.Chon D, Beck KC, Larsen RL, et al. Regional pulmonary blood flow in dogs by 4D–x-ray CT. J Appl Physiol (1985). 2006;101:1451–1465. [DOI] [PubMed] [Google Scholar]
- 9.Hopkins SR, Wielputz MO, Kauczor HU. Imaging lung perfusion. J Appl Physiol (1985). 2012;113:328–339. [DOI] [PMC free article] [PubMed] [Google Scholar]
- 10.Iyer KS, Newell JD, Jr, Jin D, et al. Quantitative dual-energy computed tomography supports a vascular etiology of smoking-induced inflammatory lung disease. Am J Respir Crit Care Med. 2016;193:652–661. [DOI] [PMC free article] [PubMed] [Google Scholar]
- 11.Meinel FG, Graef A, Bamberg F, et al. Effectiveness of automated quantification of pulmonary perfused blood volume using dual-energy CTPA for the severity assessment of acute pulmonary embolism. Invest Radiol. 2013;48:563–569. [DOI] [PubMed] [Google Scholar]
- 12.Takagi H, Ota H, Sugimura K, et al. Dual-energy CT to estimate clinical severity of chronic thromboembolic pulmonary hypertension: comparison with invasive right heart catheterization. Eur J Radiol. 2016;85:1574–1580. [DOI] [PubMed] [Google Scholar]
- 13.Koike H, Sueyoshi E, Sakamoto I, et al. Quantification of lung perfusion blood volume (lung PBV) by dual-energy CT in patients with chronic thromboembolic pulmonary hypertension (CTEPH) before and after balloon pulmonary angioplasty (BPA): preliminary results. Eur J Radiol. 2016;85:1607–1612. [DOI] [PubMed] [Google Scholar]
- 14.Chae EJ, Song JW, Seo JB, et al. Clinical utility of dual-energy CT in the evaluation of solitary pulmonary nodules: initial experience. Radiology. 2008;249:671–681. [DOI] [PubMed] [Google Scholar]
- 15.Rubenfeld GD, Herridge MS. Epidemiology and outcomes of acute lung injury. Chest. 2007;131:554–562. [DOI] [PubMed] [Google Scholar]
- 16.Bellani G, Laffey JG, Pham T, et al. Epidemiology, patterns of care, and mortality for patients with acute respiratory distress syndrome in intensive care units in 50 countries. JAMA. 2016;315:788–800. [DOI] [PubMed] [Google Scholar]
- 17.Ware LB, Matthay MA. The acute respiratory distress syndrome. N Engl J Med. 2000;342:1334–1349. [DOI] [PubMed] [Google Scholar]
- 18.Ranieri VM, Rubenfeld GD, Thompson BT, et al. Acute respiratory distress syndrome: the Berlin Definition. JAMA. 2012;307:2526–2533. [DOI] [PubMed] [Google Scholar]
- 19.Gomes S, Belmino R, Hirota A, et al. A new experimental model of the acute lung injury. American Thoracic Society; San Diego Convention Center. Am J Respir Crit Care Med. 2009. [Google Scholar]
- 20.Yu L, Christner JA, Leng S, et al. Virtual monochromatic imaging in dual-source dual-energy CT: radiation dose and image quality. Med Phys. 2011;38:6371–6379. [DOI] [PMC free article] [PubMed] [Google Scholar]
- 21.Henzler T, Meyer M, Reichert M, et al. Dual-energy CT angiography of the lungs: comparison of test bolus and bolus tracking techniques for the determination of scan delay. Eur J Radiol. 2012;81:132–138. [DOI] [PubMed] [Google Scholar]
- 22.Wang C, Frimmel H, Smedby Ö. Fast level-set based image segmentation using coherent propagation. Med Phys. 2014;41:073501. [DOI] [PubMed] [Google Scholar]
- 23.Liu X, Yu L, Primak AN, et al. Quantitative imaging of element composition and mass fraction using dual-energy CT: three-material decomposition. Med Phys. 2009;36:1602–1609. [DOI] [PMC free article] [PubMed] [Google Scholar]
- 24.Cenic A, Nabavi DG, Craen RA, et al. Dynamic CT measurement of cerebral blood flow: a validation study. AJNR Am J Neuroradiol. 1999;20:63–73. [PubMed] [Google Scholar]
- 25.Jaschke W, Gould RG, Assimakopoulos PA, et al. Flow measurements with a high-speed computed tomography scanner. Med Phys. 1987;14:238–243. [DOI] [PubMed] [Google Scholar]
- 26.Hoffman EA, Tajik JK, Kugelmass SD. Matching pulmonary structure and perfusion via combined dynamic multislice CT and thin-slice high-resolution CT. Comput Med Imaging Graph. 1995;19:101–112. [DOI] [PubMed] [Google Scholar]
- 27.Ludman PF, Coats AJ, Burger P, et al. Validation of measurement of regional myocardial perfusion in humans by ultrafast x-ray computed tomography. Am J Card Imaging. 1993;7:267–279. [PubMed] [Google Scholar]
- 28.Brenner DJ, Hall EJ. Computed tomography–an increasing source of radiation exposure. N Engl J Med. 2007;357:2277–2284. [DOI] [PubMed] [Google Scholar]
- 29.Shan F, Xing W, Qiu J, et al. First-pass CT perfusion in small peripheral lung cancers: effect of the temporal interval between scan acquisitions on the radiation dose and quantitative vascular parameters. Acad Radiol. 2013;20:972–979. [DOI] [PubMed] [Google Scholar]
- 30.Mettler FA, Jr, Huda W, Yoshizumi TT, et al. Effective doses in radiology and diagnostic nuclear medicine: a catalog. Radiology. 2008;248:254–263. [DOI] [PubMed] [Google Scholar]
- 31.Renapurkar RD, Primak A, Azok J, et al. Attenuation-based kV pair selection in dual source dual energy computed tomography angiography of the chest: impact on radiation dose and image quality. Eur Radiol. 2017;27:3283–3289. [DOI] [PubMed] [Google Scholar]
- 32.Petritsch B, Kosmala A, Gassenmaier T, et al. Diagnosis of pulmonary artery embolism: comparison of single-source CT and 3rd generation dual-source CT using a dual-energy protocol regarding image quality and radiation dose. Rofo. 2017;189:527–536. [DOI] [PubMed] [Google Scholar]
- 33.Papadakis AE, Damilakis J. Fast kVp-switching dual energy contrast-enhanced thorax and cardiac CT: a phantom study on the accuracy of iodine concentration and effective atomic number measurement. Med Phys. 2017;44:4724–4735. [DOI] [PubMed] [Google Scholar]
- 34.Pontana F, Faivre JB, Remy-Jardin M, et al. Lung perfusion with dual-energy multidetector-row CT (MDCT): feasibility for the evaluation of acute pulmonary embolism in 117 consecutive patients. Acad Radiol. 2008;15:1494–1504. [DOI] [PubMed] [Google Scholar]
- 35.Zhang LJ, Chai X, Wu SY, et al. Detection of pulmonary embolism by dual energy CT: correlation with perfusion scintigraphy and histopathological findings in rabbits. Eur Radiol. 2009;19:2844–2854. [DOI] [PubMed] [Google Scholar]
- 36.Fuld MK, Halaweish AF, Haynes SE, et al. Pulmonary perfused blood volume with dual-energy CT as surrogate for pulmonary perfusion assessed with dynamic multidetector CT. Radiology. 2013;267:747–756. [DOI] [PMC free article] [PubMed] [Google Scholar]
- 37.West JB, Dollery CT, Hugh-Jones P. The use of radioactive carbon dioxide to measure regional blood flow in the lungs of patients with pulmonary disease. J Clin Invest. 1961;40:1–12. [DOI] [PMC free article] [PubMed] [Google Scholar]
- 38.Martin CJ, Cline F, Jr, Marshall H. Lobar alveolar gas concentrations; effect of body position. J Clin Invest. 1953;32:617–621. [DOI] [PMC free article] [PubMed] [Google Scholar]
- 39.Rahn H, Sadoul P, Farhi LE, et al. Distribution of ventalation and perfusion in the lobes of the dog's lung in the supine and erect position. J Appl Physiol. 1956;8:417–426. [DOI] [PubMed] [Google Scholar]
- 40.Anthonisen NR, Milic-Emili J. Distribution of pulmonary perfusion in erect man. J Appl Physiol. 1966;21:760–766. [DOI] [PubMed] [Google Scholar]
- 41.West JB. Regional differences in the lung. Chest. 1978;74:426–437. [DOI] [PubMed] [Google Scholar]
- 42.Greenleaf JF, Ritman EL, Sass DJ, et al. Spatial distribution of pulmonary blood flow in dogs in left decubitus position. Am J Physiol. 1974;227:230–244. [DOI] [PubMed] [Google Scholar]
- 43.Beck KC, Rehder K. Differences in regional vascular conductances in isolated dog lungs. J Appl Physiol (1985). 1986;61:530–538. [DOI] [PubMed] [Google Scholar]
- 44.Hakim TS, Lisbona R, Dean GW. Gravity-independent inequality in pulmonary blood flow in humans. J Appl Physiol (1985). 1987;63:1114–1121. [DOI] [PubMed] [Google Scholar]
- 45.Jones AT, Hansell DM, Evans TW. Pulmonary perfusion in supine and prone positions: an electron-beam computed tomography study. J Appl Physiol (1985). 2001;90:1342–1348. [DOI] [PubMed] [Google Scholar]
- 46.Chatte G, Sab JM, Dubois JM, et al. Prone position in mechanically ventilated patients with severe acute respiratory failure. Am J Respir Crit Care Med. 1997;155:473–478. [DOI] [PubMed] [Google Scholar]
- 47.Langer M, Mascheroni D, Marcolin R, et al. The prone position in ARDS patients. A clinical study. Chest. 1988;94:103–107. [DOI] [PubMed] [Google Scholar]
- 48.Pappert D, Rossaint R, Slama K, et al. Influence of positioning on ventilation-perfusion relationships in severe adult respiratory distress syndrome. Chest. 1994;106:1511–1516. [DOI] [PubMed] [Google Scholar]
- 49.Judge EP, Hughes JM, Egan JJ, et al. Anatomy and bronchoscopy of the porcine lung. A model for translational respiratory medicine. Am J Respir Cell Mol Biol. 2014;51:334–343. [DOI] [PubMed] [Google Scholar]


