Purpose
The aim of the study was to explore the efficacy of iodine quantification with dual-energy computed tomography (DECT) in differentiating thymoma, thymic carcinoma, and thymic lymphoma.
Materials and Methods
Fifty-seven patients with pathologically confirmed low-risk thymoma (n = 16), high-risk thymoma (n = 15), thymic carcinoma (n = 14), and thymic lymphoma (n = 12) underwent chest contrast-enhanced DECT scan were enrolled in this study. Tumor DECT parameters including iodine-related Hounsfield unit (IHU), iodine concentration (IC), mixed HU (MHU), and iodine ratio in dual phase, slope of energy spectral HU curve (λ), and virtual noncontrast (VNC) were compared for differences among 4 groups by one-way analysis of variance. Receiver operating characteristic curve was used to determine the efficacy for differentiating the low-risk thymoma from other thymic tumor by defined parameters.
Results
According to quantitative analysis, dual-phase IHU, IC, and MHU values in patients with low-risk thymoma were significantly increased compared with patients with high-risk thymoma, thymic carcinoma, and thymic lymphoma (P < 0.05/4).The venous phase IHU value yielded the highest performance with area under the curve of 0.893, 75.0% sensitivity, and 89.7% specificity for differentiating the low-risk thymomas from high-risk thymomas or thymic carcinoma at the cutoff value of 34.3 HU. When differentiating low-risk thymomas from thymic lymphoma, the venous phase IC value obtained the highest diagnostic efficacy with the area under the curve of 0.969, and sensitivity, specificity, and cutoff value were 87.5%, 100.0%, and 1.25 mg/mL, respectively.
Conclusions
Iodine quantification with DECT may be useful for differentiating the low-risk thymomas from other thymic tumors.
Key Words: thymoma, thymic carcinoma, thymic lymphoma, thymic epithelial tumors, dual-energy computed tomography, iodine quantification
Mediastinal masses include a spectrum of malignant tumors and benign lesions. Thymic neoplasms are the most common primary solid tumors of anterior mediastinum in adults, mainly including thymoma, thymic carcinoma, thymic lymphoma, and germ cell tumor.1 There are different optimal therapeutic strategies and prognosis for different thymic tumors.2 Low-risk (type A, AB, and B1) thymomas or early-stage (stages I and II) thymic epithelial tumors (TETs) are usually treated with surgery, and high-risk (type B2 and B3) thymomas or advanced stage (stages III and IV) TETs frequently require a multimodality approach, whereas lymphomas are managed with chemotherapy.3–5 Therefore, it has a clinical impact for physicians to accurately identify the tumor types before the treatment.
For the study of mediastinal tumors, computed tomography (CT) is generally the preferred imaging modality, presenting valuable diagnostic information in the detection, differentiation, staging, and prognosis evaluation of this lesions.6 Magnetic resonance imaging (MRI) is also effective because of its ability to provide excellent soft tissue detail.7 However, many thymic solid tumors cannot be accurately distinguished with the current information available from conventional CT and MRI.8,9
Dual-energy CT (DECT) is a relatively new technique offering specific tissue characterization through application of different x-ray spectra, which can be used to quantitatively measure iodine concentration (IC) reflecting the information about tumor contrast enhancement and angiogenesis.10–12 Compared with the conventional CT or perfusion CT, DECT could reduce the radiation dose and pseudoenhancement effects,13 which has been increasingly used for oncologic imaging in recent few years.11,12,14–21 A previous CT research showed that the maximal contrast-enhanced range in type A and type AB thymomas were significantly higher than other TETs.9 Initial studies reported that DECT can be helpful in differentiating mediastinal tumors.11,20 In addition, there was a significant correlation between tumor angiogenesis and invasiveness in TETs.22 Therefore, we hypothesize that DECT parameters is useful in distinguishing the thymic tumors.
The purpose of our study was to explore the differential diagnostic value of iodine quantification with DECT in low-, high-risk thymoma, thymic carcinoma, and thymic lymphoma.
MATERIALS AND METHODS
Subjects
This retrospective study was approved by the local ethics committee, and informed written consent was waived. This study was conducted in accordance with the Declaration of Helsinki.
Between June 2016 and June 2017, 83 consecutive patients with suspected thymic tumors underwent thorax DECT examination. The inclusion criteria were as follows: (a) anterior mediastinal solid mass (excluding typical thyroid masses); (b) lesions larger than 1 cm in diameter based on the longest diameter; and (c) patient did not undergo biopsy or any treatment. Exclusion criteria were patients with thymic cyst (n = 6), thymic hyperplasia (n = 4), germ cell tumors (n = 3), and solitary fibrous tumor (n = 1) based on histopathology analysis, and 12 patients were excluded for no surgery. Finally, a total of 57 consecutive thymic tumor patients (30 men, 27 women; mean age = 48 years; age range = 11–76 years) were enrolled based on the inclusion and exclusion criteria (Table 1, Fig. 1).
TABLE 1.
Clinical and Demographic Characteristics of 57 Thymic Tumor Patients
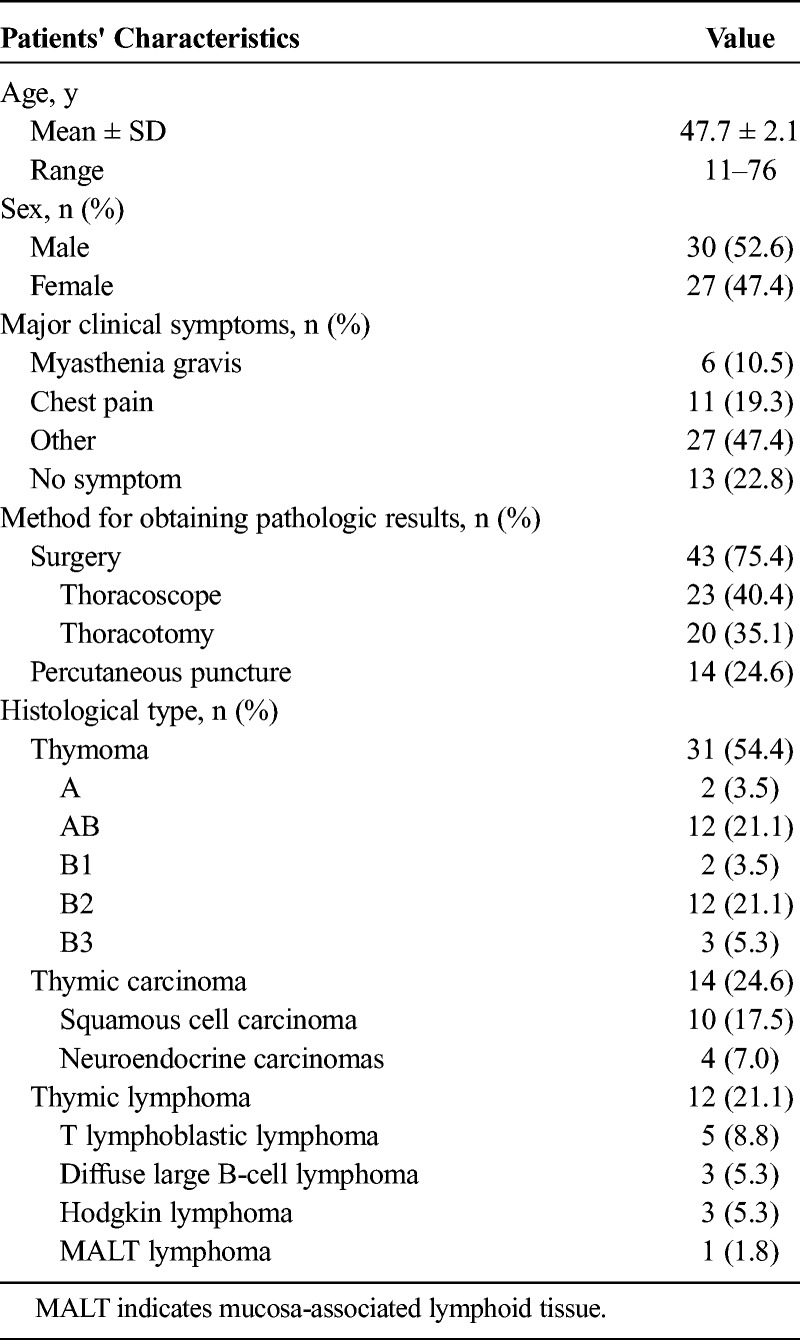
FIGURE 1.
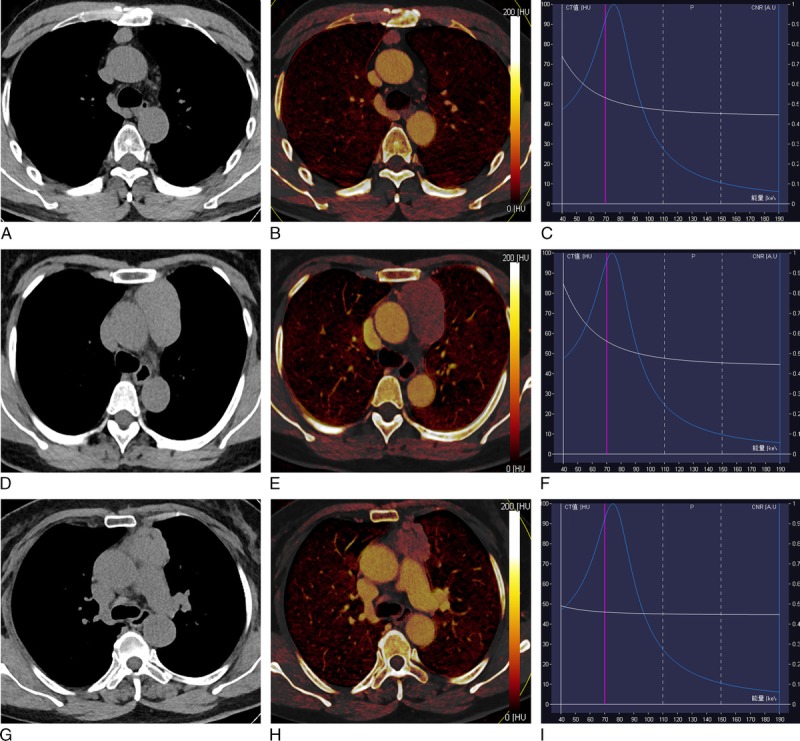
Dual-energy computed tomography images of representative thymoma cases. A–F, Low-risk thymoma (A–C: type A and D–F: type B1): (A) or (D) axial VNC CT image shows anterior mediastinal mass with oval shape and smooth contour; (B) or (E) axial iodine overlay image shows significant iodine color in thymic solid tumor, and iodine-related HU (IHU), IC, and MHU values in venous phase were 35.2 HU, 1.7 mg/mL and 83.9 HU for type A thymoma (B), 23.4 HU, 1.2 mg/mL, and 66.9 HU for type B1 thymoma (E), respectively; (C) or (E) graph of virtual monochromatic HU curves for the same region of interest locations shows much greater descending curve in tumor. G–I, High-risk thymoma (type B3): (G) axial VNC CT image shows anterior mediastinal mass with irregular contour and blurred fat layer of peritumor. H, Axial iodine overlay image shows moderate iodine color in tumor, and venous phase IHU, IC, and MHU values were 21.4 HU, 1.0 mg/mL, and 67.1 HU, respectively; (I) graph of virtual monochromatic HU curves for the same region of interest locations shows less steep descending curve in tumor. Figure 1 can be viewed online in color at www.jcat.org.
Computed Tomography Examination
All thorax CT examinations were performed on a 128-row CT scanner (Somatom Definition Flash; Siemens Healthcare, Forchheim, Germany).
Computed tomography images were acquired during a single breath-hold from the thoracic inlet to the costophrenic angle level in the craniocaudal direction. Contrast medium was administered by a dual-head pump injector (Stellant; Medtron, Saarbruecken, Germany). A volume of 60 to 100 mL (1.2 mL/kg of body weight) iodixanol injection 320 (HengRui, JiangSu, China) was injected in forearm vein at a flow rate of 3 mL/s using an 20-G needle, followed by a saline flush of 30 mL at the same rate. After intravenous injection of contrast medium, the arterial phase scan was triggered automatically 5 seconds after the attenuation in distal thoracic aorta increased to a default threshold (100 HU), and the venous phase scan was started with a 35-second delay after the end of the arterial phase scan. The scan parameters were as follows: 2 different tubes voltages (100 kV and Sn 140 kV, reference tube currents 160/68 mAs, respectively), slice thickness of 5.0 mm, collimation of 128 × 0.6 mm, tube rotation time of 0.28 seconds, and pitch of 0.55.
The spectral information from dual-energy data was used to generate iodine maps in axial 1.5-mm slices. These maps are comparable with color-coded CT images, but the displayed voxel values base exclusively on materials identified by the algorithm as contrast agent.
With a weighting factor of 0.6, the 2 data sets from the 2 x-ray tubes were fused to virtual images corresponding to a 120 kV scan (in the following, these images will be referred to as “conventional grey scale CT”) and were reconstructed into axial 3-mm slices using a standard soft tissue reconstruction kernel (Q30f medium smooth). Virtual monochromatic 70-keV images, synthesized from dual-energy CT data, that are known to be similar to conventional 120-kV images.
Image Analysis
All data were transferred to a dedicated workstation (syngo.via, VB10B; Siemens Healthcare). The CT data was analyzed by 1 experienced radiologists (W.Q.Y., with 8 years of experience in chest CT imaging), who was aware that the patients had thymic tumors, but he was blinded to the pathological types of the tumors.
On conventional CT images, the tumor maximum and mean diameter, shape, boundary, necrotic or cystic changes, calcification, mediastinal lymphadenopathy, and presence of pericardial or pleural effusion were analyzed. The longest dimension (a) and the greatest perpendicular diameters (b) of the tumor were measured at the level where the tumor appeared largest on the horizontal-sectional image, and the other longest dimension (c) were obtained on sagittal or coronal slice. The mean diameter was calculated by (a + b + c)/3.9 The tumor shape was evaluated based on the ratio of the long-axis diameter to the short one. It was classified as round if the long- to short-axis ratio was less than or equal to 1.5, oval if the ratio was greater than 1.5 but less than 2.0, or plaque if the ratio was greater than or equal to 2.0. Marginal characteristics were subclassified as smooth, lobulated, or irregular. Mediastinal lymphadenopathy was defined based on following criteria: short-axis diameter greater than 10 mm.
Dual-energy computed tomography data analysis was performed with commercial software (Syngo.via, dual-energy, liver virtual noncontrast, Siemens Healthcare). Reviewers selected the slice that showed the largest part of the tumor. Three-round ROIs were drawn manually using an electronic cursor, which were placed to include the solid tumor elements by defining ROI based on the Hounsfield unit (HU) on the virtual nonenhanced, arterial phase, and venous phase images, avoiding large vessels, calcification, obvious cystic, and necrotic areas. The mean ± SD ROI area was 94.2 ± 11.0 mm2 (range = 60.0–110.0 mm2), respectively. The iodine maps and energy spectral curves were generated automatically (Figs. 1, 2), and the quantitative parameter: iodine-related HU (IHU, HU), IC (milligram per milliliter), mixed HU (MHU, HU), iodine ratio (IR, %), slope of energy spectral HU curve (λ) values both in artery and venous phase, and virtual noncontrast (VNC, HU) values were obtained.
FIGURE 2.
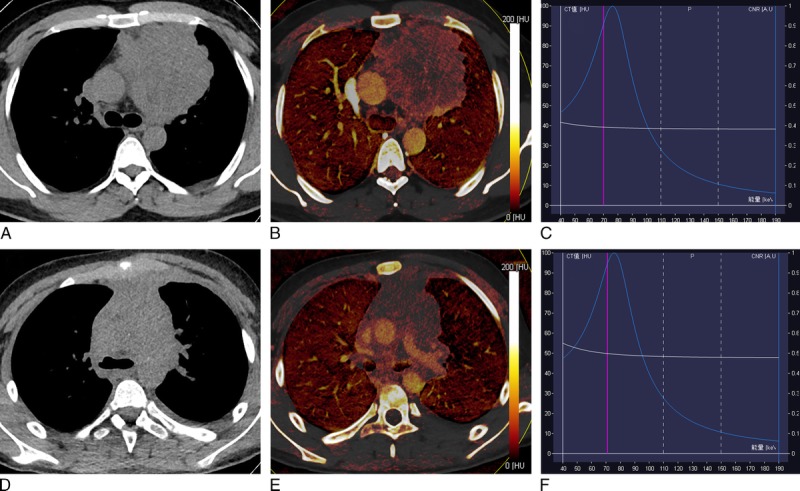
Dual-energy computed tomography images of representative cases with thymic carcinoma and lymphoma. A–C, Thymic carcinoma (squamous cell carcinoma): (A) axial VNC CT image shows anterior mediastinal mass with irregular contour, blurred fat layer of peritumor, and irregular interface with an absent space between tumor and pleura. B, Axial iodine overlay image shows heterogeneously mild to moderate iodine color in tumor, and IHU, IC, and MHU values in venous phase were 10.9 HU, 0.5 mg/mL, and 53.3 HU, respectively; (C) graph of virtual monochromatic HU curves for the same region of interest locations shows less steep descending curve in tumor. D–F, Thymic lymphoma (T lymphoblastic lymphoma): (D) axial VNC CT image shows anterior mediastinal mass with absent fat layer of peritumor, thickening pleura interface, and absent space between tumor and mediastinal blood vessels. E, Axial iodine overlay image shows mild iodine color in tumor, and venous phase IHU, IC, and MHU values were 5.8 HU, 0.7 mg/mL, and 54.1 HU, respectively; (F) graph of virtual monochromatic HU curves for the same region of interest locations shows less steep descending curve in tumor. Figure 2 can be viewed online in color at www.jcat.org.
The MHU was the CT attenuation value in postcontrast-enhanced HU, and the mean IHU was calculated as IHU = MHU − VNC. The mean IC (milligram per milliliter) of tumor was measured on the iodine images. The λ value was calculated as the CT attenuation difference at 2 energy levels (40 and 100 keV) divided by the energy difference (60keV) from the spectral HU curve, according to the formula: λ = |CT40 keV − CT100 keV|/60.19
Pathologic Diagnosis
The final diagnosis was determined by surgical specimen and confirmed with histopathological examination. Pathologic analysis was performed by a pathological expert. Tissue samples obtained from the specimens were routinely processed and stained for hematoxylin and eosin. Based on the criteria of the 2004 World Health Organization histological classification and Jeong simplification classification,23,24 thymic tumors were divided into the following 4 groups: low-risk thymoma (type A, AB, and B1), high-risk thymomas (type B2 and B3), thymic carcinoma, and thymic lymphoma.
Statistical Analysis
Numerical variables were denoted as mean and SD. The Kolmogorov-Smirnov test was used for assessing the normality of data distribution. Conventional CT features (including tumor shape, boundary, and presence of necrotic changes, calcification, lymphadenopathy, pericardiac, or pleural effusion) among low-, high-risk thymoma, thymic carcinoma, and thymic lymphoma groups were analyzed using the χ2 test. The tumor mean diameter, maximum diameter, and DECT parameters (IHU, IC, MHU, IR, and λ values) were compared for differences among 4 groups based on one-way analysis of variance, and further post hoc multiple comparisons were performed with Bonferroni test (equal variances assumed) and Dunett T3 test (equal variances not assumed). Receiver operating characteristic (ROC) curve analyses were performed to determine optimum thresholds for differentiating the defined groups based on various parameters and to calculate sensitivity, specificity, and area under the curve (AUC) values. A P value of less than 0.05 indicated a statistically significant difference. IBM SPSS 20.0 software (IBM Corp, Chicago, Ill) was used for statistical analysis.
RESULTS
The Clinical and Demographic Data
The patient demographic characteristics are shown in Table 1. The study group consisted of 30 males and 27 females with a mean ± SD age of 47.7 ± 2.1 years (range = 11–76 years). The major clinical presentations of the patients were myasthenia gravis (10.5%, 6/57 patients), chest pain (19.3%, 11/57), others (47.4%, 27/57), and the other 13 patients were without any discomfort (22.8%).
The pathologic classifications of the 57 thymic tumor patients demonstrated that 16 patients had low-risk thymomas (type A [n = 2], AB [n = 12], and B1 [n = 2]); 15 high-risk thymomas (type B2 [n = 12] and B3 [n = 3]); 14 thymic carcinomas (squamous cell carcinoma [n = 10] and neuroendocrine carcinomas [n = 4]), and 12 thymic lymphomas (T lymphoblastic lymphoma [n = 5], diffuse large B-cell lymphoma [n = 3], Hodgkin lymphoma [n = 3], and mucosa-associated lymphoid tissue lymphoma [n = 1]) (Table 1).
Comparison of Conventional CT Findings Among Low-, High-Risk Thymomas, Thymic Carcinomas, and Thymic Lymphomas
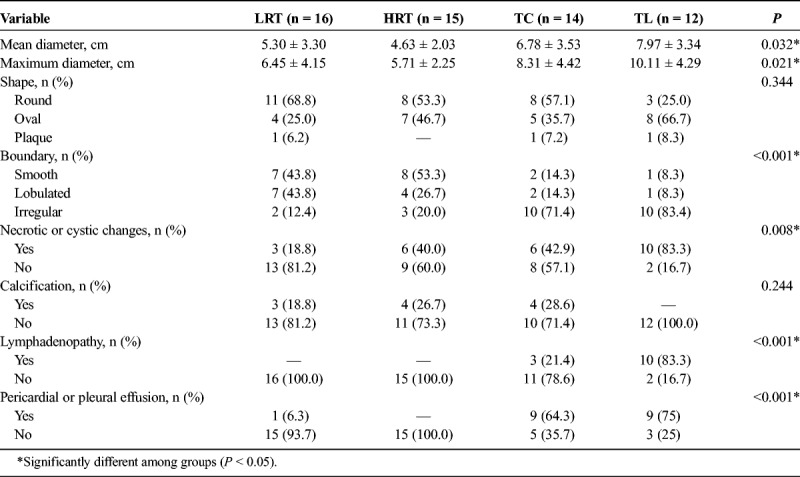
Comparisons of conventional CT features among 4 groups depending on World Health Organization pathological classifications of thymic tumor are shown in Table 2. Overall, tumor mean diameter, maximum diameter, boundary, necrotic or cystic changes, mediastinal lymphadenopathy, and presence of pericardial or pleural effusion differed among patients with 4 groups (all P < 0.05), whereas tumor shape and calcification did not differ depending on tumor pathological classifications (all P > 0.05).
TABLE 2.
Conventional CT Feature Comparisons Among Low-, High-Risk Thymoma, Thymic Carcinoma, and Thymic Lymphoma Patients
Dual-Energy Computed Tomography Parameters Comparison Among Low-, High-Risk Thymomas, Thymic Carcinomas, and Thymic Lymphomas
Comparison of DECT parameters among patients with low-, high-risk thymoma, thymic carcinoma, and thymic lymphoma are shown in Table 3 and Figure 3. There were significant differences for artery-phase IHU (Fig. 3A), venous phase IHU (Fig. 3B), artery-phase IC (Fig. 3C), venous phase IC (Fig. 3D), λ value, dual-phase MHU, and IR among low-, high-risk thymoma, thymic carcinoma, and thymic lymphoma groups based on one-way analysis of variance (all P < 0.05). In addition, pairwise comparison was performed, and the results revealed that the IHU, IC, and MHU values in both artery and venous phase were higher in low-risk thymoma group than in the high-risk thymoma, thymic carcinoma, and thymic lymphoma groups (IHU: 27.31, 15.15, 14.49, and 15.08 HU in artery phase, and 37.16, 22.15, 18.55, and 16.73 HU in venous phase; IC: 1.30, 0.67, 0.64, and 0.58 mg/mL in artery phase, and 1.75, 0.99, 0.82, and 0.70 mg/mL in venous phase; MHU: 64.06, 52.11, 51.35, and 48.18 HU in artery phase and 78.64, 61.39, 59.26, and 56.17 HU in venous phase, respectively, all P < 0.05/4).
TABLE 3.
The DECT Parameters Comparison Among Low-, High-Risk Thymoma, Thymic Carcinoma, and Thymic Lymphoma Groups
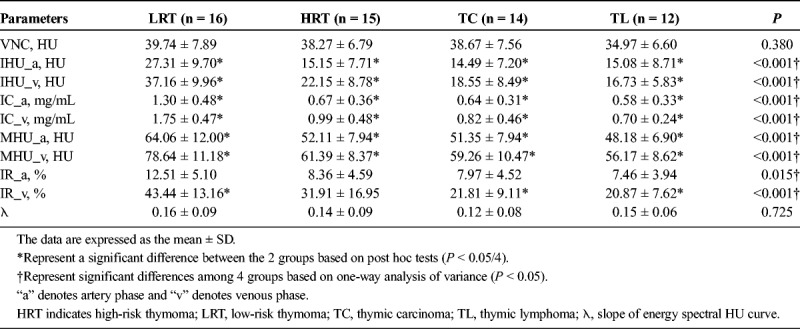
FIGURE 3.
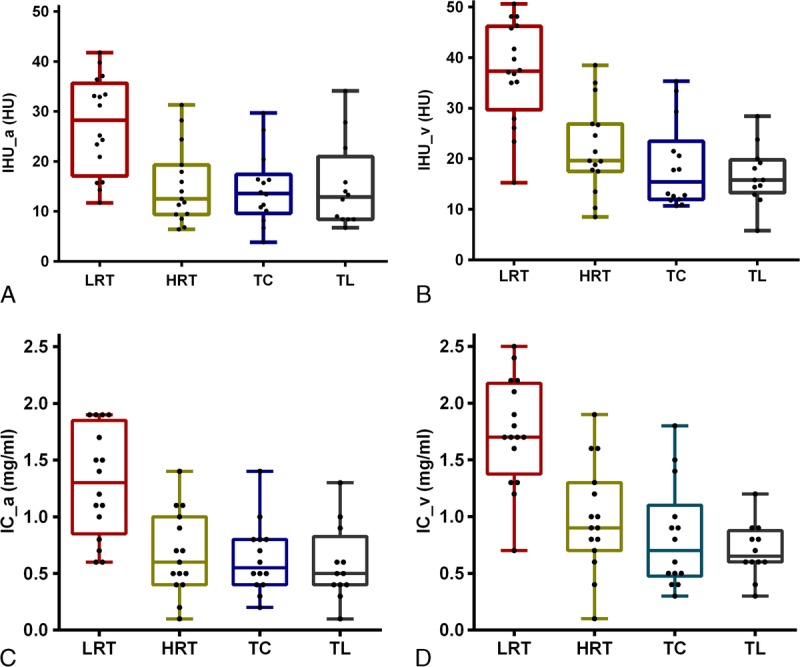
Box plots for values of IHU_a (A), IHU_v (B), IC_a (C), and IC_v (D) among LRT, HRT, TC, and TL groups. Note: “a” denotes artery phase and “v” denotes venous phase. HRT indicates high-risk thymoma; LRT, low-risk thymoma; TC, thymic carcinoma; TL, thymic lymphoma. Figure 3 can be viewed online in color at www.jcat.org.
In addition, venous phase IR value differed between low-risk thymoma and thymic carcinoma or thymic lymphoma groups (P < 0.05/4). However, the λ and artery-phase IR values did not differ between low- and high-risk thymoma, thymic carcinoma, or thymic lymphoma groups (P > 0.05/4).
Diagnostic Efficacy Analysis Results
Because there were statistically significant differences between low- and high-risk thymoma or thymic carcinoma groups in terms of dual-phase IHU, IC, and MHU values, diagnostic efficacy was assessed by ROC curves. The efficacy of parameters in differentiating the low- from high-risk thymoma and thymic carcinoma in ROC analysis is showed in Table 4 and Figure 4A. The venous phase IHU value yielded the highest performance with an AUC of 0.893, 75.0% sensitivity, and 89.7% specificity for differentiating the low- from high-risk thymoma and thymic carcinoma at the cutoff value of 34.3 HU. When comparing with venous phase IHU value, the other values also achieved the relatively high diagnostic efficacy, the AUC for artery-phase IHU, IC, MHU values, venous phase IC, and MHU value were 0.846, 0.866, 0.804, 0.888, and 0.888, respectively.
TABLE 4.
Diagnostic Efficacy Comparisons of DECT Parameters in Differentiating the Defined Groups of Thymic Tumor
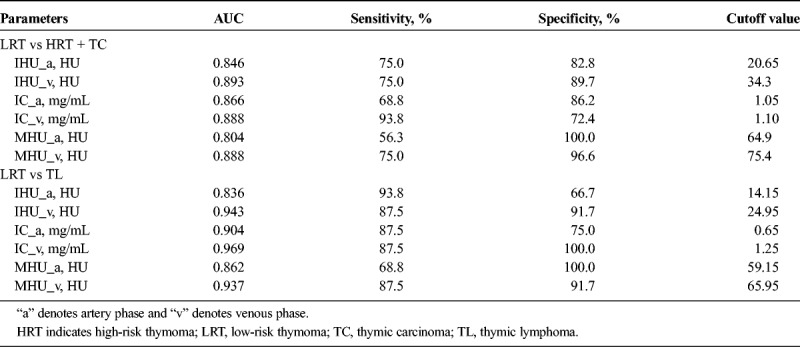
FIGURE 4.
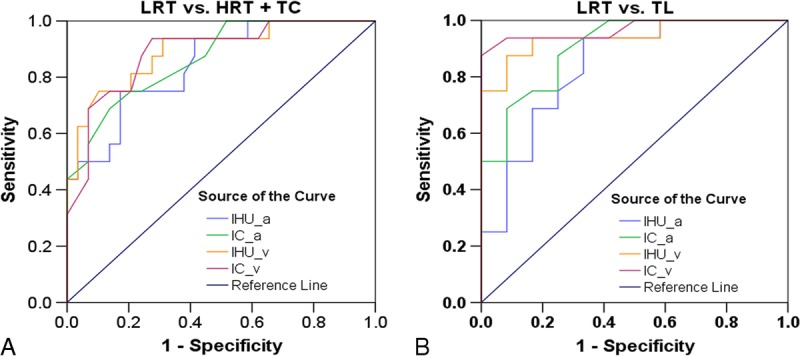
Receiver operating characteristic curves for the differentiating performance of the DECT parameters between the defined groups of thymic tumors based on pathological classification. A, LRT vs HRT or TC by the IHU_a, IC_a, IHU_v, and IC_v values. B, LRT vs TL by the IHU_a, IC_a, IHU_v, and IC_v values. Note: “a” denotes artery phase and “v” denotes venous phase. HRT indicates high-risk thymoma; LRT, low-risk thymoma; TC, thymic carcinoma; TL, thymic lymphoma. Figure 4 can be viewed online in color at www.jcat.org.
Similarly, in differentiating the low-risk thymoma from thymic lymphoma, the ROC analyses indicated that the venous phase IC value had the highest diagnostic efficacy with the AUC of 0.969, and sensitivity, specificity and the cutoff value were 87.5%, 100.0%, and 1.25 mg/mL, respectively. With regard to artery-phase IHU, IC, and MHU values as well as venous phase IHU and MHU values, the AUC were 0.836, 0.904, 0.862, 0.943, and 0.937, respectively, for differentiation of low-risk thymoma from thymic lymphoma (Table 4, Fig. 4B).
DISCUSSION
It is clinically important to accurately differentiate the thymic tumors before treatment. In the current study, we evaluated the differential diagnostic value of DECT parameters in thymic tumors. The results revealed that DECT parameters (IC, IHU, and MHU) in both artery and venous phase in patients with low-risk thymoma were significantly increased compared with those in patients with high-risk thymoma, thymic carcinoma, or thymic lymphoma. In addition, we also determined the most appropriate cutoff values for each suggested parameter, which could potentially be used in clinical practice regarding the differential diagnosis of thymic tumor before treatment.
Conventional CT with multiplanar reconstruction provides better morphological information regarding tumor internal structure and local spread for preoperative assessment, which are helpful in differentiating different pathological classifications and clinical stages of TETs.9,24–27 As in previous studies, current study detected that a smooth margin was more common in low-risk thymomas than in other thymic tumors, and necrotic or cystic changes, pericardial effusion, or pleural effusion was more often seen in thymic carcinoma or thymic lymphomas.9,24–27 The frequency of lymphadenopathy in thymic carcinomas on CT has been reported to range from 13% to 44%.9,24,27 In our study, mediastinal lymphadenopathy was seen in 21.4% of thymic carcinoma and 83.3% of thymic lymphoma patients, and no lymphadenopathy was seen in thymomas.
Iodine quantification parameters from DECT are significantly correlated with perfusion CT parameters,28 which can reflect the blood flow and assess the tumor vascularity.12,29,30 Angiogenesis is critical for tumor growth and metastasis.31 Previous research revealed a significant correlation between tumor invasiveness and angiogenesis in TET patients,22 and thymoma subtypes and thymic squamous cell carcinomas differed significantly in their vascular structure and expression of angiogenic growth factors.32 In this study, dual-phase DECT values (IC, IHU, and MHU) in patients with low-risk thymoma were significantly higher than those with high-risk thymoma, thymic carcinoma, or thymic lymphoma, which consisted with an initial result.20 Similarly, the maximal contrast-enhanced range from contrast-enhanced CT, blood volume value, and permeability from perfusion CT, and the fast diffusion coefficient (D*) value from intravoxel incoherent motion diffusion-weighted imaging in low-risk thymomas were significantly higher than that in high-risk thymomas or thymic carcinomas.5,9,33 This interesting blood flow characteristic of TETs can be explained by a pathologic research, which demonstrated that the short-spindled variant (57% histologic patterns of thymoma type A and AB) was composed of oval to short spindle cells commonly arranged in a hemangiopericytic or microcystic pattern.34 Therefore, taken together, these results suggest that DECT parameters might be valuable for differentiating thymic tumors.
In this study, we also evaluated the diagnostic efficacy of DECT parameters in differentiating the various thymic tumors. The results showed that venous phase IHU value achieved highest performance, with an AUC of 0.893, in differentiating the low- from high-risk thymomas or thymic carcinoma. The venous phase IC value obtained the highest diagnostic efficacy with the AUC of 0.969, in differentiating low-risk thymomas from thymic lymphoma. Therefore, as a supplement of the conventional CT, iodine quantification with DECT may potentially be used in clinical practice regarding the differential diagnosis of thymic tumors.
Our study had several limitations when interpreting the results. First, we drew the ROI manually, which might have introduced a sampling bias; the application of histogram analysis may improve diagnostic performance in future studies. Second, 14 patients did not undergo surgery because of the widespread invasion, and the final pathological results were proved by puncture biopsy, which may cause a study bias. Finally, because of the limited samples, we did not include the germ cell tumors, and further research is warranted to clarify this issue.
In summary, our study suggests that dual-phase DECT parameters including IC, IHU, and MHU in low-risk thymomas are significantly higher than in patients with high-risk thymoma, thymic carcinoma, and thymic lymphoma. Dual-energy computed tomography may be helpful in differential diagnosis of thymic tumors before subsequent treatment, with more quantitative information and higher efficacy compared with conventional CT examination.
ACKNOWLEDGMENT
The authors thank Dr. Yu-Yao Wang in our department for providing technical help regarding the analysis of DECT data.
Footnotes
The authors declare no conflict of interest.
This study was supported by the Science and Technology Innovation Development Foundation of Tangdu Hospital (No. 2015JCYJ010 and No. 2017LCYJ004).
W.Q.Y. and Y.K.X. have contributed equally to this work.
Our article did not receive funding for research from any of the following organizations: National Institutes of Health (NIH), Wellcome Trust, and Howard Hughes Medical Institute (HHMI).
REFERENCES
- 1.Marx A, Chan JK, Coindre JM, et al. The 2015 World Health Organization classification of tumors of the thymus: continuity and changes. J Thorac Oncol. 2015;10:1383–1395. [DOI] [PMC free article] [PubMed] [Google Scholar]
- 2.Ried M, Marx A, Gotz A, et al. State of the art: diagnostic tools and innovative therapies for treatment of advanced thymoma and thymic carcinoma. Eur J Cardiothorac Surg. 2016;49:1545–1552. [DOI] [PubMed] [Google Scholar]
- 3.Yabuuchi H, Matsuo Y, Abe K, et al. Anterior mediastinal solid tumours in adults: characterisation using dynamic contrast-enhanced MRI, diffusion-weighted MRI, and FDG-PET/CT. Clin Radiol. 2015;70:1289–1298. [DOI] [PubMed] [Google Scholar]
- 4.Padda SK, Terrone D, Tian L, et al. Computed tomography features associated with the eighth edition TNM Stage Classification For Thymic Epithelial Tumors. J Thorac Imaging. 2018;33:176–183. [DOI] [PMC free article] [PubMed] [Google Scholar]
- 5.Jing Y, Yan WQ, Li GF, et al. Usefulness of volume perfusion computed tomography in differentiating histologic subtypes of thymic epithelial tumors. J Comput Assist Tomogr. 2018;42:594–600. [DOI] [PubMed] [Google Scholar]
- 6.Benveniste MF, Rosado-de-Christenson ML, Sabloff BS, et al. Role of imaging in the diagnosis, staging, and treatment of thymoma. Radiographics. 2011;31:1847–1861. [DOI] [PubMed] [Google Scholar]
- 7.Gumustas S, Inan N, Sarisoy HT, et al. Malignant versus benign mediastinal lesions: quantitative assessment with diffusion weighted MR imaging. Eur Radiol. 2011;21:2255–2260. [DOI] [PubMed] [Google Scholar]
- 8.Takahashi K, Al-Janabi NJ. Computed tomography and magnetic resonance imaging of mediastinal tumors. J Magn Reson Imaging. 2010;32:1325–1339. [DOI] [PubMed] [Google Scholar]
- 9.Hu YC, Wu L, Yan LF, et al. Predicting subtypes of thymic epithelial tumors using CT: new perspective based on a comprehensive analysis of 216 patients. Sci Rep. 2014;4:6984. [DOI] [PMC free article] [PubMed] [Google Scholar]
- 10.Johnson TR, Krauss B, Sedlmair M, et al. Material differentiation by dual energy CT: initial experience. Eur Radiol. 2007;17:1510–1517. [DOI] [PubMed] [Google Scholar]
- 11.Lee SH, Hur J, Kim YJ, et al. Additional value of dual-energy CT to differentiate between benign and malignant mediastinal tumors: an initial experience. Eur J Radiol. 2013;82:2043–2049. [DOI] [PubMed] [Google Scholar]
- 12.Lin LY, Zhang Y, Suo ST, et al. Correlation between dual-energy spectral CT imaging parameters and pathological grades of non-small cell lung cancer. Clin Radiol. 2018;73:412.e1–412.e7. [DOI] [PubMed] [Google Scholar]
- 13.Megibow AJ, Chandarana H, Hindman NM. Increasing the precision of CT measurements with dual-energy scanning. Radiology. 2014;272:618–621. [DOI] [PubMed] [Google Scholar]
- 14.Zhang LJ, Yang GF, Wu SY, et al. Dual-energy CT imaging of thoracic malignancies. Cancer Imaging. 2013;13:81–91. [DOI] [PMC free article] [PubMed] [Google Scholar]
- 15.Baxa J, Vondrakova A, Matouskova T, et al. Dual-phase dual-energy CT in patients with lung cancer: assessment of the additional value of iodine quantification in lymph node therapy response. Eur Radiol. 2014;24:1981–1988. [DOI] [PubMed] [Google Scholar]
- 16.Mileto A, Marin D, Alfaro-Cordoba M, et al. Iodine quantification to distinguish clear cell from papillary renal cell carcinoma at dual-energy multidetector CT: a multireader diagnostic performance study. Radiology. 2014;273:813–820. [DOI] [PubMed] [Google Scholar]
- 17.Hou WS, Wu HW, Yin Y, et al. Differentiation of lung cancers from inflammatory masses with dual-energy spectral CT imaging. Acad Radiol. 2015;22:337–344. [DOI] [PubMed] [Google Scholar]
- 18.Zhang Y, Cheng J, Hua X, et al. Can spectral CT imaging improve the differentiation between malignant and benign solitary pulmonary nodules? PLoS One. 2016;11:e0147537. [DOI] [PMC free article] [PubMed] [Google Scholar]
- 19.Al-Najami I, Lahaye MJ, Beets-Tan RGH, et al. Dual-energy CT can detect malignant lymph nodes in rectal cancer. Eur J Radiol. 2017;90:81–88. [DOI] [PubMed] [Google Scholar]
- 20.Chang S, Hur J, Im DJ, et al. Volume-based quantification using dual-energy computed tomography in the differentiation of thymic epithelial tumours: an initial experience. Eur Radiol. 2017;27:1992–2001. [DOI] [PubMed] [Google Scholar]
- 21.Kim JE, Kim HO, Bae K, et al. Differentiation of small intrahepatic mass-forming cholangiocarcinoma from small liver abscess by dual source dual-energy CT quantitative parameters. Eur J Radiol. 2017;92:145–152. [DOI] [PubMed] [Google Scholar]
- 22.Tomita M, Matsuzaki Y, Edagawa M, et al. Correlation between tumor angiogenesis and invasiveness in thymic epithelial tumors. J Thorac Cardiovasc Surg. 2002;124:493–498. [DOI] [PubMed] [Google Scholar]
- 23.Travis WDBE, Müller-Hermelink HK, Harris CC. World Health Organization classification of tumours. Pathology and genetics of tumours of the lung, thymus and heart. Lyon: IARC Press; 2004:152–153. [Google Scholar]
- 24.Jeong YJ, Lee KS, Kim J, et al. Does CT of thymic epithelial tumors enable us to differentiate histologic subtypes and predict prognosis? AJR Am J Roentgenol. 2004;183:283–289. [DOI] [PubMed] [Google Scholar]
- 25.Yakushiji S, Tateishi U, Nagai S, et al. Computed tomographic findings and prognosis in thymic epithelial tumor patients. J Comput Assist Tomogr. 2008;32:799–805. [DOI] [PubMed] [Google Scholar]
- 26.Sadohara J, Fujimoto K, Muller NL, et al. Thymic epithelial tumors: comparison of CT and MR imaging findings of low-risk thymomas, high-risk thymomas, and thymic carcinomas. Eur J Radiol. 2006;60:70–79. [DOI] [PubMed] [Google Scholar]
- 27.Inoue A, Tomiyama N, Fujimoto K, et al. MR imaging of thymic epithelial tumors: correlation with World Health Organization classification. Radiat Med. 2006;24:171–181. [DOI] [PubMed] [Google Scholar]
- 28.Kang HJ, Kim SH, Bae JS, et al. Can quantitative iodine parameters on DECT replace perfusion CT parameters in colorectal cancers? Eur Radiol. 2018. [DOI] [PubMed] [Google Scholar]
- 29.Chang S, Han K, Youn JC, et al. Utility of dual-energy CT-based monochromatic imaging in the assessment of myocardial delayed enhancement in patients with cardiomyopathy. Radiology. 2018;287:442–451. [DOI] [PubMed] [Google Scholar]
- 30.González-Pérez V, Arana E, Barrios M, et al. Differentiation of benign and malignant lung lesions: dual-energy computed tomography findings. Eur J Radiol. 2016;85:1765–1772. [DOI] [PubMed] [Google Scholar]
- 31.Viallard C, Larrivee B. Tumor angiogenesis and vascular normalization: alternative therapeutic targets. Angiogenesis. 2017;20:409–426. [DOI] [PubMed] [Google Scholar]
- 32.Pfister F, Hussain H, Belharazem D, et al. Vascular architecture as a diagnostic marker for differentiation of World Health Organization thymoma subtypes and thymic carcinoma. Histopathology. 2017;70:693–703. [DOI] [PubMed] [Google Scholar]
- 33.Li GF, Duan SJ, Yan LF, et al. Intravoxel incoherent motion diffusion-weighted MR imaging parameters predict pathological classification in thymic epithelial tumors. Oncotarget. 2017;8:44579–44592. [DOI] [PMC free article] [PubMed] [Google Scholar]
- 34.Pan CC, Chen WY, Chiang H. Spindle cell and mixed spindle/lymphocytic thymomas: an integrated clinicopathologic and immunohistochemical study of 81 cases. Am J Surg Pathol. 2001;25:111–120. [DOI] [PubMed] [Google Scholar]


