Abstract.
The purpose of this study is to (1) develop metrics to characterize the regional anatomical complexity of the lungs, and (2) relate these metrics with lung nodule detection in chest CT. A free-scrolling reader-study with virtually inserted nodules (13 radiologists × 157 total nodules = 2041 responses) is used to characterize human detection performance. Metrics of complexity based on the local density and orientation of distracting vasculature are developed for two-dimensional (2-D) and three-dimensional (3-D) considerations of the image volume. Assessed characteristics included the distribution of 2-D/3-D vessel structures of differing orientation (dubbed “2-D/3-D and dot-like/line-like distractor indices”), contiguity of inserted nodules with local vasculature, mean local gray-level surrounding each nodule, the proportion of lung voxels to total voxels in each section, and 3-D distance of each nodule from the trachea bifurcation. A generalized linear mixed-effects statistical model is used to determine the influence of each these metrics on nodule detectability. In order of decreasing effect size: 3-D line-like distractor index, 2-D line-like distractor index, 2-D dot-like distractor index, local mean gray-level, contiguity with 2-D dots, lung area, and contiguity with 3-D lines all significantly affect detectability (). These data demonstrate that local lung complexity degrades detection of lung nodules.
Keywords: computed tomography, image quality, lung cancer screening
1. Introduction
Accounting for nearly 160,000 deaths in 2013, lung cancer kills more people in the US than any other type of cancer.1 Commonly, lung nodules appear as incidental findings on thoracic CT scans.2–4 In the case that a nodule is detected, the patient is managed according to the size, multiplicity, and composition of the nodules (i.e., solid versus semisolid versus ground-glass). These factors, along with patient risk-level, determine the course of diagnosis and treatment of an individual patient.3–5 In this way, the detection of lung nodules in CT scans is often the first step in the management of lung cancer. The detection of lung nodules presents a challenge to radiologists.6,7 At our institution, images are generated for each thoracic study in the form of (1) thin-section images, (2) sagittal and coronal multiplanar reformatted sections, and (3) thick () axial maximum intensity projection sections. This large amount of data, which needs to be read and interpreted by radiologists, coupled with the low prevalence of the disease but the potentially high cost of misdiagnosis makes nodule detection a challenging imaging task.
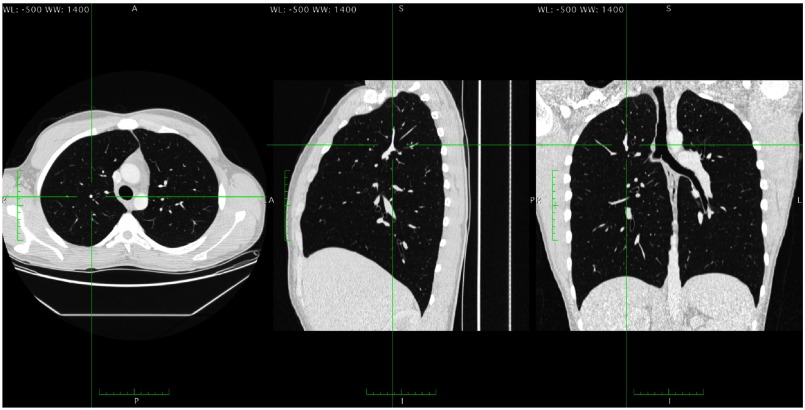
Literature suggests that sensitivity in detecting lung nodules is around 50% to 63%, despite the high inherent conspicuity of most solid nodules.8 This high conspicuity suggests that nodule detection is not a task limited by quantum noise. In fact, studies investigating the effect that lowering dose has on detection have found that dramatically lowering dose (to values of low-dose chest CTs) may still yield similar nodule detection performance.9,10 These results suggest that the quantum noise is not the largest limitation of detection accuracy for lung nodules. Rather, detection is likely limited by the complexity of the normal lung structures. In a cross-sectional CT image, the tree-like structure of the lung’s vasculature presents many nodule-like features (Fig. 1), which may have a masking effect on lung nodules. There is a need to understand the psychophysical and image perceptual processes that govern the interpretation of lung CT images. In particular, the relationship between lung nodule detectability and anatomical complexity is not well understood. A solid understanding of this image interpretation process could help in developing better technologies and search and interpretation strategies for human and computational readers.
Fig. 1.
Three orthogonal sections of a patient’s lungs. A structure that is presented as a 2-D dot in the axial plane is shown to be a blood vessel running perpendicular to the axial plane. For the axial scan, this structure would have a high 2-D dot-like distractor index, and a high 3-D line-like distractor index. It would have a low 2-D line-like distractor index, and a low 3-D dot-like distractor index.
Quantum-noise limited tasks are mostly well understood from the perspective of signal detection theory because the statistical distributions of quantum noise fields in medical images are typically well modeled by classic distributions (e.g., Poisson or multivariate Gaussian) whose statistics are mathematically tractable through observer model calculations.11 However, such an approach is not well suited for some anatomical noise fields (such as the lungs) that are not easily modeled by mathematically tractable distributions. Although the relevance of anatomical noise is well-recognized,12 there is little literature quantitatively examining the effect of anatomical noise [caused by both two-dimensional (2-D) and three-dimensional (3-D) structures in the lungs] on detectability when the reader has to search through the entire image volume. The central hypothesis of this work is that nodules located in “anatomically complex” regions are more difficult to detect than nodules that are isolated and located in anatomically simpler regions. We proffer that this masking effect (which we refer to as “anatomical noise”) partially explains why detection rates of lung nodules are lower than expected despite their high contrast-to-noise ratio. The mechanism of this effect is inherently linked to the nature of this anatomical noise, necessitating the development of metrics of local anatomical complexity beyond what are currently common practices for quantum-noise limited tasks. This paper represents a step toward that goal. The purpose of this study was to develop 2-D and 3-D metrics of local anatomical complexity and compare them with the detectability of lung nodules in real CT images read by expert human observers.
2. Methods
2.1. Human Detectability
The data for this study were drawn retrospectively from a published perception experiment in which detectability was assessed in cases enriched with virtual nodules.13 In that study, 13 radiologists were presented with 40 chest CT scans (1-mm contiguous reconstruction) and were asked to identify all lung nodules in each case. 157 solid, 30 HU nodule insertions (each one with diameter between 4.8 and 5 mm, depending on a measurement axis) were present across the 40 cases and the binary reader responses (i.e., detection or nondetection) were recorded for each individual nodule and reader (13 radiologists × 157 total nodules = 2041 binary responses). The readers were allowed to adjust the window and level settings; however, none of them changed the settings from the default (, ).
2.2. Complexity Measures
Metrics of complexity were developed to capture visually perceptible characteristics of the CT sections presented to readers. These selected metrics were driven by interviewing radiologists and collecting expert intuition of anatomical aspects that hinder the detection of nodules.14
Based on these observations, an ensemble of metrics was developed to quantify the magnitude of local anatomical complexity. Each of the metrics seeks to characterize an aspect that contributes to the “complexity” of a localized region. Values for each of the metrics were recorded for every virtually-inserted nodule and compared via a statistical model with the nodule’s rate of detection. The metrics under scrutiny were (1) local lung distractor index, (2) contiguity of inserted nodule with local vasculature, (3) number of local blood vessels, and (4) mean gray-value in neighborhood of nodule. All measures were calculated on the nodule-free substrate images before nodule insertion.
2.2.1. Local lung distractor indices
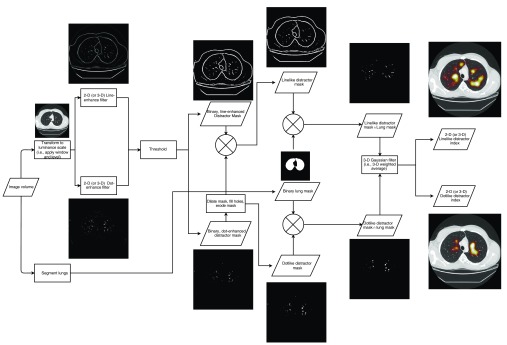
The first measures of local lung complexity were quantified “distractor indices,” which are defined as the weighted proportion of different types of distracting voxels within a local region of interest (ROI) (Fig. 2). The ROI was selected to be within an in-plane radius of 25 pixels (to capture the foveal gaze cone)13 and up to two slices in either direction from the central slab to incorporate some 3-D visual effects of through-slab scrolling. The distractor indices were calculated for four separate, distinct types of distracting structures: combinations of 2-D or 3-D structures of dots or lines. In total, these represented four individual terms recorded for each nodule: a 2-D line-like distractor index, a 2-D dot-like distractor index, a 3-D line-like distractor index, and a 3-D dot-like distractor index.
Fig. 2.
Flowchart demonstrating the computation of the distractor index.
This measurement involved three main steps such as the classification of each voxel as distracting versus nondistracting, the classification of each distracting voxel as dot-like or line-like, and the performing a 3-D weighted average of the number of distracting voxels in a local ROI around the voxel of interest. The first classification step was done by first converting the raw voxel HU values into an eight-bit gray-scale according to the window and level settings used in the reader study to correspond to the volumes that were visually presented to each reader. Next, two feature selective filters (dot and line enhancing) were applied in parallel to each image section and the outputs (using an enhancement scale range of 10 to 15 pixels, with scales—chosen to reflect the size of interesting vasculature structures) were recorded.15 These resulted in a dot-enhanced and line-enhanced image for each section in a volume. These filters were tuned to enhance image features in 2-D and 3-D, which were believed to be nodule-like and/or distracting. The enhanced images were then binarized with a global threshold (6% and 2% above the lowest gray value for 2-D and 3-D, respectively) to identify pixels that were visually considered “distracting.” These thresholds were determined empirically to strike the balance between maintaining sensitivity to distracting voxels and while managing oversensitivity to noise. Both 2-D and 3-D versions of these line- and dot-enhancing filters were used. The 2-D version of the filters selectively enhanced structures that are presented as dot-like or line-like within the section to which it is applied, whereas the 3-D version also enhanced structures with orientation perpendicular to the viewed section. That is, vessels that run through the plane of the section and are presented as round structures would likely be enhanced by both a 2-D dot-enhancing and 3-D line-enhancing filters, but not by a 2-D line-enhancing or 3-D dot-enhancing filter. Conversely, vessels that run parallel to the image plane would be enhanced by both 2-D and 3-D line-enhancing filters. Results will specify whether 2-D or 3-D versions of the line/dot-enhancing filters were used by denoting the type of distractor as 2-D or 3-D and line or dot.
To ensure the mutual exclusivity of a pixel as belonging to a dot-like or line-like structure, a secondary classification was performed. The distracting dot-like masks were dilated (using a diamond-shaped structuring element with axis length of three pixels) and filled, then subtracted from line-like masks and subsequently eroded. This process corrected for a known issue in the dot-enhancing and line-enhancing filters—namely that the edges of even the most visually circular and “dot-like” structures appear “line-like” mathematically (and are thus enhanced by the filter). By removing the distracting dot-like structures from the distracting line-like masks, the issue was corrected, and the classification of line-like and dot-like was ensured to be mutually exclusive.
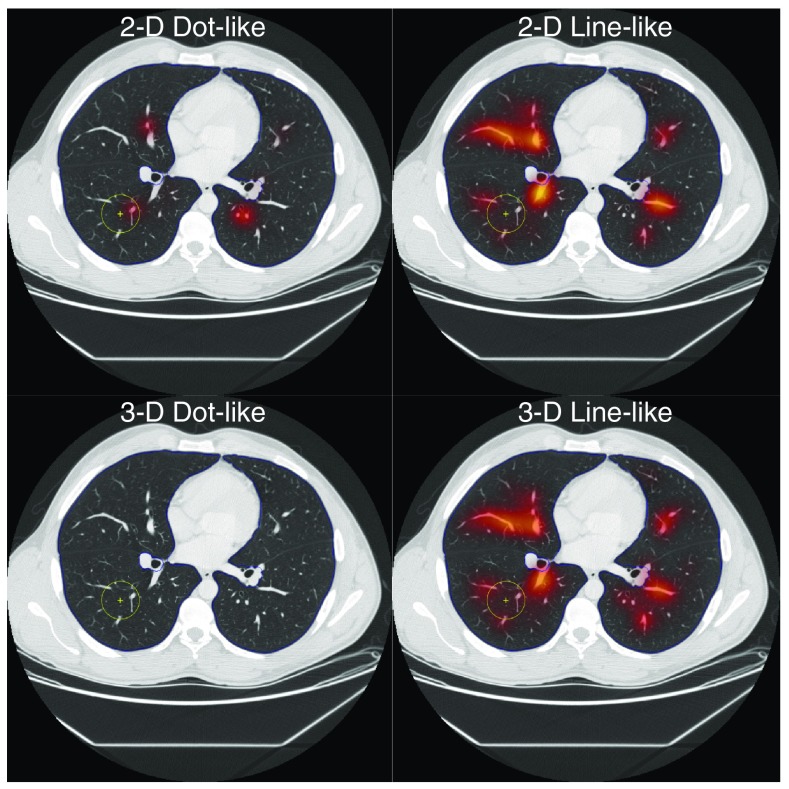
In parallel to these two processes of distractor classification, a binary mask of the lung was computed using an open-source automated segmentation program (Pulmonary Toolkit).16,17 The final classified distractor masks were defined as the intersection of the lung mask and the respective binarized dot-like or line-like images. To compute the weighted average for each voxel location, a 3-D Gaussian filter ( kernel size with STD of 12.5, 12.5, and 1.25, respectively, selected to match the size of the foveal gaze cone, with STD equal to half the cone’s radius) was convolved with the binary distractor mask, resulting in a weighted proportion of local voxels that were classified as distracting with their dot-like or line-like classification. These distractor indices were computed for each nodule location using the nodule-free images. This was possible because the nodules from the observer study were inserted virtually. Examples of the dot-like and line-like distractor indices in 2-D and 3-D are shown in Fig. 3.
Fig. 3.
Examples of the dot-like and line-like distractor indices in 2-D and 3-D for one nodule-free image substrate show which anatomy is preferentially highlighted by which distractor indices. The 2-D dot-like distractor index highlights structures that are circular and within the predetermined size range. The 2-D line-like distractor index highlights vessels that are parallel to the image section plane. As shown in Fig. 1 both of these vessels are “line-like” when considered in a 3-D space, thus they both appear to have higher 3-D line-like distractor index values. As nothing in this slice is a 3-D dot, the distractor index for 3-D dots is small for the whole slice. The yellow circle shows the location where the nodule was inserted for the reader study.
2.2.2. Contiguity with local vasculature
Contiguity with local vasculature (recorded for both 2-D and 3-D, dot-like and line-like classification—representing four individual terms) was assessed on a nodule-by-nodule basis. Nodules were determined to be contiguous with local 2-D/3-D, dot-like/line-like anatomy if they intersected with pixels that were included in the 2-D/3-D, dot-like/line-like distracting masks.
2.2.3. Number of local vessels
The quantity of local vessels was recorded as the number of connected components in the 2-D dot-like distractor map on the central section of the nodule. We expected that the detectability would decrease as a function of this quantity.
2.2.4. Local mean gray value
In an effort to determine the importance of the brightness of the local background into which the nodules were inserted, the local mean gray value in an ROI around each nodule’s insertion point was recorded. As the inserted nodules were hyperattenuating nodules, a larger mean gray value would denote a smaller difference between the inserted nodule and its area of insertion. We would expect detectability to decrease as local mean gray value increases.
2.3. Confounding Factors
Preliminary observations of detectability results also inspired the consideration of three confounding variables. The first observation was that peripheral nodules seemed to be easier to detect. Second, nodules were more easily detected in sections where only a small portion of the lung was visible. Third, there was considerable interreader variability in the detectability results. As the focus of this study was to isolate the effects of local lung complexity on nodule detectability, the three aforementioned effects were considered confounding factors. These confounding factors were controlled by three corresponding variables, namely (1) distance of nodule to the tracheal carina, (2) target region, and (3) reader. In the first of these, each nodule was characterized by its 3-D distance from the bifurcation of the trachea to control for confounding effects in the statistical analysis.
Additionally, using the lung masks developed and utilized in Sec. 2.2.1, the fraction of voxels in a section corresponding to lung tissue was recorded for each section. This term was referred to as the “target region.” A section with a larger target region corresponds to one in which lung makes up a greater portion of the image and therefore presents an area that a physician must search, potentially to the detriment of detection accuracy for nodules in that section.
The final confounding factor considered was the interreader variability. This considerable interreader variability was controlled by including a random effect for reader into the statistical analysis.
2.4. Statistical analysis
The metrics (2-D and 3-D dot-like distractor indices, 2-D and 3-D line-like distractor indices, number of local vessels, local mean pixel value, binary contiguity terms for 2-D/3-D, and dot-like/line-like structures) and confounders (target region, distance to trachea) were normalized to have a range of 0 to 1, and all nonbinary regressors were compared individually to detection accuracy (percent detected across all readers) with linear regression. Collectively, the metrics were fit to the binary reader responses with a generalized linear mixed-effects model (probit link function, no interaction terms, and random effect for readers). The magnitude of the model’s terms and corresponding -values was used to assess each metric’s effect strength and statistical significance. In addition to the model trained on all binary reader responses for each of the 157 nodules, a fivefold cross validation strategy was employed to yield less-biased estimates of the Pearson and Spearman coefficients, and the standard error of the estimate . To report the variability of the correlation coefficients and the standard error of the estimate due to training/testing partition differences, both five-fold cross validation and calculation of the statistics was repeated 1000 times, and the means and standard deviations of these values were reported.
3. Results
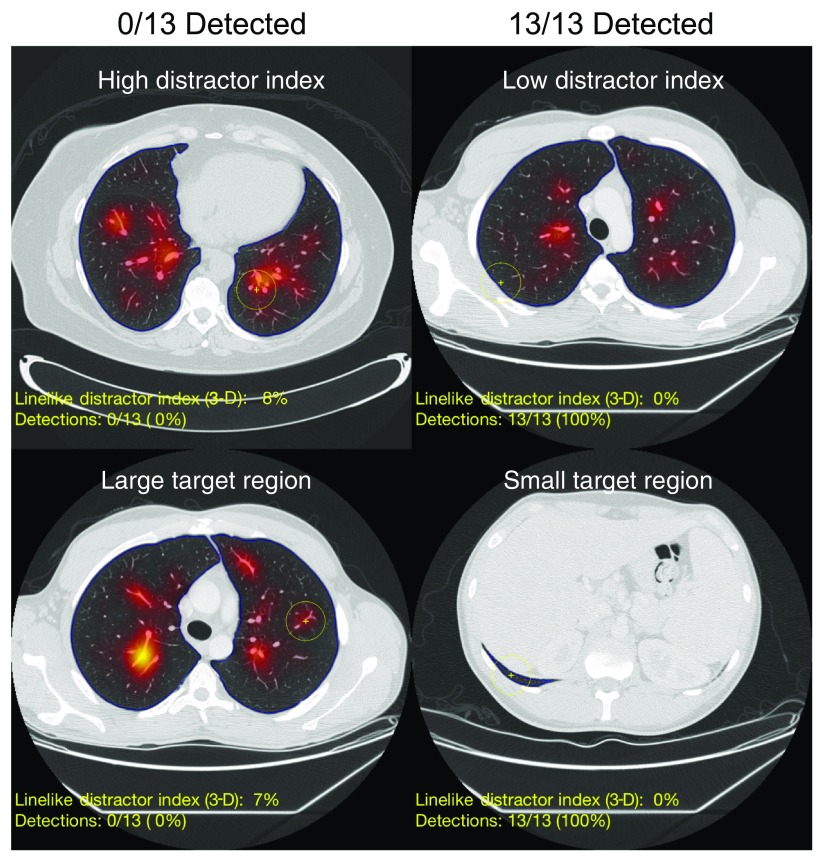
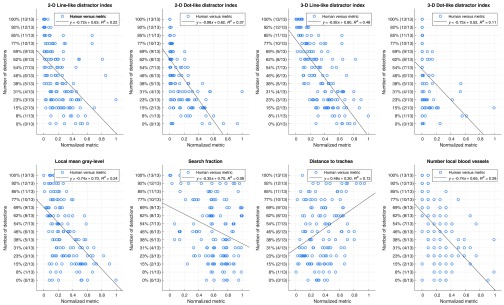
Examples of nodule-free images with 3-D line-like distractor index overlays is shown in Fig. 4. The linear regression plots are shown in Fig. 5, demonstrating how detection accuracy related to each of the continuous predictors.
Fig. 4.
Example images of nodules that were easily detected (right column) and not detected by any readers (left column). The images are overlaid with semi-transparent heat map of 3-D line-like distractor index values. Although these images are nodule-free, the yellow cross marks the corresponding nodule location for the nodule-enriched images that were shown to the readers. The blue outline denotes the segmented lung boundaries.
Fig. 5.
Univariate regressions normalized, nonbinary, complexity metrics for each nodule against the fraction of readers who detected that nodule.
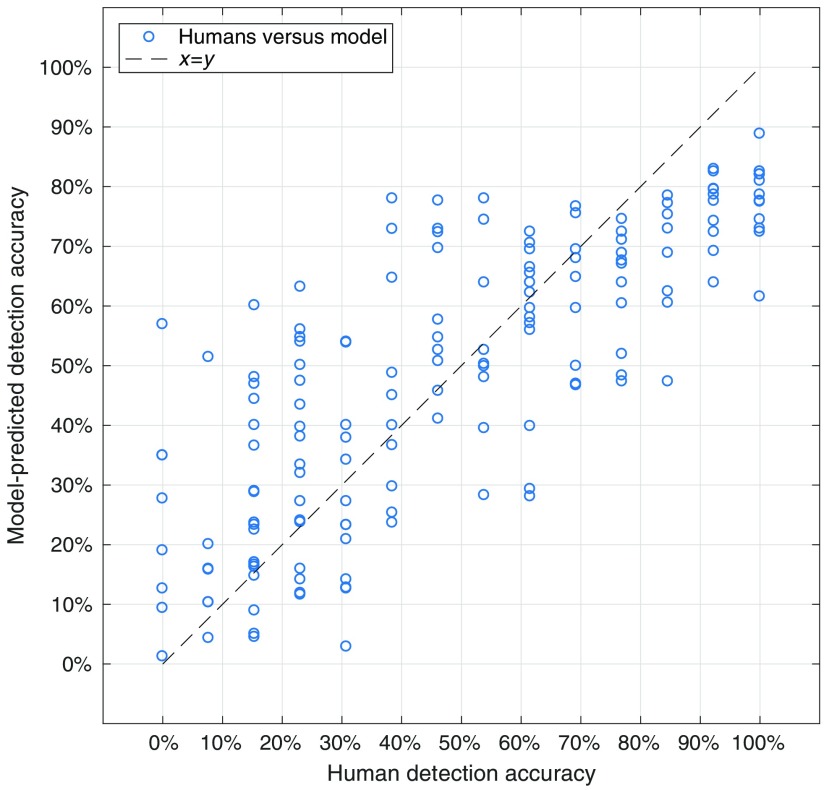
The output of the generalized linear regression using all the data is shown in Table 1. A pairwise scatter plot between the model-predicted detection accuracy, and the measured detection accuracy (averaged across all readers) for each of the 157 nodules is shown in Fig. 6 for the model fit using all the data.
Table 1.
Output of the multivariate generalized linear mixed effects statistical model fit to all responses.
| A: Model information | ||||
| Link function | Fixed effects | Random effects | AIC | BIC |
| Probit | 13 | 1 | 7325.5 | 7404.2 |
| Name | Estimate | SE | tStat | value |
| Intercept |
1.05 |
0.20 |
5.2552 |
|
| B: Continuous predictors | ||||
| Name | Estimate | SE | tStat | value |
| 2-D line-like distractor index* | 0.89 | 0.37 | 2.40 | 0.017 |
| 2-D Dot-like distractor index* | 0.35 | 0.016 | ||
| 3-D Line-like distractor Index* | 0.36 | |||
| 3-D Dot-like distractor index | 0.32 | 0.12 | ||
| Mean gray-level* |
|
0.26 |
|
0.02 |
| C: Ordinal predictors | ||||
| Name | Estimate | SE | tStat | value |
| Number of nearby vessels |
|
0.22 |
|
0.66 |
| D: Binary predictors | ||||
| Name | Estimate | SE | tStat | value |
| Contiguity with 2-D lines | 0.28 | 0.14 | 1.92 | 0.06 |
| Contiguity with 2-D dots* | 0.14 | |||
| Contiguity with 3-D lines* | 0.12 | 0.03 | ||
| Contiguity with 3-D dots |
0.25 |
0.39 |
0.65 |
0.51 |
| E: Confounders | ||||
| Name | Estimate | SE | tStat | value |
| Target region* | 0.15 | 0.04 | ||
| Distance to trachea | 0.28 | 0.17 | 1.62 | 0.10 |
An asterisk (*) denotes predictors which had a statistically significant effect ().
Fig. 6.
Comparison between the predicted detection accuracy from the multivariate generalized linear regression model and human detection accuracy for model fit using all data.
In order of decreasing effect size, 3-D line-like distractor index, 2-D line-like distractor index, 2-D dot-like distractor index, local mean gray-level, contiguity with 2-D dots, target region and contiguity with 3-D lines all significantly affected detectability (). The predictors corresponding to the 3-D dot-like distractor index, distance to the trachea, contiguity with 2-D lines, contiguity with 3-D dots, and number of local vessels did not have a significant effect (). Estimates of the Pearson and Spearman correlations between the multivariate model and the human reader data using a fivefold cross-validation scheme repeated 1000 times were and , respectively (reported as ). Reported likewise, the standard error of the estimate was .
4. Discussion
This study represents a first-order attempt to quantify the effect that local lung complexity has on detectability of pulmonary nodules. Despite the sparse assumptions of the model, relatively good correlations (Pearson and Spearman, and , respectively) and a low standard error of the estimate () were shown between the model predictions based on metrics investigated and human-based detectability.
The simplest approach at capturing the effects that influence detection inspired the inclusion of both 2-D and 3-D distractor metrics. This is because, when reading a patient’s chest CT in search of lung nodules, it is common practice to scroll longitudinally through the volume more than once, investigating smaller, more local, areas using a forward–backward scrolling motion.18,19 By searching with this scrolling motion, a physician can differentiate structures that appear as 2-D dots—that is, between vessels running perpendicular to the image plane (which track back and forth under scrolling) and nodules (which pop out and disappear).19 This difference in anatomical presentation (based on view method) inspired us to incorporate terms for both 2-D and 3-D distractors in our consideration. While both 2-D and 3-D perspectives incorporate some information about local complexity in the nearest surrounding voxel (through the Gaussian), they represent two different visual phenomena of vascular presentation. The utility of each of these metrics is shown in their relative greatest effect size amongst all regressors. Conversely, the 3-D dot-like distractor index did not have a significant effect on detectability. This is likely because the distractor index measurements were made on the substrate images that were nodule-free. As these scans were determined not to have lung nodules within them prior to insertion, the 3-D dot-like distractor index would vary very little from minimum value of 0 (which is seen in Fig. 5), as it is only nonzero for 3-D dots and nodule-like structures, which were intentionally absent from the substrate images. In total, the 2-D dot-like and line-like and 3-D line-like distractor indices were successful at characterizing one aspect of the local lung complexity. However, it was not solely this component of distracting “anatomical noise” in the area surrounding a nodule that influenced its detection.
In addition to the distractor indices, the local mean gray level in the area surrounding the nodule had a statistically significant effect on the detectability of the lung nodules. This pointed to the role of a nodule’s conspicuity in the ultimate rate of its detection. Higher conspicuities among nodules were seen in those that are present in backgrounds with lower mean gray values (as the inserted nodules themselves are hyper attenuating). This expected relationship was, therefore, confirmed here. However, no matter the conspicuity from background, sometimes the structure of nearby anatomy served to mask nodules.
This was likely why binary contiguity terms for 2-D dot-like structures and 3-D line-like structures both had statistically significant impact on lesion detection rates. The impact of these specific terms is of interest because they may both indicate contiguity to similar structures. As vessels that run longitudinally through an image plane presented as 2-D dot-like within that plane but 3-D line-like when the imaging volume as a whole is considered, contiguity with such structures would be indicated by both of these binary contiguity terms. In contrast, contiguity with 2-D lines and 3-D dots do not have statistically significant impact on detectability outcomes. The significance of the former pair of terms served to echo the heuristic that the structure of locally distracting tissues was particularly important.
The target region had a significant impact on lesion detection. This—combined with the resulting significances of the 2-D dot-like, 2-D line-like, and 3-D line-like distractor indices—suggested that the regional lung anatomy may be intimately intertwined with detection performance. As an example of this, despite expected trends between the number of local vessels and the detection shown in Fig. 5, the number of local vessels did not have a statistically significant impact on the detection of nodules. This suggested that the number of nearby 2-D dot-like structures was not enough to explain success of nodule detection or lack thereof. Rather, perhaps a more refined version of this metric, which takes into consideration the spacing and grouped structures and geometry of these simple structures, is merited.
5. Limitations
In addition to these considerations it is important to note some limitations of the study. One key limitation to the study is the virtually-inserted nature of the nodules. As the nodules were inserted virtually into the substrate images, they do not interact in the way that a real, grown nodule would with its anatomical surroundings (i.e., pulling and pushing neighboring tissues, or altering local blood supply). Although work is being done to account for these subtler effects in future studies using virtual insertion, it is worthwhile to note that the virtual insertion strategy used in this first study neglects these finer points.
Additionally, despite its successes, there are many factors in the model that could be optimized and also other metrics that could be considered to further explain the complex psychophysics of image interpretation in chest CT imaging. Improvements in the methodology could be made in one of two ways: either by improving the metric presented here, or by adding new ones that capture other confounding effects.
For an example of the former type of improvement, consider the distractor indices. The first primary step of computing the distractor indices was to classify each lung voxel as distracting or nondistracting, and further as line-like or dot-like (in both 2-D and 3-D sense). As presented, this was achieved by using shape-selective filters corresponding to features (lines and dots) that were presumed to be distracting. In reality though, distracting structures are likely neither perfectly dot-like nor perfectly line-like but rather somewhere in between. In this spirit, future analysis may avoid such binary classification altogether, instead considering a continuous variable capturing the “dotliness” or “lineliness” of local regions in the aid of calculating distractor indices. Metrics may also be improved in the focus of the structure of local complexity. Our analysis highlighted the importance of structure and of presentation and search. One such improvement could be made to augment the metric quantifying the number of local vessels. To this end, higher order “particle analysis” could be used to locally classify these vessels as discrete units of different structures (e.g., linear arrangement versus clustered).
Improvements in the modeling could also be achieved through the addition of terms that supply auxiliary information. One straightforward model augmentation would be the inclusion of information about the readers’ gaze and visual search. Such dynamic information when coupled with the static information about local complexity would undoubtedly improve the concordance of model-predicted detection accuracies and human-detection rates, and our understanding of nodule detection as a whole. Likewise, further analysis of individual reader-specific models—ones that could identify and capture aspects that may affect different readers’ search differentially—would serve to add additional nuance to the study of the impact of anatomical noise. Such analyses are reserved as the focus of a following study. However, despite their simplicity, the metrics of local complexity developed here result in a model that accounts for nodule detection rates in humans with considerable success.
6. Conclusion
This study represents a successful first attempt at studying the effect of local anatomical complexity on the detection of lung nodules. These data demonstrate that increased local lung complexity degrades the detection of lung nodules and that the distractor indices, along with local mean gray level and contiguity terms, could serve as reasonable surrogate metrics of such complexity. This initial study builds toward future work that will compare more metrics of complexity and also incorporate other confounding factors such as the lesion characteristics and reader gaze patterns.
Biographies
Taylor Brunton Smith is a PhD candidate at Duke University, where he works in the Carl E. Ravin Advanced Imaging Laboratories under the guidance of Dr. Ehsan Samei. His focus of study is in x-ray computed tomography image quality.
Geoffrey D. Rubin is George Geller professor for Cardiovascular Research, professor of radiology, and former chair of radiology at Duke University. He was previously professor of radiology at Stanford University. He pioneered the development of CT angiography and a variety of volumetric visualization and analysis techniques including automated detection of lung nodules. The current work supports his ongoing investigations of radiologist search using 4-D gaze traces as a pathway to more effective and efficient CT interpretation.
Justin Solomon received his doctoral degree in medical physics from Duke University in 2016. Currently, he is a medical physicist in the Clinical Imaging Physics Group at Duke University Medical Center’s Radiology Department. His expertise is in x-ray computed tomography imaging and image quality assessment.
Brian Harrawood is an associate in research at Duke University. He has provided computational support for many dozens of medical-image based research projects over his last 25 years working in the Carl E. Ravin Advanced Imaging Laboratory.
Kingshuk Roy Choudhury is an associate professor of Biostatistics and Bioinformatics and of Radiology at Duke University Medical Center.
Ehsan Samei is a tenured professor at Duke University, where he serves as the director of the Duke Medical Physics Graduate Program and the Clinical Imaging Physics Program. His interests include clinically relevant metrology of imaging quality and safety for optimum interpretive and quantitative performance. He strives to bridge the gap between scientific scholarship and clinical practice by (1) meaningful realization of translational research and (2) the actualization of clinical processes that are informed by scientific evidence.
Disclosures
Taylor Brunton Smith, Justin Solomon, Brian Harrawood, Kingshuk Roy Choudhury have no conflicts of interest and nothing to disclose. Geoffrey D. Rubin is a member of the Imaging Advisory Board for General Electric (GE) and has nothing else to disclose. Ehsan Samei has, unrelated to this study, active research grants with Siemens and GE, and nothing else to disclose.
References
- 1.U.S. Cancer Statistics Working Group, United States Cancer Statistics, 2016, https://nccd.cdc.gov/uscs/%5Cnhttp://www.cdc.gov/cancer/lung/statistics/ (18 April 2017).
- 2.MacMahon H., et al. , “Guidelines for management of small pulmonary nodules detected on CT scans: a statement from the fleischner society,” Radiology 237(2), 395–400 (2005). 10.1148/radiol.2372041887 [DOI] [PubMed] [Google Scholar]
- 3.Seidelman J. L., Myers J. L., Quint L. E., “Incidental, subsolid pulmonary nodules at CT: etiology and management,” Cancer Imaging 13(3), 365–373 (2013). 10.1102/1470-7330.2013.9025 [DOI] [PMC free article] [PubMed] [Google Scholar]
- 4.Alpert J. B., Naidich D. P., “Imaging of incidental findings on thoracic computed tomography,” Radiol. Clin. North Am. 49(2), 267–289 (2011). 10.1016/j.rcl.2010.10.005 [DOI] [PubMed] [Google Scholar]
- 5.MacMahon H., et al. , “Guidelines for management of incidental pulmonary nodules detected on CT images: from the Fleischner Society 2017,” Radiology 284(1), 228–243 (2017). 10.1148/radiol.2017161659 [DOI] [PubMed] [Google Scholar]
- 6.Rubin G. D., “Lung nodule and cancer detection in computed tomography screening,” J. Thorac. Imaging 30(2), 130–138 (2015). 10.1097/RTI.0000000000000140 [DOI] [PMC free article] [PubMed] [Google Scholar]
- 7.Fischbach F., et al. , “Detection of pulmonary nodules by multislice computed tomography: improved detection rate with reduced slice thickness,” Eur. Radiol. 13, 2378–2383 (2003). 10.1007/s00330-003-1915-7 [DOI] [PubMed] [Google Scholar]
- 8.Rubin G. D., et al. , “Pulmonary nodules on multi-detector row CT scans: performance comparison of radiologists and computer-aided detection,” Radiology 234(1), 274–283 (2005). 10.1148/radiol.2341040589 [DOI] [PubMed] [Google Scholar]
- 9.Nagatani Y., et al. , “Lung nodule detection performance in five observers on computed tomography (CT) with adaptive iterative dose reduction using three-dimensional processing (AIDR 3D) in a Japanese multicenter study: comparison between ultra-low-dose CT and low-dose CT by re,” Eur. J. Radiol. 84(7), 1401–1412 (2015). 10.1016/j.ejrad.2015.03.012 [DOI] [PubMed] [Google Scholar]
- 10.Yu L., et al. , “A virtual clinical trial using projection-based nodule insertion to determine radiologist reader performance in lung cancer screening CT,” Proc. SPIE 10132, 101321R (2017). 10.1117/12.2255593 [DOI] [PMC free article] [PubMed] [Google Scholar]
- 11.Barrett H. H., “Objective assessment of image quality: effects of quantum noise and object variability,” J. Opt. Soc. Am. A 7(7), 1266–1278 (1990). 10.1364/JOSAA.7.001266 [DOI] [PubMed] [Google Scholar]
- 12.Samei E., Flynn J., Eyler R., “Simulation of subtle lung nodules in projection chest radiography,” Radiology 202(1), 117–124 (1997). 10.1148/radiology.202.1.8988200 [DOI] [PubMed] [Google Scholar]
- 13.Rubin G. D., et al. , “Characterizing search, recognition, and decision in the detection of lung nodules on CT scans: elucidation with eye tracking,” Radiology 274(1), 276–286 (2015). 10.1148/radiol.14132918 [DOI] [PubMed] [Google Scholar]
- 14.Solomon J., et al. , “Development of local complexity metrics to quantify the effect of anatomical noise on detectability of lung nodules in chest CT imaging,” Proc. SPIE 10136, 101360X (2017). 10.1117/12.2254044 [DOI] [PMC free article] [PubMed] [Google Scholar]
- 15.Li Q., Sone S., Doi K., “Selective enhancement filters for nodules, vessels, and airway walls in two- and three-dimensional CT scans,” Med. Phys. 30(8), 2040–2051 (2003). 10.1118/1.1581411 [DOI] [PubMed] [Google Scholar]
- 16.Burrowes K., Doel T., Brightling C., “Computational modeling of the obstructive lung diseases asthma and COPD,” J. Transl. Med. 12(Suppl. 2), S5 (2014). 10.1186/1479-5876-12-S2-S5 [DOI] [PMC free article] [PubMed] [Google Scholar]
- 17.Burrowes K. S., et al. , “A combined image-modelling approach assessing the impact of hyperinflation due to emphysema on regional ventilation-perfusion matching,” Comput. Methods Biomech. Biomed. Eng. Imaging Vis. 5(2), 110–126 (2017). 10.1080/21681163.2015.1023358 [DOI] [Google Scholar]
- 18.Diaz I., et al. , “Eye-tracking of nodule detection in lung CT volumetric data,” Med. Phys. 42(6Part1), 2925–2932 (2015). 10.1118/1.4919849 [DOI] [PubMed] [Google Scholar]
- 19.Drew T., et al. , “Scanners and drillers: characterizing expert visual search through volumetric images,” J. Vis. 13(10), 3 (2013). 10.1167/13.10.3 [DOI] [PMC free article] [PubMed] [Google Scholar]


