

Abstract
Photochromic fluorescent proteins play key roles in super-resolution microscopy and optogenetics. The light driven structure change which modulates the fluorescence involves both trans to cis isomerization and proton transfer. The mechanism, timescale and relative contribution of chromophore and protein dynamics are presently not well understood. Here the mechanism of ‘off’ to ‘on’ state switching in dronpa is studied using femtosecond to millisecond time resolved infra-red spectroscopy and isotope labelling. Chromophore and protein dynamics are shown to occur on multiple timescales, from picoseconds to hundreds of microseconds. Following excitation of the trans chromophore a ground state primary product is formed in picoseconds. Surprisingly the characteristic vibrational spectrum of the neutral cis isomer appears only after several tens of nanoseconds. Further fluctuations in protein structure around the neutral cis chromophore are required to form a new intermediate which promotes the final proton transfer reaction. These data illustrate the interplay between chromophore dynamics and protein environment underlying fluorescent protein photochromism.
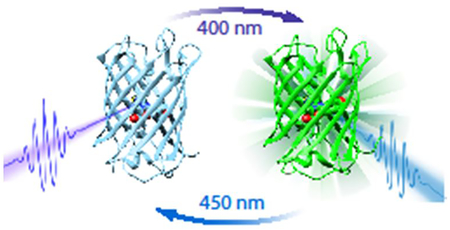
Graphical Abstract
Dronpa is the prototypical photochromic fluorescent protein.1 It can be reversibly switched between an emissive blue light absorbing ‘on’ state and a non-emissive UV-absorbing ‘off’ state by irradiation into the opposing absorption band. Further photochromic proteins have been developed with a variety of switching rates and properties.2–4 Such genetically encoded photochromism has found wide application in bioimaging, particularly in reversible protein highlighting and super-resolution microscopy, where controllable light-to-dark state switching is essential.2 More recently dronpa has become a useful tool for optogenetic control; applications to reversible optical switching of kinase and protein activity have been demonstrated.5,6 Further, dronpa exhibits potential as a component in the emerging field of bioelectronics.7
Structures for on- and off-states of dronpa have been reported.8,9 The emissive on-state shows the 4-hydroxybenzylidene imidazolinone chromophore (HBDI) to have an almost planar cis conformation (familiar from GFP) and to be H-bonded to the rigid β-barrel framework. In the off-state the chromophore is essentially non fluorescent and adopts a trans conformation (Figure 1a, b). However, in this state it exhibits a twisted geometry, with an angle of ca 30° between the two rings, while NMR data shows that it occupies a more disordered protein environment (Figure 1a).10 Electronic spectroscopy reveals the on-state to be the phenolate anion, while the distorted trans chromophore is the protonated neutral form. The transition between the two states requires a change in shape of the chromophore cavity (specifically movement of residues H193, R66 and V157), the formation of a new H-bonded network and a change in cavity charge distribution. These changes in nuclear structure modulate noncovalent interactions between the chromophore and surrounding residues, for example E144, E211 and R96 (Figure 1c, d).
Figure 1. Structure and interactions for the dronpa chromophore in ‘off’ and ‘on’ states.

31 a. Overlay of the light and dark state x-ray structures for dronpa (Pymol representation of 2POX and 2IOV) showing the structural rearrangement between the off- (distorted neutral trans, grey) and on-state (cis phenolate anion, green) forms of the chromophore. In addition to the change in chromophore structure, the reorganisation of adjacent amino acids is also shown. b. Schematic of on-state and off state chromophore structures (Atom colouring: C, grey; O, red; N, blue; H, white) and an indication of sites for isotope labelling; all calculations support a planar structure in solution for both the neutral (protonated) and anionic (phenolate) forms of HBDI. c. Plot of the interactions between the off-state chromophore and surrounding amino acid residues where H-bonding interactions are shown as green dashed lines along with the corresponding bond length (generated from ligplot32); the minimal effect of the M159T mutation on these interactions is shown in Supporting Information 4. d. Similar plot to c. for the on-state. In both c. and d. the atom colours are C, black; O, red; N, blue; H, not shown; water molecules are represented in light blue. From the comparison of c. and d. it is evident that the structural reorganisation in a. gives rise to a substantial change in the H-bond structure around the chromophore.
There is currently only limited information on the mechanism underlying the structural changes in Figure 1a–d. A number of groups probed the switching mechanism by ultrafast spectroscopy, showing that the primary step occurred on a picosecond timescale. Fron et al reported a deuterium isotope effect, suggesting a primary proton transfer step, as found in GFP.11 Using transient IR neither Warren et al.12 nor Lukacs et al.13 were able to resolve evidence for a proton transfer reaction in the excited electronic state. Warren et al. suggested ultrafast trans-cis isomerization as the primary step, while Lukacs et al. observed the same initial rate but were unable to definitively assign transient IR spectra to the expected neutral cis intermediate, and reported additional slower kinetics. Yadav et al then provided convincing evidence that transient electronic spectra could be characterised by ultrafast formation of the neutral cis intermediate, as proposed by Warren et al, and also observed formation of the emissive deprotonated on-state in tens of microseconds.14 Recently Colletier et al. confirmed ultrafast excited state relaxation in a related photochromic protein, Iris FP, and reported a structure of the cis on-state by serial femtosecond crystallography.15 The Iris FP study was very recently extended to time resolved X-ray diffraction, where a twisted chromophore structure was resolved at 3 ps, assigned to an excited state population16. All of these studies are limited by either the accessible time range (the IR and X-ray experiments) or spectral resolution (electronic transitions).
In this work we connect ultrafast to microsecond dynamics using high signal-to-noise femtosecond to millisecond transient IR difference (TRIR) spectroscopy.17 Focusing on the off-to-on state transition, we resolve the primary photochemical step and a series of ground state structural transformations. Through selective isotope labelling we reveal that ground state evolution occurs on multiple time scales and involves both the chromophore and surrounding amino acid residues; we propose an extended photoswitching mechanism. Both dronpa and its M159T mutation (dronpa2) are studied; dronpa2 has a higher off- to on-state switching cross section and recovers the off-state spontaneously, rendering it more convenient for measurement.18
Results and Discussion
Femtosecond to millisecond transient IR.
Figures 2a and b show TRIR spectra for dronpa2 during the off-to-on state transition (data for dronpa itself are very similar and are presented in Supporting Information 5). These difference spectra were recorded as a function of delay time after off-state excitation at 400 nm. Negative signals (bleaches) indicate loss of population in species associated with those IR active modes, while positive (transient) signals indicate new states being formed. The earliest time data reveal bleaches appearing immediately following excitation (Figure 2a), which reflect loss of the neutral (trans) chromophore ground state. The three prominent bleaches at 1689, 1647 and 1620 cm−1 are assigned to chromophore C=O, delocalised C=C-N=C and phenyl ring stretches respectively on the basis of earlier studies;19–21 these studies were on the neutral cis chromophore, but DFT calculations for cis and trans forms (Figure 3 and Supporting Information 6) show that these modes retain the same character and order in the trans chromophore, although shifted in wavenumber. Promptly formed transients associated with IR active modes of the excited electronic state are also observed (e.g. 1590 and 1660 cm−1), although these are less readily assigned (Figure 2a). Significantly, there are a number of bleach and transient modes in dronpa2 which have no counterpart in the spectrum of the isolated chromophore e.g. 1672 and 1607 cm−1. These signals can thus be assigned to IR active modes of protein residues perturbed in either transition moment (intensity) or frequency by electronic excitation of the chromophore. Such instantaneous perturbations indicate residues that are coupled to the chromophore by H-bonds or other electrostatic interactions (Figures 1c, d illustrate such interactions).
Figure 2. TRIR data and analysis for dronpa2 over the picosecond to 100 microsecond time scale.

a. TRIR spectra recorded with the TRMPS method (see Methods and Supporting Information 1) at early times of 2, 10 and 60 ps after excitation of the dronpa2 off-state at 400 nm in D2O buffer. The evolution on this fast timescale is dominated by recovery of the ground state, although after 60 ps there is still significant unrelaxed population (red) which can thus go on to form the product. b. TRIR data recorded at later times between 60 ps and 200 μs after excitation. These data show continued evolution in TRIR on multiple timescales ultimately leading to formation of the on-state after 200 μs. c. Global analysis of TRIR data in terms of a series of first order sequential steps focusing on the early time TRIR in a., which reveals EADS dominated by a 16 ps ground state recovery (black), but no obvious formation of a cis photoproduct, which would be expected (see text) to yield a positive signal at a frequency higher than 1689 cm−1, i.e. in the red trace. d. The later time EADS recovered from the global analysis which show successive steps leading ultimately to the final product (the cis anion) shown in light blue; note the appearance of a positive signal at higher wavenumber than the 1689 cm−1 bleach (91 ns, green). The corresponding time domain data at a number of key wavenumbers are shown in Supporting Information 8, along with the associated fits from the global analysis.
Figure 3. Density functional theory (DFT) calculated IR transition wavenumbers and intensities for the three most prominent bands of the cis (upper) and trans (lower) forms of the neutral chromophore in its natural, 1-13C and 3-13C labelled forms.

The negative scale indicates that for a 400 nm excitation of the off-state, trans IR active modes would appear as a bleach in a TRIR difference spectrum (Figure 2a) while cis formation would appear as a transient absorption. The character of the three main modes are marked as the C=O stretch, the stretch of the bridge plus imidazole ring, C=C-N=C, and a phenyl ring stretch. Wavenumbers are corrected and are tabulated in Supporting Information 6.
The spectral evolution following off-state excitation occurs over multiple time scales (Figure 2a, b). On the picosecond timescale (Figure 2a) the prominent instantaneous bleaches and transients decrease in amplitude in a few picoseconds. Focusing on the highest wavenumber C=O bleach (1689 cm−1), which is least affected by overlapping modes, a ground state repopulation of >80% occurs between 2 and 60 ps. Thus, the dominant excited state process is repopulation of the initial ground state, suggesting a low (<20%) quantum yield for the primary photoconversion step, consistent with the absolute measurement of a 14% yield in dronpa2.14 Beyond 300 ps the short lived excited electronic state has decayed11,14 and all subsequent dynamics take place in the electronic ground state. The TRIR data show substantial evolution on the time scale from 60 ps to 200 μs (Figure 2b). Specifically both the transient at 1622 cm−1 grows in amplitude and the sigmoid lineshape at 1480/1500 cm−1, formed in picoseconds, decays to the baseline on a sub nanosecond timescale. Intriguingly a new band is formed at 1702 cm−1 in several tens of nanoseconds, and decays on the microsecond timescale (Figure 2b). The final phase of the relaxation culminates in the formation of new transients at 1500 and 1576 cm−1 in >100 μs.
These data were subjected to a global kinetic analysis (see Methods and Supporting Information 7).22 For dronpa2 we assume a sequential kinetic model, and the global analysis recovers distinct evolution associated difference spectra (EADS) for each intermediate state. To adequately fit these high signal-to-noise TRIR data required a sequence of five first order steps with time constants ranging from picoseconds to hundreds of microseconds and yielding a final spectrum (Figure 2c,d); the time constants are obtained from a simultaneous global fit to four measurements of dronpa2 (i.e. including isotope data, see below). The fastest relaxation of 16 ps is associated with excited state relaxation, characterised by bleach recovery and decay of transients formed on excitation (1660 and 1590 cm−1), and leads to the formation of a new EADS, notably the transient/bleach pair at 1480/1500 cm−1 (Figure 2c); this wavenumber suggests assignment to amide backbone modes23. The second step is a 596 ps relaxation of the 1480/1500 cm−1 pair and the growth of a transient at 1622 cm−1. The third step is slower, at 91 ns, and characterised by the appearance of a transient at 1702 cm−1 and further growth in the transient at 1622 cm−1. This intermediate state decays in 4.8 μs to a further intermediate, which transforms to the final state in 156 μs, characterised by transients at 1500 and 1576 cm−1 (Figure 2b,d). From these data we conclude that dronpa photoconversion proceeds through a series of previously unresolved intermediate states.
Primary Photoproduct.
The earliest EADS in Figure 2c which decays in 16 ps is assigned to chromophore excited state decay. An important question is the identity of the primary intermediate formed (with a <20% yield, see above). Yadav et al showed this state to have a red shifted absorption and a polarisation consistent with a chromophore of protonated cis character, thus indicating excited state trans to cis isomerization, as previously assumed.12,14 However, the TRIR data in Figure 2a,c are not consistent with this picture. The highest frequency chromophore C=O stretch at 1689 cm−1 is narrow, intense and not obscured by overlapping modes. DFT calculations for the C=O mode of the planar isolated chromophore predict a ca 30 cm−1 shift to higher wavenumber between neutral trans and cis forms, with an increased transition moment (Figure 3). No such transient is resolved at higher wavenumber on the picosecond timescale. Thus, the expected signature for cis state formation is absent in the early TRIR data (Figure 2a,c).
DFT calculations are appropriate for the gas phase, so do not reflect intermolecular interactions, which may shift modes in a differential fashion. We thus address the assignment of the primary photoproduct through further experiments and calculations. We measured IR spectra of HBDI in its stable neutral cis form and in a photostationary mixture of cis and trans (Figure 4). Measurements were made in both non-H-bonding acetonitrile and in aqueous solution. These experiments reproduce the predictions of DFT calculations (Figure 3); the highest wavenumber C=O mode shifts to lower wavenumber when the trans form contributes to the spectrum. The size and direction of the shifts for the C=C-N=C and phenyl modes are also reproduced by the calculation (Figures 3, 4). It is interesting to note that the DFT calculations (below, Supporting Information 6) predict a shift to lower wavenumber for the C=O stretch on H-bonding, whereas a shift to higher wavenumber is found experimentally. This suggests that the C=O mode is also sensitive to medium polarity, although both cis and trans forms are equally effected (Figure 4). The main conclusion is that in both H-bonding and non-H-bonding solvents the C=O mode for the trans form is at lower wavenumber than for cis.
Figure 4. Steady state IR spectra for the dronpa chromophore in pure cis and cis + trans photostationary states providing an experimental check of the calculated spectral shifts in H-bonding and non-H-bonding solvents.

a. IR spectra of HBDI in D2O (pH6) before (cis, black) and during (photostationary cis + trans, red) illumination at 380 nm. b. Similar measurements for acetonitrile solution. Note the red shift of the C=O (highest wavenumber) mode and C=C-C=N modes when a fraction of the population is in the trans form, while the phenyl ring mode is unperturbed; these data are in good agreement with the DFT calculation, Figure 3.
Further DFT calculations were performed with a single water molecule H-bonded to the four potential H-bonding sites of cis and trans forms of HBDI, thus probing the wavenumber shift on H-bond formation (Supporting information 6). These data show that only the C=O stretch is strongly shifted on H-bond formation, with a down-shift of up to 27 cm−1. Significantly this H-bond shift is smaller than the shift between trans and cis forms.
Figures 3 and 4 address the planar isolated chromophore. In fact the off-state trans chromophore of dronpa is twisted, which may differentiate it from the calculations; Kaucikas et al assessed the role this plays.24 Although the frequency difference for the C=O stretch between cis and trans forms narrows in the distorted trans geometry, the cis form retains the higher frequency. Thus neither medium nor geometric effects account for the absence of the blue-shifted C=O transient of the planar cis chromophore in the first intermediate EADS; consequently this primary intermediate state’s structure remains ambiguous. We thus assign the 16 ps component to excited state decay of the trans neutral chromophore to form a primary ground state photoproduct of unresolved structure, labelled dA2, indicating a neutral (A form) ground electronic state of dronpa (d).
Product On-State Formation.
The final spectrum appears in 156 μs and is characterised by well resolved transients at 1500 and 1576 cm−1 (Figure 2b, d). In Supporting Information 5 TRIR measurements for the on-state are presented, which reveal intense bleaches at 1500 cm−1 and 1580 cm−1. The close correspondence between these and the positive signals in the final spectrum in Figures 2b, d shows unambiguously that the deprotonated cis form of the chromophore (the on-state) is produced in the final step; thus, the entire photoconversion from off- to on-state has been resolved. The final deprotonation step to form the on-state is slow, at 156 μs in D2O, somewhat longer than the 124 μs reported by Yadav et al14, although this difference may arise from their single component fit to the electronic absorption, which does not incorporate the intermediate components in Figure 2a–d. A direct comparison of the final spectrum (inverted) with the instantaneous on-state bleach is made in Supporting Information 5. Significantly this reveals that the final TRIR spectrum contains additional bleaches and transients in the 1600 – 1700 cm−1 range, indicating that protein structural reorganisation is required before the final proton transfer step occurs. We return to this point later.
Intermediate Kinetics.
The multiple intermediates required to fit the TRIR data (Figure 2c,d) demonstrate that the off- to on-state reaction is more complex than a two-step - photoisomerization followed by proton transfer - reaction. As described above, the primary (16 ps) relaxation forms dA2, an intermediate with a structure distinct from the original ground state, but lacking the spectrum characteristic of a protonated cis chromophore. The second 596 ps step we associate with relaxation in protein structure, as the observed modes at 1480/1500 and 1622 cm−1 are consistent with the amide backbone, and not similar to any known or calculated chromophore modes; we label this state as a relaxed (r) intermediate, rdA2.
Significantly, following the 596 ps formation of rdA2, a new transient appears at 1702 cm−1, i.e. to higher wavenumber than the 1689 cm−1 C=O bleach, in 91 ns; its wavenumber and amplitude are approximately those expected for the C=O of the cis neutral chromophore photoproduct absent in the earlier EADS (Figure 2c). To resolve whether this new feature is simply further reorganization of a high wavenumber mode of an interacting amino acid residue, or is due to a change in chromophore structure, we produced isotopically-labelled proteins with the chromophore 13C labelled at either the carbonyl (13C=O) or, as a control, the bridge (C–13C=C) carbon (Figure 1b). Site specific labelling was achieved from knowledge of the established mechanism of chromophore formation25 and by labelling all tyrosine residues in dronpa2 with the labels Tyrosine-1-13C or Tyrosine-3-13C (Supporting Information 3 for details). TRIR data were recorded with higher spectral resolution in the 1520 to 1780 cm−1 range. The three data sets were simultaneously analysed with a common set of rate coefficients (Supporting Information 7) thus assuming no significant effect of 13C exchange on the kinetics; the resulting EADS are shown in Figure 5.
Figure 5. Isotope effect on dronpa2 EADS recovered from a global analysis with a common set of rate constants, showing that the 1702 cm−1 transient is associated with the chromophore C=O stretch.

Data are shown for the simultaneous global analysis of a. dronpa2, b. 13C-3 dronpa2. c 13C-1 dronpa2. See Supporting Information 7 for individual kinetics. The C=O spectral region is highlighted in the inset. The spectral shifts on labelling confirm previous mode assignments. The disappearance of the 1702 cm−1 mode in c but not b. confirms its origin in the chromphore C=O mode. The subsequent evolution in this region also exposes reorganization in the protein environment on the microsecond timescale preceding the final product formation.
The expected downshift for the 13C=O mode is apparent in the 16 ps EADS, with the strong 1689 cm−1 bleach in 12C=O (Figure 5a) appearing at 1652 cm−1 (Figure 5c), in reasonable agreement with calculations (Figure 3). Interestingly the red-shift of the 13C=O bleach reveals a residual protein mode at 1689 cm−1, which underlies the 12C=O bleach (Figure 5c). Most significantly, in the 13C=O sample the 1702 cm−1 transient formed in 91 ns, evident in both wild type and 13C=C samples, is absent, establishing unambiguously that this transient arises from the chromophore C=O mode.
A straightforward explanation for the 13C sensitive 1702 cm−1 kinetics is that this 91 ns phase represents formation of the cis protonated intermediate from the relaxed intermediate, rdA2; accordingly we label this state dAcis in the proposed photocycle (Figure 6), in which this neutral cis form subsequently undergoes proton transfer to form the cis anion on-state (1500 and 1576 cm−1) on a 156 microsecond timescale, accompanied by additional protein relaxation (e.g. at 1620 and 1672 cm−1, see below). This conclusion, although consistent with the data, presents two difficulties. First, a large barrier to trans-cis isomerization via single bond rotation (ca 180 kJ mol−1) is calculated in the electronic ground state26 and second evidence from electronic spectra is consistent with a neutral cis ground state being formed in picoseconds14. The photostationary state for the chromophore in solution (Figure 4) indeed showed only very slow trans to cis recovery in the ground state (several hours in alcohol solvents27) consistent with a high barrier. Significantly however, this recovery is very environment sensitive, being greatly accelerated in aqueous solution, and by a single mutation in the protein.18,27,28 This demonstrates a major role for the medium in modifying the chromophore isomerization coordinate, suggesting an environment sensitive barrier or reaction coordinate. To accelerate the isomerization reaction from hours to 91 ns requires a remarkable reduction in an activation barrier from 180 kJ mol−1 to < 30 kJ mol−1, assuming in the latter case a pre-exponential frequency factor (A) of ca 1013 s−1. Of course the barrier is in reality a free energy barrier, and changes in the reaction coordinate, including the medium will also modify the observed rate.
Figure 6. Proposed mechanism for off-to on switching in dronpa2.

The steps in the photoconversion from off (2POX, green) to on (2IOV, cyan) structures are shown, with the associated chromophore structure shown as a molecular frame. The forward photoreaction yields a state with ill-defined chromophore structure (indicated by ‘?’), dA2, which is stabilised by relaxation in the protein environment to rdA2, which then undergoes an isomerisation over a reduced barrier (compared to the chromophore in the gas phase) to form the planar cis structure in tens of nanoseconds. Further reorganisation in the protein on the microsecond timescale facilitates the final proton transfer step.
Whatever the mechanism of this acceleration, it is evident from the multistep kinetics (Figure 2a,b) that the state formed in 16 ps is not the direct precursor of the on-state; indeed there is a four-decade time delay between excited state decay and appearance of the cis anion on-state (Supporting Information 8). Thus, dA2, the primary photoproduct, is a state able to access the protonated cis state, but has a vibrational spectrum distinct from it. We also note, following Yadav et al,14 that dA2 must have a red-shifted electronic absorption, and therefore a different electronic structure to the trans ground state. After its formation dA2 is further stabilised by protein reorganisation in 596 ps to form rdA2, followed by the 91 ns phase to form the 1702 cm−1 absorbing state with the characteristic vibrational structure of dAcis (Figure 6).
An alternative explanation for the 1702 cm−1 transient is that the protonated cis form is already present after 16 ps and stabilized in 596 ps by protein reorganization, and that the appearance of the 1702 cm−1 transient in 91 ns reflects formation of a new H-bond with the chromophore C=O. Figure 4 showed that the cis form is to higher wavenumber than trans in both H-bonding and non-H-bonding solvents, while the calculations (Figure 3, Supporting Information 6) showed that the cis form has the higher wavenumber and IR transition moment. Thus for the cis form to be absent from the second EADS requires rather a tortuous mechanism. For example the C=O stretch may be obscured if the trans ground state was non H-bonded and the formation of cis in 16 ps was accompanied by formation of a new strong H-bond at the C=O. This would then allow assignment of the 1702 cm−1 mode to a blue shift due to spontaneous dissociation of this new H-bond in 91 ns. However, the trans ground state is already H-bonded in dronpa (Figure 1c) and the loss of an H-bond would lead to decreased rather than increased amplitude in the C=O mode (Supporting Information 6) which renders this mechanism less likely. Consequently, while we cannot rule out an unusual combination of evolution in H-bond structure and protein environment, a simpler explanation is that the 91 ns component arises from formation of dAcis from a distorted precursor, rdA2, over a reduced free energy barrier. Importantly, both explanations require structural reorganization in protein and chromophore to be strongly coupled in dronpa photoconversion.
The structure of the distorted state dA2 cannot be further resolved by IR spectroscopy, but is an important target for both femtosecond crystallography and quantum mechanical calculations29; the very recent femtosecond crystallography data recovered a distorted chromophore structure formed within 3 ps, although that was assigned to an excited state species; extensions to later times will be significant15,16.
Protein reorganization in off- to on-state reaction
Discussion of the photocycle (Figure 6) has focused on chromophore dynamics, with the first three steps involving the rapid formation of dA2, its stabilization to rdA2 and relaxation to dAcis; dAcis subsequently converts to a new intermediate in 4.8 μs which ultimately undergoes proton transfer to form the on-state in 156 μs. In each of the EADS associated with this process there are non-chromophore modes which indicate structure change in the protein. As already noted, 13C=O substitution uncovered a new protein mode as an instantaneous bleach at 1689 cm−1 (Figure 5). Such high wavenumber modes in D2O are usually associated with asparagine or glutamic acid sidechains, or non-interacting arginine.23 The interaction map for the off-state (Figure 1c) reveals H-bonds between the chromophore imidazolinone ring and R91 and R66 (via W) while the phenol hydroxyl group connects to E144 (via W); the C=O stretch of E144 is thus a plausible candidate for the 1689 cm−1 bleach.
The bleach at 1672 cm−1 (Figures 2a, 5a) which has identical kinetics to the chromophore, was previously ascribed to a chromophore C=O mode, shifted in wavenumber due to a different environment.13 The absence of an isotope shift (Figure 5c), establishes this bleach as arising from a protein residue, consistent with the proposal of Kaucikas et al., who assigned a feature at this wavenumber to R66.24 The assignment of instantaneous bleaches in the earliest EADS to sidechain residues requires that those residues are perturbed instantaneously by electronic excitation, and then, in the case of the 1672 cm−1 mode, recover their initial state as the chromophore excited state decays. The reorganisation in nuclear structure between off and on states (Figure 1a) which includes a major rearrangement of R66,8 must develop over time, and will most likely not contribute to the earliest EADS. The instantaneous (<100 fs) perturbation may be associated with a strongly interacting residue, such as R91 (Figure 1c). Thus, electronic excitation is proposed to instantaneously modify frequencies of interacting residues, with R91 and E144 as primary candidates; similar effects are seen in other photoactive proteins.30
Remarkably, in the 4.8 μs EADS bleaches at both 1690 and 1672 cm−1 re-emerge (Figure 5a–c), in parallel with the disappearance of the 1702 cm−1 chromophore mode (Supporting Information S8). The reappearance of these bleaches reflects microsecond protein dynamics and could arise from the large scale reorientation of R66, apparent in the X-ray structures (Figure 1a), and the smaller shift of R91, which will result in the formation of new or stronger H-bonds (respectively) with the chromophore C=O, along with the displacement of the interacting water; collectively this could shift the chromophore C=O mode to lower wavenumber on the 1 – 10 microsecond time scale, consistent with the predictions of DFT calculations (Supplementary Information S6). The interaction map (Figure 1d) also suggests a new interaction with E140 in the on-state, which may contribute in this wavenumber range, and has the potential to interact with the H-bond network surrounding the chromophore phenolic proton donor. The further development of these protein modes in the difference spectrum preceding the 156 μs cis anion formation (e.g. the appearance of the characteristic mode at 1576 cm−1, Figure 2, 5) suggests that R66 reorientation and associated reorganisation of the H-bond network (Figure 1c,d) are precursors to, rather than a consequence of, the proton transfer reaction.
Conclusions
High signal to noise transient IR spectroscopy has been applied to probe the complete off- to on-state conversion of the photochromic photoprotein dronpa2. These data reveal a complex multistep mechanism, with a number of intermediate states in the photocycle, with lifetimes from picoseconds to tens of microseconds. The reaction is thus revealed to be more complicated than the previously characterized photoisomerization followed by proton transfer reaction. Site specific isotope editing was used to resolve chromophore dynamics from relaxation of the surrounding protein. These data show that evolution in the chromophore structure occurs on picosecond and nanosecond timescales before the final 156 μs proton transfer. We find that the vibrational spectrum expected from the cis neutral intermediate appears with a 91 ns time constant, much slower than expected. Possible assignments are discussed based on either a ground state isomerization over a reduced free energy barrier or a large spectral shift due to H-bond reorganization. The former assignment appears more consistent with calculations of H-bond shifts in the chromophore, but we note that both require reorganization of the protein environment to be intimately involved in the photoconversion reaction mechanism. After the appearance of this cis like structure there is a further fluctuation in the environment surrounding the chromophore which enables the proton transfer reaction.
Experimental Details
TRIR Measurement
The multiplex time resolved multiple probe spectroscopy used to collect the data has been described in detail elsewhere17 and in supporting information. Excitation is at 1 kHz with sub 100 fs pulses of < 1 μJ energy in a 100 micron diameter spot. Lower intensities were checked to yield identical spectra and kinetics on the nanosecond timescale. The probe pulse is broadband IR. Two instruments were used – the ‘ULTRA’ source has a 10 kHz multiplexed IR probe, while the ‘lifetime’ apparatus probe has a 100 kHz probe repetition rate and higher spectral resolution. The latter was used for the labelled samples (Figure 5) while wild type dronpa2 was measured on both with identical results. Probe transmission through the sample was recorded alternately in the presence and absence of the pump pulse to create the transient difference spectrum.
Data Analysis.
We make use of a global fitting analysis and assume a sequential kinetics model which yields evolution associated difference spectra (EADS). Equivalent fits would be obtained if we assumed a parallel kinetics model, e.g. arising from excitation of an inhomogeneous ground state population. However, the narrow bleach bands observed (Figure 2) do not suggest such an inhomogeneous population.
Samples.
Samples were prepared as described in Supporting Information 2 in D2O buffer for IR experiments and were flowed and rastered to prevent product accumulation, and irradiated at 505 nm to populate the off-state. To generate the photostationary state for steady state IR measurements (Figure 4) the sample was continuously irradiated at 380 nm.
Protein expression and labelling using tyrosine auxotroph cell line (JW2581) along with minimum media supplemented with Tyrosine-1-13C or Tyrosine-3-13C yielded >99% labelling efficiency (Supporting Information 3). Tyr 63 so labelled will produce either 13C=C or 13C=O in the chromophore biosynthesis. Other labelled tyrosine residues could in principle also respond to chromophore excitation and thus appear shifted in the TRIR isotope spectra. However, it is the amide group of tyrosine which is labelled, and 1702 cm−1 is too high a wavenumber for an amide group; further, none of the tyrosines in dronpa are in direct H-bond contact with the chromophore (Figure 1c,d).
Supplementary Material
Acknowledgements.
SRM is grateful to EPSRC for financial support (EP/N033647/1 and EP/M001997/1) PJT Thanks NSF for financial support (CHE-1223819) and we would like to acknowledge STFC for access to the Central Laser Facility. Calculations were performed on the High Performance Computing Cluster at the University of East Anglia
Footnotes
Competing Interest Statement
The authors declare no competing financial and non-financial interest.
Data Availability Statement
The data sets generated during the current study are available from the corresponding author on reasonable request.
Contributor Information
Sergey P. Laptenok, School of Chemistry, University of East Anglia, Norwich NR4 7TJ, UK
Agnieszka A. Gil, Department of Chemistry, Stony Brook University, Stony Brook, Stony Brook, NY 11794-3400, USA
Christopher R. Hall, School of Chemistry, University of East Anglia, Norwich NR4 7TJ, UK
Andras Lukacs, Department of Biophysics, Medical School, University of Pecs, Pecs, Hungary.
James N. Iuliano, Department of Chemistry, Stony Brook University, Stony Brook, Stony Brook, NY 11794-3400, USA
Garth A. Jones, School of Chemistry, University of East Anglia, Norwich NR4 7TJ, UK
Gregory M. Greetham, Central Laser Facility, Harwell Science and Innovation Campus, Didcot, Oxon OX11 0QX, UK
Paul Donaldson, Central Laser Facility, Harwell Science and Innovation Campus, Didcot, Oxon OX11 0QX, UK.
Atsushi Miyawaki, Laboratory for Cell Function Dynamics, RIKEN, 2-1 Hirosawa, Wako, Saitama 351-0198, Japan.
Peter J. Tonge, Department of Chemistry, Stony Brook University, Stony Brook, Stony Brook, NY 11794-3400, USA
Stephen R. Meech, School of Chemistry, University of East Anglia, Norwich NR4 7TJ, UK
References
- 1.Ando R, Mizuno H & Miyawaki A Regulated fast nucleocytoplasmic shuttling observed by reversible protein highlighting. Science 306, 1370–1373 (2004). [DOI] [PubMed] [Google Scholar]
- 2.Shcherbakova DM, Sengupta P, Lippincott-Schwartz J & Verkhusha VV Photocontrollable Fluorescent Proteins for Superresolution Imaging. Ann. Rev. Biophys 43, 303–329, doi:10.1146/annurev-biophys-051013-022836 (2014). [DOI] [PMC free article] [PubMed] [Google Scholar]
- 3.Zhou XX & Lin MZ Photoswitchable Fluorescent Proteins: Ten Years of Colorful Chemistry and Exciting Applications. Curr. Opin. Chem. Biol 17, 682–690, doi:10.1016/j.cbpa.2013.05.031 (2013). [DOI] [PMC free article] [PubMed] [Google Scholar]
- 4.Rodriguez EA et al. The Growing and Glowing Toolbox of Fluorescent and Photoactive Proteins. Trends Biochem. Sci 42, 111–129, doi:10.1016/j.tibs.2016.09.010. [DOI] [PMC free article] [PubMed] [Google Scholar]
- 5.Zhou XX, Chung HK, Lam AJ & Lin MZ Optical control of protein activity by fluorescent protein domains. Science 338, 810–814, doi:10.1126/science.1226854 (2012). [DOI] [PMC free article] [PubMed] [Google Scholar]
- 6.Zhou XX, Fan LZ, Li P, Shen K & Lin MZ Optical control of cell signaling by single-chain photoswitchable kinases. Science 355, 836 (2017). [DOI] [PMC free article] [PubMed] [Google Scholar]
- 7.Korpany KV et al. Conductance Switching in the Photoswitchable Protein Dronpa. J. Amer. Chem. Soc 134, 16119–16122, doi:10.1021/ja306031n (2012). [DOI] [PubMed] [Google Scholar]
- 8.Andresen M et al. Structural basis for reversible photoswitching in Dronpa. Proc Natl Acad Sci U S A 104, 13005–13009, doi:10.1073/pnas.0700629104 (2007). [DOI] [PMC free article] [PubMed] [Google Scholar]
- 9.Andresen M et al. Structure and mechanism of the reversible photoswitch of a fluorescent protein. Proc Natl Acad Sci U S A 102, 13070–13074 (2005). [DOI] [PMC free article] [PubMed] [Google Scholar]
- 10.Mizuno H et al. Light-dependent regulation of structural flexibility in a photochromic fluorescent protein. Proc Natl Acad Sci U S A 105, 9227–9232 (2008). [DOI] [PMC free article] [PubMed] [Google Scholar]
- 11.Fron E et al. Ultrafast excited-state dynamics of the photoswitchable protein dronpa. J. Amer. Chem. Soc 129, 4870–+ (2007). [DOI] [PubMed] [Google Scholar]
- 12.Warren MM et al. Ground-state proton transfer in the photoswitching reactions of the fluorescent protein Dronpa. Nat Commun 4, 1461, doi:http://www.nature.com/ncomms/journal/v4/n2/suppinfo/ncomms2460_S1.html (2013). [DOI] [PubMed] [Google Scholar]
- 13.Lukacs A et al. Protein Photochromism Observed by Ultrafast Vibrational Spectroscopy. J. Phys. Chem. B 117, 11954–11959, doi:10.1021/jp406142g (2013). [DOI] [PubMed] [Google Scholar]
- 14.Yadav D et al. Real-Time Monitoring of Chromophore Isomerization and Deprotonation during the Photoactivation of the Fluorescent Protein Dronpa. J. Phys. Chem. B 119, 2404–2414, doi:10.1021/jp507094f (2015). [DOI] [PubMed] [Google Scholar]
- 15.Colletier J-P et al. Serial Femtosecond Crystallography and Ultrafast Absorption Spectroscopy of the Photoswitchable Fluorescent Protein IrisFP. J. Phys. Chem. Letters 7, 882–887, doi:10.1021/acs.jpclett.5b02789 (2016). [DOI] [PubMed] [Google Scholar]
- 16.Coquelle N et al. Chromophore twisting in the excited state of a photoswitchable fluorescent protein captured by time-resolved serial femtosecond crystallography. Nature Chem. 10, 31–37, doi:10.1038/nchem.2853 (2018). [DOI] [PubMed] [Google Scholar]
- 17.Greetham GM et al. Time-resolved multiple probe spectroscopy. Rev. Sci. Instrum 83, doi:103107.10.1063/1.4758999 (2012). [DOI] [PubMed] [Google Scholar]
- 18.Ando R, Flors C, Mizuno H, Hofkens J & Miyawaki A Highlighted generation of fluorescence signals using simultaneous two-color irradiation on Dronpa mutants. Biophys. J 92, L97–L99, doi:10.1529/biophysj.107.105882 (2007). [DOI] [PMC free article] [PubMed] [Google Scholar]
- 19.Stoner-Ma D et al. Proton relay reaction in green fluorescent protein (GFP): Polarization-resolved ultrafast vibrational spectroscopy of isotopically edited GFP. J. Phys. Chem. B 110, 22009–22018 (2006). [DOI] [PubMed] [Google Scholar]
- 20.van Thor JJ, Ronayne KL, Towrie M & Sage JT Balance between ultrafast parallel reactions in the green fluorescent protein has a structural origin. Biophys. J 95, 1902–1912 (2008). [DOI] [PMC free article] [PubMed] [Google Scholar]
- 21.He X, Bell AF & Tonge PJ Isotopic labeling and normal-mode analysis of a model green fluorescent protein chromophore. J. Phys. Chem. B 106, 6056–6066 (2002). [Google Scholar]
- 22.Snellenburg JJ, Laptenok SP, Seger R, Mullen KM & van Stokkum IHM Glotaran: A Java-Based Graphical User Interface for the R Package TIMP. J. Stat. Softw 49, 1–22 (2012). [Google Scholar]
- 23.Barth A Infrared spectroscopy of proteins. Biochim. Biophy. Acta-Bioenergetics 1767, 1073–1101, doi:10.1016/j.bbabio.2007.06.004 (2007). [DOI] [PubMed] [Google Scholar]
- 24.Kaucikas M, Tros M & van Thor JJ Photoisomerization and Proton Transfer in the Forward and Reverse Photoswitching of the Fast-Switching M159T Mutant of the Dronpa Fluorescent Protein. J. Phys. Chem. B 119, 2350–2362, doi:10.1021/jp506640q (2015). [DOI] [PubMed] [Google Scholar]
- 25.Wachter RM Chromogenic cross-link formation in green fluorescent protein. Acc. Chem. Res 40, 120–127 (2007). [DOI] [PubMed] [Google Scholar]
- 26.Weber W, Helms V, McCammon JA & Langhoff PW Shedding light on the dark and weakly fluorescent states of green fluorescent proteins. Proc Natl Acad Sci U S A 96, 6177–6182 (1999). [DOI] [PMC free article] [PubMed] [Google Scholar]
- 27.Conyard J et al. A new twist in the photophysics of the GFP chromophore: a volume-conserving molecular torsion couple. Chem. Sci, doi:10.1039/C7SC04091A (2018). [DOI] [PMC free article] [PubMed] [Google Scholar]
- 28.Voliani V et al. Cis-trans photoisomerization of fluorescent-protein chromophores. J. Phys. Chem. B 112, 10714–10722, doi:10.1021/jp802419h (2008). [DOI] [PubMed] [Google Scholar]
- 29.Snyder JW, Fales BS, Hohenstein EG, Levine BG & Martínez TJ A direct-compatible formulation of the coupled perturbed complete active space self-consistent field equations on graphical processing units. J. Chem. Phys 146, 174113, doi:10.1063/1.4979844 (2017). [DOI] [PubMed] [Google Scholar]
- 30.Lukacs A et al. Photoexcitation of the Blue Light Using FAD Photoreceptor AppA Results in Ultrafast Changes to the Protein Matrix. J. Amer. Chem. Soc 133, 16893–16900, doi:10.1021/ja2060098 (2011). [DOI] [PubMed] [Google Scholar]
- 31.Pettersen EF et al. UCSF chimera - A visualization system for exploratory research and analysis. J. Comput. Chem 25, 1605–1612, doi:10.1002/jcc.20084 (2004). [DOI] [PubMed] [Google Scholar]
- 32.Wallace AC, Laskowski RA & Thornton JM LIGPLOT - A program to generate schematic diagrams of protein ligand interactions. Protein Engineering 8, 127–134, doi:10.1093/protein/8.2.127 (1995). [DOI] [PubMed] [Google Scholar]
Associated Data
This section collects any data citations, data availability statements, or supplementary materials included in this article.