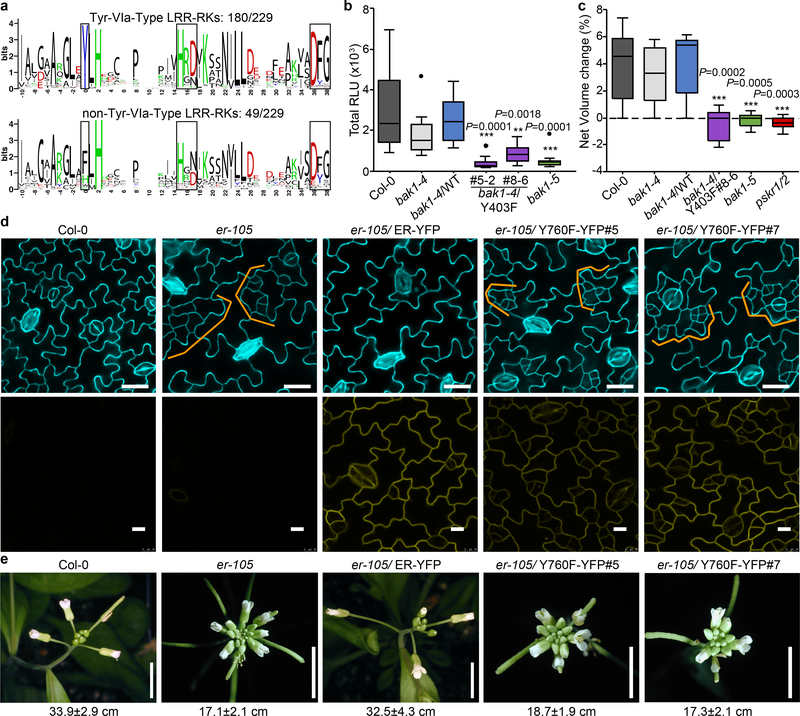
Figure 4 |. BAK1-Tyr403 and analogous Tyr phosphorylation plays a wide functional role for Arabidopsis LRR-RKs.
a, WebLogo representation of the region analogous BAK1-Y403 in Arabidopsis LRR-RKs. b, Total ROS production following treatment of n=12 biologically independent leaf discs with 100 nM Pep1 over 60 min. c, Cell expansion of mesophyll protoplasts (as measured by net volume change) following treatment with 1 nM PSK-ɑ (n=10 biologically independent protoplasts). b, c, Measurements are plotted as boxplots displaying the first and third quartiles, split by the median; whiskers extend to a maximum of 1.5 × interquartile range beyond the box. Outliers are indicated as black dots. Statistical analysis was performed using one-way ANOVA and Dunnett’s post-hoc test compared to the bak1–4/WT. d, Confocal images of abaxial cotyledon epidermis. Top panel, epidermal phenotypes from 10-day-old seedlings. Cell outlines are visualized with propidium iodide staining; bottom panel, ER-YFP expression from 3-day-old seedlings. e, Representative images of inflorescence from 4- to 5-week-old plants. Scale bars, 5 mm. The main inflorescence lengths from n= 11 (Col-0), n=18 (er-105), n=8 (er-105/ER-YFP), n=19 (er-105/Y760F-YFP #5) and n=19 (er-105/Y760F-YFP #5) biologically independent plants (7-week-old) were measured. Mean ±SEM values are indicated below the image panels. b-e, Experiments were repeated at least twice with similar results.

