

SUMMARY
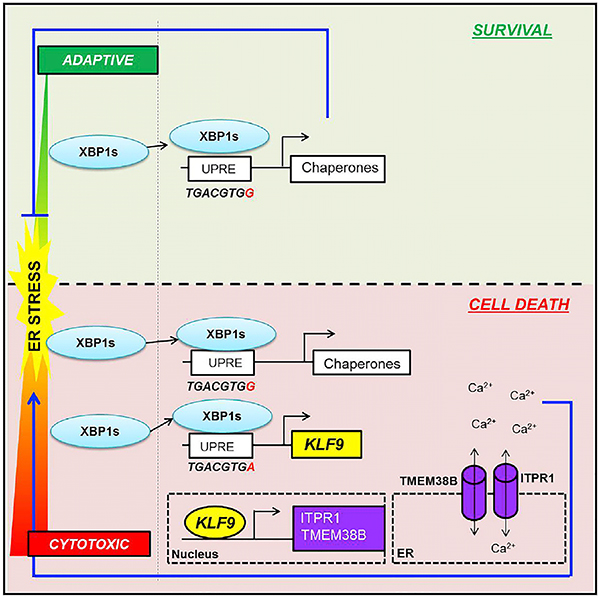
Transcription factor XBP1s, activated by endoplasmic reticulum (ER) stress in a dose-dependent manner, plays a central role in adaptive unfolded protein response (UPR) via direct activation of multiple genes controlling protein refolding. Here, we report that elevation of ER stress above a critical threshold causes accumulation of XBP1s protein sufficient for binding to the promoter and activation of a gene encoding a transcription factor KLF9. In comparison to other XBP1s targets, KLF9 promoter contains an evolutionary conserved lower-affinity binding site that requires higher amounts of XBP1s for activation. In turn, KLF9 induces expression of two regulators of ER calcium storage, TMEM38B and ITPR1, facilitating additional calcium release from ER, exacerbation of ER stress, and cell death. Accordingly, Klf9 deficiency attenuates tunicamycin-induced ER stress in mouse liver. These data reveal a role for XBP1s in cytotoxic UPR and provide insights into mechanisms of life-or-death decisions in cells under ER stress.
Graphical Abstract
In Brief
The transcription factor XBP1s plays a central role in suppression of endoplasmic reticulum (ER) stress through direct activation of multiple genes controlling protein refolding. Fink et al. report that elevation of ER stress above a certain threshold triggers an XBP1s-dependent transcriptional program, leading to exacerbation of ER stress and cell death.
INTRODUCTION
Endoplasmic reticulum (ER) stress caused by accumulation of misfolded or unfolded proteins in the ER lumen triggers a multi-faceted program termed unfolded protein response (UPR), which is aimed at restoring ER protein folding capacity (Ron and Walter, 2007; Xu et al., 2005; Hetz and Papa, 2018). UPR is activated by conformational changes in three major protein sensors, which include membrane-bound transcription factor ATF6 and trans-membrane kinases IRE1α and PERK (Hetz et al., 2015; Iurlaro and Muñoz-Pinedo, 2016; Ron and Walter, 2007). Activation of these sensors leads to a decrease in general translation, induction of ER-associated protein degradation (ERAD), and, in parallel, transcriptional induction of multiple genes encoding proteins that promote polypeptide refolding. Transactivation of these genes is achieved by UPR transcription factors that, in addition to ATF6, include ATF4 and XBP1s. ATF4 mRNA is more efficiently translated in response to PERK activation, whereas XBP1 mRNA undergoes removal of a small intron by activated IRE1α, resulting in generation of a spliced variant that encodes a functional form of XBP1 protein, XBP1s (Ron and Walter, 2007; Xu et al., 2005; Hetz and Papa, 2018). It has been argued that, among the transcription factors induced by UPR, XBP1s is considered the most important for cell survival under ER stress (Iurlaro and Muñoz-Pinedo, 2016; Tabas and Ron, 2011).
On the other hand, prolonged or severe ER stress results in cell death, and elements of UPR have been reported to play an active role in facilitating it (Han et al., 2009, 2013; Ghosh et al., 2014; Chitnis et al., 2012). The mechanisms underlying the switch from adaptive to cytotoxic (or terminal) UPR are still being investigated.
We have recently discovered that, in the case of oxidative stress, a similar dose-dependent switch from adaptive to cytotoxic response is governed by a rheostat-like mechanism (Zucker et al., 2014). This mechanism involves the major antioxidant transcription factor (NFE2L2 [nuclear factor erythroid 2 like 2] or NRF2; Kobayashi and Yamamoto, 2005), which under conditions of sublethal oxidative stress binds to the regulatory region and transactivates expression of the Krüppel-like factor 9 (KLF9) gene (Zucker et al., 2014). KLF9 partially represses transcription of genes encoding several antioxidant enzymes, most notably mitochondrial thioredoxin reductase (TXNRD2; Arnér, 2009), leading to additional moderate increase in oxidative stress, which nonetheless is sufficient for causing cell death (Zucker et al., 2014).
Cell-intrinsic programs governing response to oxidative and ER stresses are among the major pathways regulating cell viability (Kültz, 2003). We therefore hypothesized that a common transcriptional regulatory mechanism exists for oxidative and ER types of stress that transform adaptive stress response into a toxic one when the amounts of stress exceed a certain threshold. To investigate this possibility, we studied the mechanisms of activation of KLF9 and its downstream programs by ER stress and, intriguingly, identified an NRF2-independent XBP1s-KLF9 axis as a switch controlling a transition from cytoprotective to cytotoxic UPR.
RESULTS
KLF9 Is Induced by ER Stress Independently of NRF2
We have recently demonstrated that a member of the Krüppel-like transcription factor family, KLF9, is upregulated by high doses of oxidative stress. We were interested in whether ER stress activates KLF9 as well. We explored this in several models that are commonly used to study ER stress response: normal human fibroblasts (WI38); human colorectal adenocarcinoma cells (HCT116); mouse embryonic fibroblasts (MEFs); and multiple myeloma cells (MM.1S; Oh and Lim, 2009; Wang et al., 2014; Neef et al., 2014; Ullman et al., 2008). The cells were treated with increasing doses of the ER-stress-inducing agents tunicamycin (Tun) or thapsigargin (Tg). Treatment with either agent induced KLF9 mRNA and protein levels in all studied cells (Figures 1A, 1B, and S1A).
Figure 1. KLF9 Is Upregulated by ER Stress Independently from NRF2.

(A and B) Cells were treated with indicated doses of (A) tunicamycin (Tun) or (B) thapsigargin (TG) for 24 hr and probed by qRT-PCR (upper panels, KLF9/β-actin signal ratios are shown) or immunoblotting (lower panels) with indicated antibodies.
(C) Indicated cells were transduced with control (Cl) or NRF2 (Nsh1 or Nsh2) shRNAs followed by immunoblotting with the indicated antibodies.(D) Cells described in (C) were treated with indicated doses of Tun or TG for 24 hr and probed in qRT-PCR (KLF9/β-actin signal ratios are shown).
Representative images shown. All data represent mean ± SEM of 2 or more biological replicates. Statistical significance was analyzed using two-tailed Student’s t test. A p < 0.05 (*) was considered significant.
KLF9 has been identified by us as a direct target of NRF2 (Zucker et al., 2014). Because NRF2 can be upregulated by Tun or Tg, we depleted NRF2 via 2 independent short hairpin RNAs (shRNAs) in WI38 and HCT116 cells, followed by treatment with Tun or Tg. Depletion of NRF2 did not significantly interfere with upregulation of KLF9 by these agents (Figures 1C and 1D). Similar results were obtained in Nrf2 knockout MEFs (Figure S1B). We concluded that KLF9 is upregulated by ER stress independently of NRF2.
XBP1s Transcriptionally Upregulates KLF9
ATF4, ATF6, and XBP1s are the major transcriptional mediators of ER stress response (Hetz and Papa, 2018). To identify their role in KLF9 induction, we individually depleted these proteins via shRNAs in WI38 and HCT116 cells followed by treatment with Tg or Tun and assessment of KLF9 mRNA levels. ER-stress-dependent KLF9 upregulation was most sensitive to depletion of XBP1s (Figures 2A and S2). Similarly, Klf9 levels were lower in Tun-treated Xbp1 knockout MEFs compared to wild-type MEFs (Figure 2B). Reciprocally, ectopic expression of XBP1s cDNA in WI38 and HCT116 cells induced KLF9 mRNA and protein levels (Figure 2C).
Figure 2. XBP1s Transcriptionally Activates KLF9.

(A) Lysates from cells transduced with the indicated shRNAs were probed in immunoblotting with the indicated antibodies (left panels) or treated with indicated doses of Tun followed by qRT-PCR (KLF9/β-actin signal ratios are shown).
(B) Wild-type or Xbp1 knockout MEFs were probed in qRT-PCR (Klf9/β-actin signal ratios are shown).(C) Cells were transduced with empty vector (V) or XBP1s cDNA followed by immunoblotting with the indicated antibodies or probed in qRT-PCR (KLF9/β-actin signal ratios are shown).(D) DNA from indicated cells was immunoprecipitated with control (IgG) or XBP1s-specific (XBP1s) antibodies. The precipitated material was probed in qPCR with primers for KLF9 promoter.(E) HEK293FT cells were transfected with the pGL3-promoter-KLF9-WT or pGL3-promoter-KLF9 mutant promoter (lacking first 4 bp of XBP1s UPRE) and the pRLSV40 plasmid expressing the Renilla luciferase gene. Cells were co-transfected with empty vector or XBP1s cDNA. Luciferase activity was measured 24 hr post-treatment.
Representative images shown. All data represent mean ± SEM of 2 or more biological replicates. Statistical significance was analyzed using two-tailed Student’s t test. A p < 0.05 (*) was considered significant.
Analysis of regulatory regions of human, mouse, and rat KLF9 genes identified a single conserved XBP1s binding site in the region corresponding to 5′ UTR of the KLF9 gene (TGACGTGA). The site fits perfectly the unfolded protein response element (UPREs) consensus (TGACGTG(G/A); Yamamoto et al., 2004, 2008). Accordingly, chromatin immunoprecipitation (ChIP) assay performed in WI38 and HCT116 cells ectopically expressing XBP1s cDNA demonstrated enrichment of DNA fragments containing KLF9 UPRE in materials precipitated with XBP1s-specific antibodies compared to control (immunoglobulin G [IgG]) antibodies (Figure 2D).
To validate the functional importance of the identified UPRE site, we cloned a 471-bp region of the KLF9 gene containing the wild-type UPRE site into the luciferase reporter pGL3-promoter vector. We also generated a pGL3-promoter vector containing a truncated UPRE site lacking the first 4 bp via site-directed mutagenesis. Empty pGL3-promoter vector or vectors containing wild-type or mutant UPRE were co-transfected into HEK293 cells together with an empty expression vector or a vector expressing XBP1s cDNA. Mutation of the UPRE site completely abrogated XBP1s-induced luciferase expression (Figure 2E). Taken together, these data argue that KLF9 is directly targeted by XBP1s through the conserved UPRE site.
Cytotoxic Levels of ER Stress Induce XBP1S Binding to KLF9 Promoter
To further evaluate the mechanisms of KLF9 regulation by ER stress, we investigated the KLF9 dose-dependent induction by 24-hr treatment with Tun or Tg in WI38 and HCT116 cells. We noticed that upregulation of KLF9 mRNA occurred at higher Tun and Tg doses than those required for induction of ER-stress-responsive genes, including several that were previously characterized as XBP1s targets (SLC30A5, RNF19A, or RNF121; Figures 3A–3D and S3A–S3D). Importantly, KLF9 induction started to occur at doses of Tun and Tg that caused cell death 48 hr post-treatment (Figures 3E, 3F, and S3E), suggesting that KLF9 is up-regulated by toxic ER stress. To test this hypothesis, we depleted KLF9 via previously characterized shRNAs (Zucker et al., 2014) in WI38 and HCT116 cells (Figure 3G). These cells in parallel with cells expressing control shRNA were treated with toxic doses of Tun and Tg followed by assessment of cell death. KLF9 depletion substantially decreased cell death, as was evidenced by trypan blue exclusion assay that was also confirmed by annexin V assay (Figures 3H, 3I, S3G, and S3H; Table S1).
Figure 3. KLF9 Is Upregulated by Toxic Doses of Tunicamycin.

(A–D) Indicated cells treated with the indicated doses of Tun for 24 hr were probed in immunoblotting with the indicated antibodies (A and C) or in qRT-PCR (shown are ratios of signal for an indicated gene and β-actin; B and D).
(E and F) Viability of cells treated as in (A) or (D) was assessed via trypan blue viability assay.
(G) Cells transduced with control shRNA (Cl) or KLF9 shRNAs (sh1 and sh2) were probed in immunoblotting with indicated antibodies. Representative images are shown.
(H and I) Cells described in (G) were treated with Tun for 48 hr and probed in trypan blue viability assay (H) or annexin V apoptosis assay (I).
(J) Cells were treated with indicated doses of the drugs and analyzed for ROS levels using fluorescence-activated cell sorting (FACS).
All data represent mean ± SEM of 2 or more biological replicates. Statistical significance was analyzed using two-tailed Student’s t test. A p < 0.05 (*) was considered significant.
Importantly understudied conditions of Tm treatment, levels of reactive oxygen species (ROS) were not significantly upregu lated (Figure 3J). Expression of heme oxygenase 1 (Hmox1) gene, a marker of oxidative stress (Tyrrell, 1999), also remained uninduced (Figure 3B). These data further confirm ROS-independent induction of KLF9 by ER stress.
To investigate mechanisms of dose-dependent regulation of KLF9 by ER stress, we treated cells with low (0.5 μM) and high (1 μM) amounts of Tun for 24 hr, which resulted in dose-dependent upregulation of XBP1s (Figures 3A and 4A), followed by ChIP with XBP1s-specific antibodies or control (IgG). The precipitated materials were probed in qPCR with primers flanking the KLF9 UPRE or the XBP1s binding sites in the regulatory regions of HSPA5 (BiP), HERPUD1, SLC30A5, RNF19A, or RNF121 (Figure S4). XBP1s binding to KLF9 regulatory regions increased only in cells treated with 1 μM Tun (Figure 4B), whereas an increase in XBP1s binding to promoters of other genes was detected already in cells treated with 0.5 μM Tun (Figure 4B).
Figure 4. XBP1s Does Not Efficiently Interact with the UPRE in KLF9 Promoter.

(A) Indicated cells treated with the indicated doses of Tun were processed for ChIP assay and immunoprecipitated with IgG or XBP1s-specific antibodies followed by immunoblotting with XBP1s antibodies.
(B) Cells treated as in (A) were probed by qPCR with primers encompassing XBP1s binding sites in the regulatory regions of indicated genes (see Figure S4A).
(C) Nucleotide sequence of the UPRE sites in the regulatory regions of indicated genes.
(D) HEK293FT cells were transduced with the pGL3-promoter-KLF9-WT or pGL3-promoter-KLF9 mutant promoter (containing TGACGTGG sequence) and the pRLSV40 plasmid expressing the Renilla luciferase gene. Cells were co-transfected with empty vector or XBP1s cDNA. Luciferase activity was measured 24 hr post-treatment.
(E) Nuclear extracts from tunicamycin-treated wild-type and Xbp1s−/− MEFs were incubated with biotin-labeled probe containing wild-type (wt) or mutant (mut) KLF9 UPRE and resolved on native gels. Protein/DNA complexes were visualized with a chemiluminescent system.
(F) Nuclear extracts from tunicamycin-treated wild-type MEFs were incubated with a biotin-labeled probe containing a generic UPRE site and increasing amounts of unlabeled wt or mut KLF9 UPRE. Protein/DNA complexes were visualized with a chemiluminescent system.
Representative images shown. All data represent mean ± SEM of 2 or more biological replicates. Statistical significance was analyzed using two-tailed Student’s t test. A p < 0.05 (*) was considered significant.
We hypothesized that the observed difference could be due to a difference in nucleotide composition of the XBP1s binding sites in promoters of studied genes. From this viewpoint, these genes could be categorized in 2 groups. The first group includes HSPA5 and HERPUD1, which contain more than one XBP1s binding site in their regulatory regions. In addition to the UPRE, these sites include ER stress element I or II (CCAAT(N)9CCACG or ATTGG-N-CCACG, respectively; Figure S4A). The genes in the second group (KLF9, SLC30A5, RNF19A, or RNF121) contain a single UPRE site. It is conceivable that multiple XBP1s-binding elements are likely to interact more efficiently with XBP1s than a single one providing a possible explanation to the data for HSPA5 and HERPUD1. However, regions containing a single UPRE in SLC30A5, RNF19A, and RNF121 genes still demonstrate more efficient binding of XBP1s than KLF9 UPRE (Figure 4B).
Comparison of UPRE sites from the above genes revealed that KLF9 UPRE differs from the others by a single nucleotide: TGACGTGA versus TGACGTGG (Figure 4C). To determine whether such a difference would affect XBP1s-dependent activation of KLF9, we introduced a single (A→G) nucleotide substitution (TGACGTGA to TGACGTGG) in the KLF9 UPRE region in the pGL3-promoter-KLF9 construct described in Figure 2E. Next, control pGL3-promoter vector and pGL3-promoter vectors containing wild-type or mutant KLF9 UPRE were transfected into HEK293 cells together with an empty expression vector or a vector expressing XBP1s cDNA, followed by luciferase expression assay. As shown in Figure 4D, a vector containing the A→G mutant UPRE more efficiently upregulated luciferase expression in response to XBP1s overexpression than a vector with wild-type UPRE.
We hypothesized that the A→G mutation would increase XBP1s binding to KLF9 UPRE. Thus, we compared the ability of wild-type and mutated KLF9 UPREs to interact with XBP1s in electrophoretic mobility shift assay (EMSA). To this end, 32-bp-long double-stranded DNA fragments (probes) were generated corresponding to KLF9 regulatory region that contained a wild-type (WT) or an A→G mutant UPRE. First, to determine binding specificity, the WT and mutant probes were incubated with nuclear extracts from wild-type or Xbp1 knockout MEFs treated with Tun, followed by probing in EMSA. As expected, the KLF9 UPRE probe interacted with nuclear extracts from wild-type, but not Xbp1 knockout, MEFs (Figures 4E and S4B).
Next, equal amounts of wild-type and mutant KLF9 UPRE probes were individually mixed with a biotin-labeled probe containing a generic UPRE (TGACGTGG) followed by EMSA. In agreement with the luciferase reporter assay data (Figure 4D), the mutant probe was more effective in competing with the generic probe than the wild-type one (Figures 4F and S4B).
Cumulatively, our data demonstrate that KLF9 is activated by higher levels of ER stress than other studied XBP1s target genes, most likely due to the nucleotide composition of XBP1s binding site in KLF9 gene, which requires higher amounts of XBP1s for binding.
KLF9 Causes ER Stress via Upregulation of ER Calcium Release Independently from Induction of Oxidative Stress
As shown above (Figures 3G and S3G), KLF9 mediates at least in part cytotoxic effects of Tun or Tg. At the same time, overexpression of KLF9 in studied cells on its own does not induce cell death in the absence of pro-death treatments (Zucker et al., 2014; data not shown). We have recently reported that KLF9 overexpression moderately increases intracellular ROS via partial transcriptional repression of TXNRD2 gene (Zucker et al., 2014). Reciprocally, ectopic expression of TXNRD2 cDNA alleviated oxidative stress induced by KLF9 (Zucker et al., 2014). Because ROS can promote ER stress, we were interested in whether KLF9 induces ER stress by increasing ROS.
To this end, we generated WI-38 cell populations expressing KLF9 alone or in combination with TXNRD2, as previously described (Zucker et al., 2014). As was mentioned above, KLF9 overexpression did not cause cell death in the studied cells (data not shown), thus allowing investigation of KLF9-dependent pathways under physiological condition. As expected, ectopic expression of TXNRD2 blunted the ROS increase caused by KLF9 but had only a marginal effect on the induction of ER stress markers (Figures 5A and 5B), suggesting that KLF9 induced ER stress in large part via ROS-independent mechanisms.
Figure 5. KLF9 Increases Intracellular Calcium Levels.

All experiments were performed in WI38 cells.
(A) Cells expressing the indicated constructs were analyzed for ROS levels using FACS.
(B) Cells described in (A) were probed in qRT-PCR with the indicated probes (shown are ratios of signal for an indicated gene and β-actin).
(C) Cells transduced with V or KLF9 cDNA (KLF9) were probed in immunoblotting with indicated antibodies (left panel) or in qRT-PCR with the indicated probes (right panel; shown are ratios of signal for an indicated gene and β-actin).
(D) DNA from cells overexpressing KLF9 cDNA was immunoprecipitated with control (IgG) or KLF9-specific (KLF9) antibodies. The precipitated material was probed in qPCR with primers for TMEM38B or ITPR1 promoters.
(E) Cells transduced with control shRNA (Cl) or KLF9 shRNAs (sh1 and sh2) were probed in immunoblotting with indicated antibodies (left panel) or in qRT-PCR with the indicated probes (right panel; shown are ratios of signal for the indicated gene and β-actin).
(F) Cells were treated with indicated doses of Tun for 24 hr followed by qRT-PCR with the indicated probes (shown are ratios of signals for an indicated gene and β-actin).
(G) Cells expressing empty vector, KLF9 cDNA, TXNRD2 cDNA, or co-expressing these constructs (as in A) were probed for intracellular calcium content using Fluo-4 Direct Calcium Assay Kit.
(H) Control and KLF9-depleted cells (described in E) were treated with indicated doses of Tun for 24 hr followed by qRT-PCR with the indicated probes (shown are signal ratios for an indicated gene and β-actin).
(I) Cells described in (H) were probed for intracellular calcium content using Fluo-4 Direct Calcium Assay kit.
(J) Cells were transduced with the control shRNA (Cl) or ITPR1 shRNAs (ITsh1 and ITsh5) or TMEM38B shRNAs (TMsh1 and TMsh3) followed by immunoblotting with indicated antibodies.
(K) Cells expressing indicated constructs were probed for intracellular calcium content using Fluo-4 Direct Calcium Assay Kit.
(L) Cells expressing indicated constructs were probed in qRT-PCR with the indicated probes (shown are ratios of signal for an indicated gene and β-actin).
(M) Cells described in (K) were treated with indicated doses of Tun for 48 hr and analyzed by trypan blue viability assay.
Representative images shown. All data represent mean ± SEM of 2 or more biological replicates. Statistical significance was analyzed using two-tailed Student’s t test. A p < 0.05 (*) was considered significant.
To identify KLF9 target genes mediating KLF9-dependent ER stress, we performed global RNA sequencing (RNA-seq) analysis in WI38 cells either overexpressing exogenous KLF9 or depleted of endogenous KLF9 using a previously validated shRNA (Zucker et al., 2014). We identified 46 genes oppositely regulated by KLF9 overexpression and depletion, out of which 11 genes have been previously shown to participate in ER biogenesis (Table S2). Individual analysis of these genes revealed that only 2 of them, transmembrane protein 38B (TMEM38B) and inositol 1,4,5-trisphosphate receptor type 1 (ITPR1), responded to KLF9 overexpression and interacted with it in ChIP assay (Table S2; Figures 5C, 5D, and S5A). Accordingly, KLF9 depletion decreased levels of TMEM38B and ITPR1 mRNA (Figure 5E). Furthermore, the mRNA levels of both genes were also induced by Tun or Tg at doses that upregulate KLF9 (Figure 5F). ITPR1 and TMEM38B have been previously reported to promote ER calcium release (Cabral et al., 2016; Taylor et al., 1999). Moreover, the activity of ITPR1 appears to depend on TMEM38B (Taylor et al., 1999).
Release of calcium from ER is a critical contributor to cytotoxicity of ER stress. An observation that KLF9 transcriptionally regulates ITPR1 and TMEM38B suggests that KLF9 may be involved in the regulation of calcium levels. To test this directly, we ectopically expressed KLF9 in WI38 cells followed by assessment of cytosolic calcium using the Fluo-4 Direct Calcium Assay Kit (Invitrogen). Intracellular calcium levels were increased by KLF9 overexpression (Figure 5G, left panel). Superinfection with TXNRD2 attenuated KLF9-induced ROS (Figure 5A) but did not affect cytosolic calcium levels in the same cells (Figure 5G, right panel). Accordingly, treatment of KLF9-depleted WI38 cells with Tun resulted in less pronounced transcriptional activation of TMEM38B and ITPR1 (Figure 5H) and lower cytosolic calcium (Figure 5I) when compared to similarly treated control cells.
Importantly, KLF9-dependent increase in intracellular calcium was diminished by shRNA depletion of TMEM38B or ITPR1 (Figures 5J and 5K) without altering KLF9-induced ROS (Figure S5B). Furthermore, shRNA-mediated depletion of TMEM38B or ITPR1 decreased the Tun-induced ER stress (Figure 5L) and cell death in WI38 cells (Figure 5M; Table S3).
Taken together, our data support the existence of the following axis that underlines the ability of XBP1s to execute a switch from pro-survival to pro-death ER stress response via imposing additional level of ER stress:
above the threshold ER stress→XBP1s→KLF9→TMEM38b+ITPR1→ER calcium release→ER stress→cell death.
Klf9 Deficiency Decreases Tunicamycin-Induced ER Stress in Mouse Liver
To evaluate the role of Klf9 in the induction of the ER stress in vivo, we injected Tun or vehicle intraperitoneally into wild-type and Klf9 knockout 3-month-old mice at a dose of 2 mg/kg, as has been previously described (Lee et al., 2012). Mouse liver tissues were collected 30 hr post-injection and analyzed for expression levels of ER stress markers Edem1 and Hspa5 using qRT-PCR or for lipid deposition (accumulation of hepatic triglycerides is a hallmark of tunicamycin-induced ER stress in liver) using oil red O staining (Yamamoto et al., 2010). Liver tissues from Klf9 knockout mice treated with Tun had lower levels of ER stress markers (as well as mRNA levels of Tmem38b and Itpr1; Figure 6A) and decreased lipid deposition compared to livers from wild-type mice (Figures 6B and 6C), thus demonstrating the functional role of Klf9 in control of ER stress in vivo.
Figure 6. Klf9 Deficiency Decreases ER Stress Markers and Hepatic Steatosis in Mice.

(A) WT and Klf9 knockout mice (KO) mice were injected intraperitoneally with vehicle (V) or Tun. The animals were euthanized, and the livers were excised 30 hr post-injection. RNA isolation and expression of the indicated genes was assayed by qRT-PCR (shown are ratios of signal for an indicated gene and β-actin).
(B) Sections of livers from mice described in (A) were fixed in formalin and stained with oil red O.
(C) Quantification of oil red drops in samples described in (B).
Representative images shown. All data represent mean ± SEM of 2 or more biological replicates. Statistical significance was analyzed using two-tailed Student’s t test. *p < 0.05; **p < 0.01. A p < 0.05 was considered significant.
DISCUSSION
ER stress is a condition under which the levels of unfolded proteins exceed the ER’s intrinsic folding capacity (Ron and Walter, 2007; Xu et al., 2005; Hetz and Papa, 2018). ER stress leads to the activation of a well-orchestrated signaling pathway known as the UPR. The goal of the UPR is to restore ER homeostasis via several pathways, including transcriptional activation of genes that increase the ER folding capacity and decrease the cells ability to synthesize new proteins (Ron and Walter, 2007; Xu et al., 2005; Hetz and Papa, 2018). If these measures fail, the UPR switches from adaptive (cytoprotective) to terminal (cytotoxic) mode (Iurlaro and Muñoz-Pinedo, 2016; Tabas and Ron, 2011).
Although several UPR effectors have been assigned a proapoptotic activity under conditions of prolonged or severe ER stress, including the ATF6→CHOP or PERK→ATF4→CHOP axes, the exact mechanisms explaining dose-dependent switch from adaptive to cytotoxic response have been shown only for very few. For example, high-order IRE1α oligomerization caused by unresolved ER stress increases IRE1a affinity to multiple mRNAs or microRNAs containing IRE1α-dependent decay (RIDD) signals, ultimately resulting in their degradation and apoptosis (Han et al., 2009, 2013; Ghosh et al., 2014). Similarly, PERK-mediated adaptive ER stress response is countered by PERK-dependent upregulation of pro-apoptotic CHOP protein (Hetz and Papa, 2018). It has been shown that, in parallel, PERK can induce expression of miR-211 that attenuates transcriptional activation of CHOP, thus allowing cells to cope with ER stress prior to induction of CHOP-dependent apoptosis (Chitnis et al., 2012).
In the current study, we characterized a principally different mechanism based on transcriptional regulation of the transition from adaptive to terminal UPR by the same transcriptional factor, XBP1s. Interestingly, unlike other UPR transcription factors, such as ATF4, ATF6, or CHOP, XBP1s has not been considered as a mediator of cytotoxic UPR or as an inducer of cell death in general, with very few exceptions (Zeng et al., 2009; Margariti et al., 2013). The role of XBP1s in adaptive UPR is usually accounted for by the transcriptional activation of genes encoding ER-resident chaperones (Lee et al., 2003), leading to reduction of ER stress and subsequently cell survival.
In the current paper, we demonstrate that, upon increase of ER stress above a certain threshold, elevation in XBP1s amounts leads to its binding to the promoter and transcriptional upregulation of the KLF9 gene that results in additional calcium release from the ER, aggravation of ER stress, and a proportional increase in cell death. It should be noted, however, that, by itself, overexpression of KLF9 is not toxic to the studied cells (Zucker et al., 2014). Therefore, KLF9-dependent increase in calcium release under conditions of excessive ER stress only adds to the major pro-apoptotic signaling induced by other branches of terminal ER stress response (e.g., apoptosis induced by transcription factor CHOP; Ron and Walter, 2007).
The sequence of KLF9 UPRE (TGACGTGA) is conserved among human, mouse, and rat genomes, potentially underlying the evolutionary significance of this basic cellular response to high levels of ER stress. Coincidently, UPREs in other bona fide XBP1s targets containing only one XBP1s binding site differ from KLF9 UPRE by a single nucleotide (G versus A; TGACGTGG). Our data suggest that the observed differences between KLF9 and other XBP1s targets with regard to activation by Tun or Tg or XBP1s binding is due to the above-mentioned difference in their UPRE sequences. It is noteworthy that a complementary strand of non-KLF9 UPREs (CCACGTCA) contains CCACG sequence, which is a part of ER stress elements (ERSEs) I or II (CCAAT(N)9CCACG or ATTGG-N-CCACG, respectively). In contrast, the complementary KLF9 UPRE contains instead TCACG, which is not a part of ERSE sites. The CACCG sequence in ESRE sites binds XBP1s (or ATF6), albeit only if NF-Y factor interacts with another part of ERSE site (Yamamoto et al., 2004; Kokame et al., 2001). It is conceivable that interactions of a canonical UPRE site on one DNA strand with XBP1s may be further increased by the presence of a “conditional” XBP1s binding site (such as CCACG) on a complementary strand.
Our study provides an illustration of how a difference in the affinity of pro-survival and pro-apoptotic targets lets a single transcription factor transform a continuously increasing ER stress signal into qualitatively different outcomes, cell survival, or death.
We have previously reported that KLF9 is activated by the major antioxidant transcription factor NRF2 when ROS levels exceed a certain threshold. KLF9 induction causes further increase in ROS, ultimately leading to cell death. We demonstrated that this dose-dependent induction was mediated by the exact base pair composition of the antioxidant response element (ARE) in the KLF9 promoter. Unlike many other NRF2 target genes, the KLF9 AREs contained no embedded AP-1 consensus sites, which have been shown to increase transcriptional activity of NRF2 (Soriano et al., 2009; Zucker et al., 2014). Interestingly, like KLF9 UPRE, the KLF9 ARE sequences were also conserved across rodents and human.
Thus, we found it remarkable that a similar dose-dependent mechanism exists for both oxidative and ER stress that is mediated by the nucleotide composition of stress-responsive elements in the regulatory sequences of the same gene, KLF9.
Importantly, a two-phase response (first protective and then cytotoxic) is a common scenario for many types of cell stress. Therefore, it is tempting to speculate that the switch to lower affinity targets represents a general paradigm of how a single sensor can drive disparate patterns of cell behaviors in response to quantitative changes in an incoming signal. It remains to be seen how broadly this model is utilized in nature and whether it can account for some of the controversial assignments of both pro-survival and pro-death functions to the same protein. It is worth mentioning that high-throughput annotation of the targets of transcription factors often fails to discriminate between sites with different affinity. Our work suggests that a failure to discern such differences may obscure the molecular basis for fundamentally non-linear behaviors of biological systems.
We demonstrated that KLF9 is capable of inducing ER stress via transcriptional regulation of two genes encoding ER membrane ion channels, TMEM38B and ITPR1. TMEM38B (TRIC-B) was shown to increase intra-ER potassium levels, which promotes calcium release by the ITPR1 calcium channel (Cabral et al., 2016). Although the role of TMEM38B in cell death is understudied, downregulation of ITPR1 prevented apoptosis (Camandola et al., 2005), which is in agreement with our findings that individual depletion of ITPR1 decreases Tun-induced expression of ER stress markers and eventually cell death.
We have previously reported that KLF9 overexpression moderately increases intracellular ROSs, which by themselves are not toxic in fibroblasts (Zucker et al., 2014). Interestingly, suppression of KLF9-dependent ROS via overexpression of TXNRD2 (a direct target of KLF9; Zucker et al., 2014) in these cells did not significantly reduce levels of KLF9-induced ER stress markers. Reciprocally, depletion of ITPR1 or TMEM38B suppressed KLF9-induced cytoplasmic calcium levels but did not affect KLF9-induced ROS. These observations suggest that, in our experimental conditions, KLF9 induces oxidative stress and ER stress via separate mechanisms. On the other hand, we cannot exclude the possibility that induction of KLF9 by Tun generates KLF9-dependent oxidative stress that also contributes to cell death.
Taken together, our findings help elucidate the molecular mechanisms underlying the transition from adaptive to terminal UPR.
STAR★METHODS
KEY RESOURCES TABLE
| REAGENT or RESOURCE | SOURCE | IDENTIFIER |
|---|---|---|
| Antibodies | ||
| Anti-KLF9 | Santa Cruz Biotechnology | Sc-12996; RRID:AB_2280771 Sc-12994; RRID:AB_2130595 |
| Anti-TXNRD2 | Santa Cruz Biotechnology | Sc-46279; RRID:AB_2210249 |
| Anti-ATF4 | Santa Cruz Biotechnology | Sc-200; RRID:AB_2058752 |
| Anti-β-tubulin | Santa Cruz Biotechnology | Sc-8035; RRID:AB_628408 |
| Anti-XBP1 | Santa Cruz Biotechnology | Sc-8015; RRID:AB_628449 |
| Anti-CHOP | Santa Cruz Biotechnology | Sc-7351; RRID:AB_627411 |
| Anti-ITPR1 | Invitrogen | PA1-901; RRID:AB_2129984 |
| Anti-TMEM38B | Invitrogen | PA5-20859; RRID:AB_11152440 |
| Anti-ATF6 | Novus Biologicals (Littleton, CO; RRID:AB_2058774) | NBP1-40256 |
| Normal mouse IgG | Santa Cruz Biotechnology | Sc-2025; RRID:AB_737182 |
| donkey anti-goat IgG-HRP | Santa Cruz Biotechnology | Sc-2020; RRID:AB_631728 |
| goat anti-mouse IgG-HRP | Santa Cruz Biotechnology | Sc-2005; RRID:AB_631736 |
| goat anti-rabbit IgG-HRP | Santa Cruz Biotechnology | Sc-2004; RRID:AB_631746 |
| Chemicals, Peptides, and Recombinant Proteins | ||
| Tunicamycin | Sigma-Aldrich | T7765 |
| Thapsigargin | Sigma-Aldrich | T9033 |
| Protein A/G agarose beads | Thermo Fisher | #20421 |
| Oil-red O stain and fixative | SclenCell research laboratories | #0843a and #0843b |
| DMEM media | Invitrogen | #11995-065 |
| RPMI media | Invitrogen | #11875-093 |
| phosphate buffered saline | Invitrogen | #10010-023 |
| Trypsin-EDTA | Invitrogen | #25300-054 |
| L-glutamine | Invitrogen | #25030-081 |
| HEPES | Invitrogen | #15630-080 |
| Sodium pyruvate | Invitrogen | #11360-070 |
| Anti Anti | Invitrogen | #15240-062 |
| Trypan blue stain | NutrCyte | #02-0108-0100 |
| SuperFect reagent | QIAGEN | #301305 |
| Taqman Universal Master Mix II | Applied Biosystems | #4440038 |
| SYBR Green PCR Master Mix | Applied Biosystems | #4367659 |
| CMH2DFCDA | Invitrogen | C6827 |
| Biodyne® B nylon membranes | Thermo Fisher | #77016 |
| Critical Commercial Assays | ||
| MycoAlert mycoplasma detection kit | Lonza | #LT07-318 |
| Dual-Luciferase Assay Kit | Promega | E2920 |
| subcellular protein fractionation kit | Thermo Fisher | 78840 |
| LightShift Chemiluminescent EMSA Kit | Thermo Fisher | 20148 |
| Chemiluminescent nucleic acid detection module | Thermo Fisher | 89880 |
| PureLink® RNA Mini kit | Thermo Fisher | #12183025 |
| cDNA reverse transcription kit | Invitrogen | #4368814 |
| Fluo-4 Direct Calcium Assay Kit | Thermo Fisher | F10471 |
| TruSeq Stranded mRNA kit | Illumina | #RS-122-2101 |
| Deposited Data | ||
| RNA-seq from WI38 cell populations | This paper | GEO: GSE119427 |
| Experimental Models: Cell Lines | ||
| HEK293FT | Clonetech | #632180 |
| MM.1S | American Type Culture Collection | ATCC® CRL-2974 |
| WI-38 | American Type Culture Collection | ATCC® CCL-75 |
| HCT116 | American Type Culture Collection | ATCC® CCL-247 |
| Nrf2 knockout MEFs | Dr. Masayuki Yamamoto (University of Tsukuba, Japan) | N/A |
| Xbp1 knockout MEFs | Dr. Ann-Hwee Lee (Weill Cornell Medical College) | N/A |
| Experimental Models: Organisms/Strains | ||
| C57BL/6J | N/A | |
| KLF9 knockout mice in a C57BL/6J background | N/A | |
| Oligonucleotides | ||
| See Table S4 | N/A | |
| Recombinant DNA | ||
| pCMVdeltaR8.2 | Addgene | #12263 |
| pCMV-VSV-G | Addgene | #8454 |
| XBP1s expressing plasmid | Genecopoeia (Rockville, MD) | EX-Z4299-Lv105-B |
| shRNAs for KLF9 | Sigma-Aldrich | SHCLNG-NM_001206 |
| shRNAsfor ITPR1 | Sigma-Aldrich | SHCLNG-NM_002222 |
| shRNAs for TMEM38b | Sigma-Aldrich | SHCLNG-NM_018112 |
| shRNAs for XBP1 | Sigma-Aldrich | SHCLNG-NM_005080 |
| shRNAs for ATF4 | Sigma-Aldrich | SHCLNG-NM_001675 |
| shRNAs for ATF6 | Sigma-Aldrich | SHCLNG-NM_007348 |
| pGL3 promoter plasmid | Promega | #E1761 |
| Software and Algorithms | ||
| R statistical software (v. 3.4.2) | N/A | |
| DESeq2 workflow103 | N/A | |
| QuantStudioTM sequence detection software | Applied Biosystems | N/A |
CONTACT FOR REAGENT AND RESOURCE SHARING
Further information and requests for reagents should be directed to the Lead Contact, Mikhail Nikiforov (mnikifor@wakehealth.edu).
EXPERIMENTAL MODEL AND SUBJECT DETAILS
Mice
All experiments involving animals were approved by the institutional Animal Care and Use Committee. All mice were maintained at ambient temperature and humidity and provided food and water ad libitum. Pharmacological induction of ER stress in mice was performed according to previous studies (Lee et al., 2012). Both males and females mice have been used. 3 month old wild-type mice or KLF9 knockout mice of both on a C57BL/6J background were injected intraperitoneally with TUN (2 μg/gram body weight) or vehicle control (150 μM dextrose). At 30 hours after TUN injection, liver tissue was collected for Oil-red O staining and quantitative real-time PCR analysis. Frozen liver tissue sections were stained with Oil-red O for lipid contents according to standard protocol. Briefly, frozen liver tissue sections of 8-microns were air-dried, and then fixed in formalin. The fixed sections were rinsed in 60% isopropanol followed by staining with freshly prepared Oil-red O solution for 15 min. After Oil-red O staining, liver sections were rinsed in 60% isopropanol and washed with water before being subjected to microscope analysis. All experiments were performed on female mice.
Cell Cultures
HEK293FT were purchased from Clonetech (Mountain View, CA, USA) were cultured in DMEM (Invitrogen, Carlsbad, CA, USA) supplemented with 10% fetal bovine serum; human multiple myeloma MM.1S were purchased from American Type Culture Collection (ATCC) were cultured in RPMI (Invitrogen), supplemented with 10% fetal bovine serum, 2mM glutamine, 10mM HEPES pH7.4; non-essential amino acids, 1mM sodium pyruvate and penicillin-streptomycin antibiotics. Human lung fibroblast WI-38 and human colon carcinoma cells HCT116 were purchased from ATCC and cultured in DMEM supplemented with 10% fetal bovine serum. Nrf2 knockout MEFs were obtained from Dr. Masayuki Yamamoto (University of Tsukuba, Japan) and cultured as described previously (Zucker et al., 2014). Xbp1 knockout MEFs were cultured in DMEM (Invitrogen, Carlsbad, CA, USA) supplemented with 10% fetal bovine serum, 2mM glutamine and penicillin-streptomycin antibiotics. All cell lines were maintained at 37°C with 5% CO2. All cell lines have been verified for being mycoplasma-free using MycoAlert mycoplasma detection kit Lonza (Allendale, NJ, USA, Cat # LT07-318).
Vectors
The pCMVdeltaR8.2 and pCMV-VSV-G vectors were purchased from Addgene (Cambridge, MA, USA). The pLV-SV40-puro lentiviral vector was obtained from Dr. Peter Chumakov, Cleveland Clinic (Cleveland, OH, USA). Human KLF9 or TXNRD2-expressing lentiviral vectors were described previously [10]. XBP1s expressing plasmid was purchased from Genecopoeia (Rockville, MD). The pLKO-1 lentiviral vectors containing control shRNA and shRNAs for KLF9, ITPR1, TMEM38b, XBP1, ATF4, and ATF6 were purchased from Sigma-Aldrich. The lentiviral infection protocol has been described previously (Zucker et al., 2014). Equivalent amounts of control virus were used in all experiments.
Dual Luciferase Reporter Assay
Annealed oligonucleotides containing UPRE sequences were cloned into pGL3 promoter plasmids (Promega) via KpnI and NheI sites, and the inserts were verified by sequencing. The obtained constructs were mixed with pRLSV40 plasmid expressing the Renilla luciferase gene (Promega). WI38 cells were transfected in triplicate with the plasmid mixtures, using SuperFect reagent (QIAGEN). At 48hrs after transfection, firefly luciferase and Renilla luciferase signals were detected via Dual-Luciferase Assay Kit (Promega). Firefly luciferase signals were normalized for the corresponding Renilla luciferase signals.
METHOD DETAILS
Cell viability assay
All cells were collected by trypsinization and an aliquot of cell suspension was mixed 1:1 with Trypan Blue Stain (NutriCyte, Cat no. 02-0108-0100) and incubated at room temperature for 2 minutes. All viable (trypan blue-negative) and nonviable (trypan blue-positive) cells were counted using a hemocytometer under the microscope.
Immunoblotting
Whole cell lysates were prepared and analyzed as previously described (CITE). Membranes were developed using alkaline phosphatase-conjugated secondary antibodies and Pierce Fast Western Blot Kit (Thermo Scientific, Rockford, IL, USA), and the Alpha-Innotech FluorChem HD2 imaging system (Alpha Innotech, San Leandro, CA, USA). For the detection of endogenous KLF9 levels, Pierce SuperSignal West Femto Substrate (Thermo Scientific) was used.
Electophoretic Mobility Shift Assay (EMSA)
Nuclear extracts from tunicamycin treated wild-type or Xbp1−/− MEFs were prepared using the subcellular protein fractionation kit (Thermofisher) according to the manufacturer’s recommendations. The extracts were then incubated for 20min at RT with biotin end-labeled oligos containing a single UPRE binding motif as previously described (Yamamoto) and components of the LightShift Chemiluminescent EMSA Kit (Thermo Fisher Scientific) according to the manufacturer’s recommendations. For competition assays, unlabeled probes were used with increasing molarity. The protein/DNA complexes were resolved on 6% native polyacrylamide gels, transferred to Biodyne® B nylon membranes (cat.# 77016 Thermo Scientific), and UV cross-linked. Membranes were probed using HRP-conjugated streptavidin and exposed to X-ray film for 2–5 minutes before developing. For the list of oligonucleotides, see the Supplemental Experimental Procedures.
Quantitative Real Time PCR
Total RNA was isolated from cells using the PureLinkâ RNA Mini kit (Thermo Fisher Scientific, USA). cDNA was prepared using the cDNA reverse transcription kit (Invitrogen). Quantitative reverse transcription real-time PCR was performed on the QS6 fast real-time PCR system (Applied Biosystems, Foster City, CA, USA) using either Taqman Universal Master Mix II (Applied Biosystems) or SYBR Green PCR Master Mix (Applied Biosystems). See Table S4 for the list of oligonucleotides. PCR data were analyzed using the QuantStudio™ sequence detection software (SDS) (Applied Biosystems).
Chromatin Immunoprecipitation (ChIP)
Interactions between XBP1 and the KLF9, Bip, HERP, SLC30A5, ACC2, and DGAT2 promoters, as well as interactions between KLF9 and the ITPR1 and SLC30A5 promoters were assessed as previously described (Zucker et al., 2014). The following antibodies from Santa Cruz Biotechnology were used: Xbp1 (sc-7160), KLF9 (sc-12996), and normal mouse IgG (sc-2025). For the list of oligo-nucleotides, see Table S4.
Intracellular calcium measurement
Total intracellular calcium was measured using the Fluo-4 Direct Calcium Assay Kit (Thermo Scientific) according to manufacturer’s instructions.
Flow cytometry for reactive oxygen species detection
Approximately 3 × 10⁵ cells were collected by trypsinization, washed with phosphate buffered saline and resuspended in 300 μL of Dulbecco’s-phosphate buffered saline solution containing 5 μg/ml of CMH2DFCDA (Invitrogen, C6827) according to the manufactures instructions. Cells were incubated at 37°C for 30 min with gentle shaking every 5 min to prevent cells from clumping. Cells were pelleted at 1000rpm for 5 min, washed once with PBS, and resuspended in 0.5 mL DPBS. Fluorescence was measured via flow cytometry (Ex/Em: ~492–495/517–527 nm) using LSRIIA (Becton Dickinson). Detection was based on mean fluorescence intensity of at least 10 000 cells.
RNA-sequencing
Sequencing libraries were prepared with the TruSeq Stranded mRNA kit (Illumina Inc), from 500ng total RNA, following manufacturer’s instructions. PCR amplified libraries were pooled in an equimolar fashion, loaded into a 75 cycle NextSeq Reagent cartridge and single-end sequencing performed on a NextSeq500 following the manufacturer’s recommended protocol (Illumina Inc.). Genome alignments and feature counting were performed at RPCCC bioinformatics shared resource. Expression count normalization and differential expression were determined using a standard DESeq2 workflow103. Overlaps of DEG lists across comparisons were calculated by hypergeometric testing. All analyses were performed using R statistical software (v. 3.4.2).
QUANTIFICATION AND STATISTICAL ANALYSIS
Statistical analyses were performed by Microsoft Excel. All experiments were performed in at least two independent biological replicas. The results are expressed as the average −/+ SEM of the independent experiments. Statistical analysis was performed using Student t test. A two-tailed p value < 0.05 was considered statistically significant for all analyses.
DATA SOFTWARE AND AVAILABILITY
The accession number for the RNA sequencing data obtained in populations of WI38 cells reported in this paper is GEO: GSE119427.
Supplementary Material
Highlights.
XBP1s transcriptionally activates KLF9 under conditions of high ER stress
KLF9 transcriptionally activates TMEM38B and ITPR1 to control ER calcium release
KLF9 further increases ER stress via facilitating calcium release from ER
Klf9 deficiency reduces tunicamycin-induced ER stress in mouse liver
ACKNOWLEDGMENTS
This work has been supported by NIH grants CA220096, CA224434, CA193981, and CA190533 (to M.A.N.), Ruth L. Kirschstein National Research Service Award F32CA189622 (to A.B.-S.); the Jennifer Linscott Tietgen Foundation (to M.A.N. and E.S.K.); and in part by NCI Cancer Center Support Grant P30CA16056 (to the Roswell Park Cancer Institute, for the clinical data network and the animal facility).
Footnotes
SUPPLEMENTAL INFORMATION
Supplemental Information includes five figures and four tables and can be found with this article online at https://doi.org/10.1016/j.celrep.2018.09.013.
DECLARATION OF INTERESTS
The authors declare no competing interests.
REFERENCES
- Arnér ES (2009). Focus on mammalian thioredoxin reductases–important selenoproteins with versatile functions. Biochim. Biophys. Acta 1790, 495–526. [DOI] [PubMed] [Google Scholar]
- Cabral WA, Ishikawa M, Garten M, Makareeva EN, Sargent BM, Weis M, Barnes AM, Webb EA, Shaw NJ, Ala-Kokko L, et al. (2016). Absence of the ER cation channel TMEM38B/TRIC-B disrupts intracellular calcium homeostasis and dysregulates collagen synthesis in recessive osteogenesis imperfecta. PLoS Genet. 12, e1006156. [DOI] [PMC free article] [PubMed] [Google Scholar]
- Camandola S, Cutler RG, Gary DS, Milhavet O, and Mattson MP (2005). Suppression of calcium release from inositol 1,4,5-trisphosphate-sensitive stores mediates the anti-apoptotic function of nuclear factor-kappaB.J. Biol. Chem 280, 22287–22296. [DOI] [PubMed] [Google Scholar]
- Chitnis NS, Pytel D, Bobrovnikova-Marjon E, Pant D, Zheng H, Maas NL, Frederick B, Kushner JA, Chodosh LA, Koumenis C, et al. (2012). miR-211 is a prosurvival microRNA that regulates chop expression in a PERK-dependent manner. Mol. Cell 48, 353–364. [DOI] [PMC free article] [PubMed] [Google Scholar]
- Ghosh R, Wang L, Wang ES, Perera BG, Igbaria A, Morita S, Prado K, Thamsen M, Caswell D, Macias H, et al. (2014). Allosteric inhibition of the IRE1α RNase preserves cell viability and function during endoplasmic reticulum stress. Cell 158, 534–548. [DOI] [PMC free article] [PubMed] [Google Scholar]
- Han D, Lerner AG, Vande Walle L, Upton JP, Xu W, Hagen A, Backes BJ, Oakes SA, and Papa FR (2009). IRE1alpha kinase activation modes control alternate endoribonuclease outputs to determine divergent cell fates. Cell 138, 562–575. [DOI] [PMC free article] [PubMed] [Google Scholar]
- Han J, Back SH, Hur J, Lin YH, Gildersleeve R, Shan J, Yuan CL, Krokowski D, Wang S, Hatzoglou M, et al. (2013). ER-stress-induced transcriptional regulation increases protein synthesis leading to cell death. Nat. Cell Biol 15, 481–490. [DOI] [PMC free article] [PubMed] [Google Scholar]
- Hetz C, and Papa FR (2018). The unfolded protein response and cell fate control. Mol. Cell 69, 169–181. [DOI] [PubMed] [Google Scholar]
- Hetz C, Chevet E, and Oakes SA (2015). Proteostasis control by the unfolded protein response. Nat. Cell Biol 17, 829–838. [DOI] [PMC free article] [PubMed] [Google Scholar]
- Iurlaro R, and Muñoz-Pinedo C (2016). Cell death induced by endoplasmic reticulum stress. FEBS J. 283, 2640–2652. [DOI] [PubMed] [Google Scholar]
- Kobayashi M, and Yamamoto M (2005). Molecular mechanisms activating the Nrf2-Keap1 pathway of antioxidant gene regulation. Antioxid. Redox Signal 7, 385–394. [DOI] [PubMed] [Google Scholar]
- Kokame K, Kato H, and Miyata T (2001). Identification of ERSE-II, a new cis-acting element responsible for the ATF6-dependent mammalian unfolded protein response. J. Biol. Chem 276, 9199–9205. [DOI] [PubMed] [Google Scholar]
- Kültz D (2003). Evolution of the cellular stress proteome: from monophyletic origin to ubiquitous function. J. Exp. Biol 206, 3119–3124. [DOI] [PubMed] [Google Scholar]
- Lee AH, Iwakoshi NN, and Glimcher LH (2003). XBP-1 regulates a subset of endoplasmic reticulum resident chaperone genes in the unfolded protein response. Mol. Cell. Biol 23, 7448–7459. [DOI] [PMC free article] [PubMed] [Google Scholar]
- Lee JS, Zheng Z, Mendez R, Ha SW, Xie Y, and Zhang K (2012). Pharmacologic ER stress induces non-alcoholic steatohepatitis in an animal model. Toxicol. Lett 211, 29–38. [DOI] [PMC free article] [PubMed] [Google Scholar]
- Margariti A, Li H, Chen T, Martin D, Vizcay-Barrena G, Alam S, Karamariti E, Xiao Q, Zampetaki A, Zhang Z, et al. (2013). XBP1 mRNA splicing triggers an autophagic response in endothelial cells through BECLIN-1 transcriptional activation. J. Biol. Chem 288, 859–872. [DOI] [PMC free article] [PubMed] [Google Scholar]
- Neef DW, Jaeger AM, Gomez-Pastor R, Willmund F, Frydman J, and Thiele DJ (2014). A direct regulatory interaction between chaperonin TRiC and stress-responsive transcription factor HSF1. Cell Rep. 9, 955–966. [DOI] [PMC free article] [PubMed] [Google Scholar]
- Oh S-H, and Lim S-C (2009). Endoplasmic reticulum stress-mediated autophagy/apoptosis induced by capsaicin (8-methyl-N-vanillyl-6-nonenamide) and dihydrocapsaicin is regulated by the extent of c-Jun NH2-terminal kinase/extracellular signal-regulated kinase activation in WI38 lung epithelial fibroblast cells. J. Pharmacol. Exp. Ther 329, 112–122. [DOI] [PubMed] [Google Scholar]
- Ron D, and Walter P (2007). Signal integration in the endoplasmic reticulum unfolded protein response. Nat. Rev. Mol. Cell Biol 8, 519–529. [DOI] [PubMed] [Google Scholar]
- Soriano FX, Baxter P, Murray LM, Sporn MB, Gillingwater TH, and Hardingham GE (2009). Transcriptional regulation of the AP-1 and Nrf2 target gene sulfiredoxin. Mol. Cells 27, 279–282. [DOI] [PMC free article] [PubMed] [Google Scholar]
- Tabas I, and Ron D (2011). Integrating the mechanisms of apoptosis induced by endoplasmic reticulum stress. Nat. Cell Biol 13, 184–190. [DOI] [PMC free article] [PubMed] [Google Scholar]
- Taylor CW, Genazzani AA, and Morris SA (1999). Expression of inositol trisphosphate receptors. Cell Calcium 26, 237–251. [DOI] [PubMed] [Google Scholar]
- Tyrrell R (1999). Redox regulation and oxidant activation of heme oxygenase-1. Free Radic. Res 31, 335–340. [DOI] [PubMed] [Google Scholar]
- Ullman E, Fan Y, Stawowczyk M, Chen HM, Yue Z, and Zong WX (2008). Autophagy promotes necrosis in apoptosis-deficient cells in response to ER stress. Cell Death Differ. 15, 422–425. [DOI] [PMC free article] [PubMed] [Google Scholar]
- Wang WA, Groenendyk J, and Michalak M (2014). Endoplasmic reticulum stress associated responses in cancer. Biochim. Biophys. Acta 1843, 2143–2149. [DOI] [PubMed] [Google Scholar]
- Xu C, Bailly-Maitre B, and Reed JC (2005). Endoplasmic reticulum stress: cell life and death decisions. J. Clin. Invest 115, 2656–2664. [DOI] [PMC free article] [PubMed] [Google Scholar]
- Yamamoto K, Yoshida H, Kokame K, Kaufman RJ, and Mori K (2004). Differential contributions of ATF6 and XBP1 to the activation of endoplasmic reticulum stress-responsive cis-acting elements ERSE, UPRE and ERSE-II.J. Biochem 136, 343–350. [DOI] [PubMed] [Google Scholar]
- Yamamoto K, Suzuki N, Wada T, Okada T, Yoshida H, Kaufman RJ, and Mori K (2008). Human HRD1 promoter carries a functional unfolded protein response element to which XBP1 but not ATF6 directly binds. J. Biochem 144, 477–486. [DOI] [PMC free article] [PubMed] [Google Scholar]
- Yamamoto K, Takahara K, Oyadomari S, Okada T, Sato T, Harada A, and Mori K (2010). Induction of liver steatosis and lipid droplet formation in ATF6alpha-knockout mice burdened with pharmacological endoplasmic reticulum stress. Mol. Biol. Cell 21, 2975–2986. [DOI] [PMC free article] [PubMed] [Google Scholar]
- Zeng L, Zampetaki A, Margariti A, Pepe AE, Alam S, Martin D, Xiao Q, Wang W, Jin ZG, Cockerill G, et al. (2009). Sustained activation of XBP1 splicing leads to endothelial apoptosis and atherosclerosis development in response to disturbed flow. Proc. Natl. Acad. Sci. USA 106, 8326–8331. [DOI] [PMC free article] [PubMed] [Google Scholar]
- Zucker SN, Fink EE, Bagati A, Mannava S, Bianchi-Smiraglia A, Bogner PN, Wawrzyniak JA, Foley C, Leonova KI, Grimm MJ, et al. (2014). Nrf2 amplifies oxidative stress via induction of Klf9. Mol. Cell 53, 916–928. [DOI] [PMC free article] [PubMed] [Google Scholar]
Associated Data
This section collects any data citations, data availability statements, or supplementary materials included in this article.