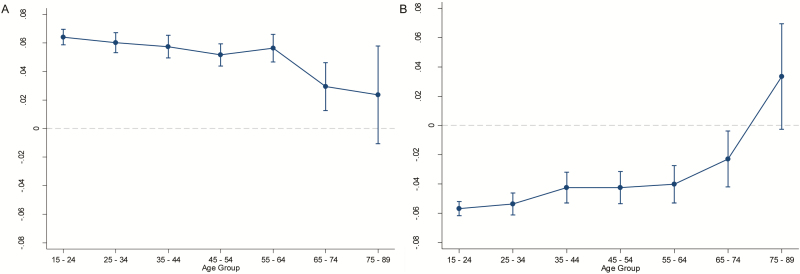
Figure 2.
Performance change per hour of increased sleep duration from <4 to 7 h (A) and for 7 h to 10+ h (B) for the working memory/processing speed task (Speed Match; N = 499273). In Panel A, more positive values indicate a greater gain in performance for each additional hour of sleep in the <4 to 7 h range. In Panel B, more negative values indicate a greater loss in performance for each additional hour of sleep in the 7–10+ h range. All age groups except the oldest demonstrated a statistically significant negative change in performance, while the oldest age group had a broad confidence interval that overlapped with a zero slope. Error bars represent 95% confidence intervals.

