

Abstract
Treacher Collins syndrome (TCS) is a craniofacial disorder that is characterized by the malformation of the facial bones. Mutations in three genes (TCOF1, POLR1C and POLR1D) involved in RNA polymerase I (Pol I) transcription account for more than 90% of disease cases. Two of these TCS-associated genes, POLR1C and POLR1D, encode for essential Pol I/III subunits that form a heterodimer necessary for Pol I/III assembly, and many TCS mutations lie along their evolutionarily conserved dimerization interface. Here we elucidate the molecular basis of TCS mutations in Saccharomyces cerevisiae, and present a new model for how TCS mutations may disrupt Pol I and III complex integrity.
Introduction
Treacher Collins syndrome (TCS) is a rare genetic disorder characterized by the underdevelopment of the facial bones and tissues (1). Current models suggest that TCS is the result of diminished ribosome biogenesis within the neural crest cells (NCC), which are transient and multi-potent migratory cells that eventually differentiate into the facial bones and tissues (1,2). Dysregulation of NCC proliferation, migration and differentiation results in a wide range of developmental diseases such as TCS. Ribosomes play a fundamental role in all cells as they translate mRNA into proteins. Developing NCCs have an extremely high demand for ribosomes because they have elevated protein synthesis requirements. In TCS cells, the ribosome supply is inadequate and they prematurely apoptose before they fully develop and proliferate, resulting in incomplete craniofacial development and deformities (1,2).
Genetic and genome-wide mapping studies first illuminated the molecular connection between TCS and dysregulated ribosome biogenesis. These studies identified three ribosome pathway genes (TCOF1, POLR1C, POLR1D) commonly mutated in the vast majority (>80%) of TCS individuals, and each of these genes play important roles in Pol I transcription (3,4). Most TCS mutations are autosomal dominant and are found in TCOF1 (∼80%) (1). TCOF1 was the first TCS-associated gene identified and encodes for a protein called Treacle that interacts with Pol I transcription factors and pre-ribosomal processing factors (4–7), and recent studies have shown that TCOF1 plays a critical role in the rDNA damage response (8,9). Mutations in POLR1C and POLR1D are autosomal recessive and autosomal dominant, respectively, and they are responsible for ∼2% of TCS cases (3,10,11). POLR1C and POLR1D encode for two essential protein subunits shared between RNA Polymerase (Pol) I and III that form a heterodimer which is likely crucial for Pol I/III assembly as suggested for the Pol II and bacterial counterparts (12–19). It remains unresolved whether TCS mutations in POLR1C and POLR1D are Pol I-specific or whether they affect both Pols I and III. Either way, mutations in these genes likely result in decreased rRNA production, reducing protein synthesis within highly proliferative cell populations like NCCs that require high levels of ribosome biogenesis for proper craniofacial development.
Saccharomyces cerevisiae (Baker‘s yeast) Pol I and III are composed of 14 and 17 subunits, respectively (20). Pol I and III share a common structural, functional and evolutionary framework that is supported by recent high resolution atomic structures of yeast Pol I and III (20–24). Both Pol I and III contain a core set of 14 subunits: 7 shared subunits and 7 paralogous subunits. The subunits AC40 and AC19 are shared between Pols I and III, and are paralogs to the Pol II subunits Rpb3 and Rpb11 (12). In humans, POLR1C and POLR1D are the orthologs of yeast AC40 and AC19, respectively. Several of the TCS mutations reside along the putative interaction interface between the POLR1C and POLR1D (3). Given their location, current models suggest that TCS mutations disrupt POLR1C/POLR1D interaction and ultimately the assembly of Pol I/III, resulting in perturbed ribosome biogenesis, tRNA synthesis and mRNA translation (1,3).
In this study, we generated and characterized a panel of POLR1D TCS mutations in the yeast model system. Here, we describe the results of these studies that challenge two paradigms for the molecular basis of TCS that include the notion that POLR1D mutations affect dimerization with POLR1C, and that TCS is a Pol I-specific disorder. Taken together, these findings illuminate an alternate model for how TCS mutations affect Pol I/III assembly and diminish their transcriptional activity.
Results
Structural basis of TCS causative mutations
X-ray crystal structures of the yeast Pol I enzyme provide a structural basis for how TCS mutations in POLR1D may affect the Pol I structure and function and contribute to TCS pathogenesis. Human POLR1D is orthologous to yeast AC19, and pairwise alignment of their protein sequences show they are highly conserved as evident by their 45% protein sequence identity (Supplementary Material, Fig. S1A) (14). Many of the POLR1D residues mutated in TCS are evolutionarily conserved between yeast and humans. In Pol I and III structures, AC19 and AC40 form an interlocked heterodimer that lies on the periphery of the complex and is required for the Pol assembly (Fig. 1A). As indicated in previous studies, the majority of the mapped POLR1D TCS mutations lie along a highly conserved surface predicted to function as the hetero-dimerization domain that allows for the POLR1C/POLR1D interaction (Fig. 1B). Based on these observations, we hypothesize that TCS-mutations disrupt the hetero-dimerization of POLR1C and POLR1D (Fig. 1C).
Figure 1.
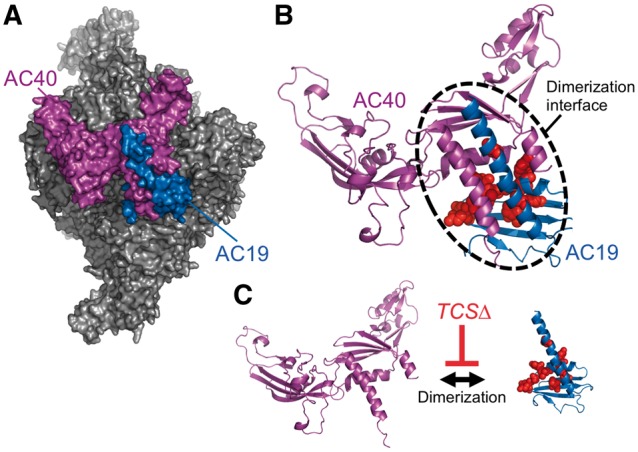
Location of POLR1D TCS mutations mapped onto the yeast Pol I structure. (A) Surface representation of yeast Pol I. The POLR1C ortholog AC40 is colored in purple, and the POLR1D ortholog AC19 is colored in blue. (B) Ribbon structure of the AC40 and AC19. The dimerization interface is outlined with a dotted line. Side chains of residues mutated in TCS patients are depicted by red colored spheres. PyMOL was used to create these images using PDB 4C2M. (C) Current model for how TCS mutations affect AC19/POLR1D function by disrupting dimerization with AC40/POLR1C.
AC19 structural elements essential for yeast cell growth
Given the conservation of many TCS mutated residues between yeast and humans, we developed a plasmid shuffle assay to determine how TCS mutations in AC19 affect yeast cell growth. We first transformed haploid wild type yeast with a plasmid construct containing the URA3-selectable marker and the AC19 gene locus, and then deleted the chromosomal copy of AC19 with the Hygromycin B marker gene by homologous recombination (25). We transformed the resulting AC19 deletion strain with either wild type or mutant AC19 expression constructs containing the LEU2-selectable marker. Finally, transformants were spread onto media containing 5-Fluoroorotic acid (5-FOA), which is used to select against the URA3 gene (26), thereby shuffling out the wild type AC19 URA3 plasmid construct and leaving the desired AC19 LEU2 variant.
We dissected the AC19 gene to determine what secondary structure elements within the protein coding sequence are necessary for cell viability (Fig. 2A, Supplementary Material, Table S1). We individually removed all the known and predicted secondary structure segments within AC19 and tested the ability of the deletion variants to grow in the presence of FOA (Fig. 2B, Supplementary Material, Fig. S2A). We found that the conserved C-terminal two-thirds of AC19 is essential for yeast growth while the less conserved N-terminal one-third is non-essential. A simple explanation for these lethal growth phenotypes is that they disrupt AC19 protein stability and/or expression. In our assay, AC19 proteins were C-terminally tagged with the HA-epitope to allow for detection by Western blot. Each of the inviable AC19 deletion mutant proteins were detected at or near wild type protein levels (Fig. 2D). These findings are consistent with a model where the conserved C-terminal region that also encompasses all the known TCS-mutation sites is critical for AC19 function and likely POLR1D function as well (Fig. 2C).
Figure 2.
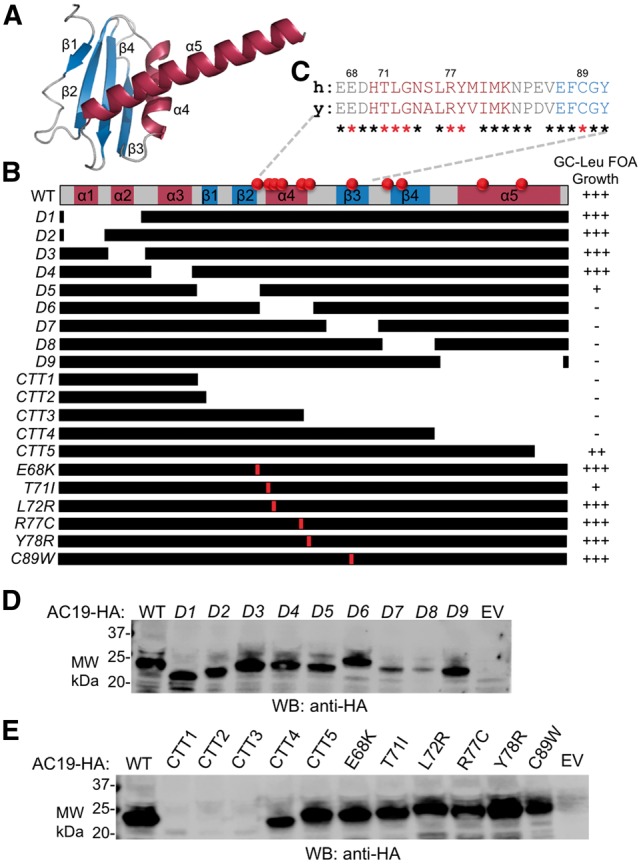
Effect of various AC19 mutations on yeast cell growth and protein expression levels. (A) Ribbon structure of AC19. Helices, Beta-sheets and coils are colored in dark red, blue and grey, respectively. (B) Growth of yeast strains with indicated mutations in AC19. At the top is an AC19 secondary structure map, followed by schematics of various deletions and point mutations used for the growth assays. Red spheres along the top of AC19 map and red lines within the individual maps indicate the approximate position of TCS mutations. Strains were grown in glucose containing media and then spread onto plates containing FOA and scored for growth. WT ( +++), Lethal (-). Black bars denote regions included in the deletion construct. (C) Pairwise protein sequence alignment of AC19 α4 thru β3 region with human POLR1D. Identical residues are indicated with an asterisk below the alignment. TCS mutated residues are denoted with a red asterisk. (D) and (E) Representative Western blot depicting protein expression levels of indicated AC19 scanning deletions (D) and TCS mutations (E) are shown.
Effect of TCS mutations on yeast cell growth
We tested the effect of AC19 mutants that contain a panel of TCS causative mutations using a plasmid shuffle growth assay. The first group of mutants we tested were five C-terminal truncations (CTT) mutants modeled after POLR1D frameshift mutations (Supplementary Material, Table S1) (3). All CTT mutants were inviable with the exception of CTT5, the smallest truncation mutant, which exhibited wild type growth, indicating this portion of the AC19 C-terminus is non-essential (Fig. 2B, Supplementary Material, Fig. S2B). These growth results are consistent with the scanning deletions described above, which indicated that the conserved C-terminal region of AC19 is essential. The largest truncations CTT1-3 were difficult to detect by Western blot either due to their small size or their protein instability, while CTT4 and 5 were expressed at levels slightly below or near wild type, respectively (Fig. 2E). Next, we tested a group of AC19 mutants containing TCS causative point mutations (Supplementary Material, Table S2) (3). Each of the TCS point mutations were expressed at or near wild type levels (Fig. 2E). Only one of the mutants, T71I, exhibited a clear slow growth phenotype on FOA containing media at 30°C (Supplementary Material, Fig. S2B). We also examined the cold sensitivity of the TCS point mutants. We found that T71I exhibited reduced growth at 18°C, indicative of a ribosome biogenesis defect, whereas the remaining mutants grew normally (Supplementary Material, Fig. S2B). It is unclear why the remaining TCS mutations lack an observable phenotype in yeast, which could be attributed to species-specificity.
Humanized AC19 is viable for yeast cell growth
Given the evolutionary conservation of yeast AC19 and human POLR1D, they likely play equivalent functional roles. To test this, we created a yeast POLR1D expression vector where we replaced the AC19 coding region with the POLR1D coding sequence. We transformed the yeast POLR1D expression construct into the AC19 plasmid shuffle strain and selected on FOA containing media. We observed no growth indicating that the full-length POLR1D gene cannot replace AC19 in yeast (Fig. 3A, B). Since the highest conservation between yeast AC19 and human POLR1D reside in the essential C-terminus two-thirds of AC19, we designed a chimeric yeast–human hybrid where we replaced the conserved C-terminal portion of AC19 with the POLR1D coding sequence that encompasses all known site of TCS mutations. When we transformed this chimeric yeast–human hybrid and tested it in our plasmid shuffle assay, the chimera rescued yeast growth to levels comparable to wild type AC19 (Fig. 3A, B), and was expressed at comparable protein levels (Fig. 3C). Likewise, a mutant yeast–human hybrid with the human T50I mutation, identical to the yeast T71I mutation, recapitulated the slow growth phenotype (Fig. 3A, B). The T50I hybrid protein was also expressed at levels comparable to the wild type AC19 and the chimeric proteins (Fig. 3C). Taken together, these results show that the POLR1D T50 residue lies within a region of AC19 that is functionally interchangeable with the corresponding region of its human ortholog, demonstrating that yeast AC19 may serve as a suitable genetic model to understand pathogenic TCS mutations in POLR1D.
Figure 3.

Chimeric yeast AC19 with human TCS region complements yeast cell growth. (A) Modular depiction of yeast, human and chimeric AC19/POLR1D constructs. For the chimeric construct yeast AC19 spanning amino acid residues 59–108 was replaced with human POLR1D spanning amino acid residues 38–88. (B) Representative growth phenotypes on glucose complete media containing FOA of indicated variants are shown. (C) Western blot of indicated chimeric variants to assess protein expression levels. EV, empty vector.
Decreased ribosomal RNA levels of the T71I mutant
The cold sensitive phenotype of the T71I mutant is indicative of impaired ribosome biogenesis and is often observed in ribosome assembly deficient yeast mutants (27). To determine if the T71I mutation impairs ribosome biogenesis, we isolated total RNAs from wild type and mutant cells and used native agarose gel electrophoresis to separate and analyze RNAs that were isolated from cells incubated at 18°C for various times. The T71I strain exhibited progressively reduced mature rRNA levels when incubated at the cold temperature (Fig. 4A). The most dramatic decrease in rRNA levels for the T71I strain was observed after 12 h at 18°C, whereas rRNA levels from the wild type strain only exhibited a modest reduction under the same treatment. The ratio of the mature 25S to 18S rRNA was also compared and there was relatively no difference between these ratios indicating a defect in rRNA synthesis upstream of rRNA processing, possibly at the level of transcription initiation (Fig. 4B).
Figure 4.

Effect of AC19 T71I mutation on ribosomal RNA levels. (A) Native agarose gel electrophoresis of isolated RNA from wild type and T71I yeast cells that were cold shocked at 18 °C for the indicated times. The mature 18S and 25S rRNA bands are labeled. (B) Relative levels of 18S and 25S rRNA band intensity normalized the first time point set at 1.0 are shown. Error bars denote standard deviation of duplicate experiments.
Dimerization of yeast and human complexes
The most obvious explanation for slow growth phenotype of the T71I mutant is that it disrupts the interaction between AC19 and AC40 thereby diminishing Pol I and III assembly. To test this model, we developed a heterodimer co-expression system for both the yeast and human AC19/AC40 and POLR1D/POLR1C complexes, respectively. For the yeast heterodimer, AC19 and AC40 were inserted into the same vector in a tandem orientation, each under control of their own T7 promoter, and a single T7 terminator flanking the last gene (Supplementary Material, Fig. S3A). The vector for the human heterodimers was arranged similarly (Supplementary Material, Fig. S3B). The yeast AC40 and human POLR1C proteins were His6 tagged at the N-terminus to allow for Ni-affinity based chromatography. Wild type yeast and human heterodimers were co-expressed in E.coli and purified by Ni-affinity chromatography. In both cases, the non-tagged subunits co-purified with their His6 tagged partner subunits. The resulting His6 purified complexes were further purified by anion exchange and hydrophobic interaction chromatography (Fig. 5A), and remained intact during the purification, indicating they form stable complexes (Fig. 5B, C). Using the same approach, we co-expressed yeast and human heterodimer combinations that contain the T71I and T50I mutations, respectively. During the Ni-affinity purification, the mutant complexes remained together and survived the subsequent multi-column purification, indicating that they also form stable heterodimer complexes (Fig. 5B, C). These findings are contrary to our initial prediction that TCS mutations would prevent hetero-dimerization of AC19/AC40, suggesting the intriguing possibility that the T71I and T50I mutations disrupt Pol I and III function by an unexpected mechanism.
Figure 5.

Co-purification and thermal stability of yeast and human heterodimer complexes. (A) Co-purification scheme for yeast and human heterodimers. (B) and (C) SDS-PAGE analysis of titrated purified yeast (B) and human (C) wild type and mutant complexes. (D) Thermal denaturation profile of yeast wild type and mutant complexes. (E) and (F) Melting temperatures of yeast and human wild type and mutant complexes in the absence (E) or presence of increasing amounts of urea denaturant (F).
An alternate mechanism that may explain loss of function of the mutant complexes is that they are less stable than their wild type counterparts, yet survive co-purification. To test this, we examined the thermal stability of the yeast and human heterodimer complexes using a fluorescence-based protein thermal shift assay. The wild type yeast heterodimer produced a melting curve with a single peak and a melting temperature (Tm) of 42.2°C, while the mutant T71I complex produced a similar melting curve with a Tm of 41.6°C, yielding a relatively small 0.6°C difference in their thermal stabilities (Fig. 5D, E, Supplementary Material, Table S3). Likewise, the human wild type and T50I mutant complexes yielded similar Tms with a relatively small 1.6°C difference (Fig. 5E, Supplementary Material, Table S3), indicating that the mutant yeast and human heterodimers are nearly as stable as their wild type counterparts, and further suggests that an alternate AC19 and POLR1D function is affected by the TCS mutations.
To further compare the stabilities of the complexes, we performed thermal shift assays in the presence of increasing amounts of urea, a protein denaturant that would challenge the stabilities of the complexes. If our mutant complexes were less stable, they would be more susceptible to urea denaturation compared to the wild type complex. When we increased the urea concentration in our thermal shift assays, we detected a decrease in the Tm, indicating that the complexes become less stable. However, we observed a nearly identical descending trend with both the wild type and mutant complexes (Fig. 5F), indicating they have similar stabilities when challenged with denaturant. Overall, the thermal stabilities of the mutant heterodimers closely resemble their wild type counterparts, suggesting that heterodimer complex stability is relatively unaffected by the TCS mutations, which likely exert their pathogenic affect by an alternate route.
Pol I and III transcription defects of the T71I mutant
One possible means of affecting Pol I and III function is that T71I mutation may directly impact the transcriptional activity of both Pol I and III. To test this, we prepared transcriptionally competent extracts from wild type and T71I mutant yeast strains and tested their ability to transcribe reporters controlled by either the Pol I dependent rDNA promoter or three different Pol III dependent promoters in an in vitro transcription assay. For the Pol III promoter we tested the SUP4 tRNA promoter, the 5S rDNA promoter and the SNR6 U6 promoter. We found that the T71I extract had significantly reduced levels of Pol I and III transcription activity (Fig. 6A, B, C;Supplementary Material, Fig. S4), indicating that the T71I mutation impairs activity of Pol I and III. These results provide evidence that a TCS mutation may also affect Pol III function, and challenges the model that TCS is a Pol I-specific disease.
Figure 6.

Effect of AC19 T71I mutation on Pol I/III transcription activity in vitro and recruitment to promoters in vivo. (A–C) Transcriptional activity of wild type and T71I mutant extracts on either the Pol I rDNA promoter (A), Pol III SUP4 promoter (B), or the Pol III 5S rDNA promoter (C). Activity assays were preformed in duplicate and representative assay results are shown. Primer extension products are denoted with an asterisk to the right of the gel image. Band intensity of Pol I and Pol III specific primer extension products are depicted below the gel image as a bar graph. Relative activities (Rel. Act.) were normalized to the highest intensity, which was set at 1.0. Error bars denote standard deviation. (D–F) Indicated yeast strains were crosslinked and analyzed by ChIP. ChIP results are represented relative to the wild type value, set at 1.0. The Pol I rDNA promoter (D), the Pol III LEU-tRNA promoter (E) and the 5S rDNA promoter (F) were analyzed by RT-qPCR. The bar graph depicts results for three different ChIPs for the indicated epitope tagged proteins. No-tag corresponds to a control yeast strain lacking epitope tags. Experiments were performed in biological triplicate, and errors bars represent standard deviation.
A reduction in Pol I/III activity was further examined by chromatin immunoprecipitation (ChIP) to determine if the lack of activity in the T71I mutant strain could be attributed to a reduction in Pol I and III recruitment to their respective promoters. We examined the recruitment of wild type and T71I mutant AC19 along with the two largest subunits of Pol I, A190 and A135, and the largest subunits of Pol III, Rpc1 and Rpc2. Recruitment of the AC19 T71I mutant to the Pol I and Pol III dependent promoters was reduced by 50% or more (Fig. 6D, E, F). We also detected a similar reduction in recruitment levels of the two largest Pol I and III subunits (Fig. 6D, E, F), suggesting the recruitment of Pol I and III is defective in the T71I mutant strain, providing rationale for the reduction of Pol I and III transcriptional activity.
Pol I/III complex integrity in vivo
Our studies to this point suggest that the yeast AC40-AC19 and human POLR1C-POLR1D mutant heterodimers still form stable complexes but are transcriptionally defective in Pol I and III activity. One caveat to the in vitro heterodimer studies is that the complexes were expressed in bacteria. To circumvent this issue, we designed parallel studies in yeast to determine if the mutant AC19 proteins retain interaction with AC40. We created a yeast strain with a C-terminally FLAG-epitope tagged AC40 and transformed this strain with yeast vectors containing either HA-tagged wild type or T71I mutant AC19. We performed reciprocal FLAG or HA immunopreciptations (IP) and found that the T71I mutant retained interaction with AC40 (Fig. 7A, B), similar to our results with the bacterially expressed complexes. These results suggest that the TCS mutations impair Pol I and III activity by an alternative mechanism.
Figure 7.

Effect of AC19 T71I mutation on Pol I/III complex integrity. (A–D) Western blot analysis of immunopurified Pol I and III. A. Immunopurification of HA-tagged wild type and T71I AC19 mutant in a FLAG-tagged AC40 yeast background strain. B. Immunopurification of FLAG-tagged AC40 in a yeast strain expressing either HA-tagged AC19 wild type or T71I mutant protein. (C) and (D) Immunopurification of either HA-tagged AC19 (C) or indicated FLAG-tagged Pol I and/or III subunit protein (D). (E) and (F) Surface representation of the AC19 and AC40 dimerization interface. AC19 is colored in blue and AC40 is colored in purple. AC40 pocket residues are colored in dark purple and residue R65 is colored in orange. The T71 and mutant T71I are colored in red and yellow, respectively. Ribbon structures of A135 and A190 are colored in green and grey respectively along with stick representation of their side chains. Structural depictions of wild type (E) and T71I mutant (F) are shown. The dotted line represents the space filled by the wild type T71 residue. Note the steric clash of the mutant T71I residue with AC40 R65. Images were created as described in Figure 1. (G) New model depicting how yeast T71I and human T50I mutations destabilize Pol I and III complex integrity and assembly downstream of heterodimer formation.
We next examined whether other Pol I and/or III subunit interactions with AC19 were affected by the T71I mutation, which would suggest that the TCS mutations affect Pol I and III complex integrity and/or assembly. Closer examination of the T71 side chain position in the Pol I crystal structure reveals that it fits into a pocket formed within the AC40 dimerization domain, so when the threonine is mutated to the bulkier isoleucine, the larger side chain likely overfills the pocket because of an additional methyl group (Fig. 7E, F). The arginine 69 (R69) side chain of AC40 forms part of the pocket wall that points toward an interface that interacts with the two largest Pol I subunits. This pocket is composed of nearly identical residues in human POLR1C including an equivalent arginine residue at position 78 (Supplementary Material, Fig. S1B). Alternating the path of the R69 side chain will likely result in the deformation of a critical assembly surface between the largest Pol I subunits and the heterodimer. This assembly surface is also conserved with Pol III, potentially suggesting that the T71I mutation may also affect Pol III complex integrity.
We first examined a group of yeast strains where various Pol I or III specific subunits were C-terminally FLAG-tagged, including two largest subunits of Pol I, A190 and A135, the Pol I stalk subunit A43 and the largest subunits of Pol III, Rpc1 and Rpc2. We transformed these strains with our HA-tagged wild type and T71I mutant AC19 expression constructs, and tested their interaction by IP. Strikingly, we discovered that the T71I mutant had significantly reduced interaction with each of the Pol I and III subunits (Fig. 7C, D), indicating that although the heterodimers can still form, they cannot assemble with the rest of Pol I/III. These findings imply that the T71I mutation causes a defect in Pol I and III assembly and/or complex integrity.
Earlier Pol II studies suggest that the AC40/AC19 Pol II paralogs Rpb3/Rpb11 form a subassembly with Rpb10, also a shared subunit of Pol I and III. To test whether the T71I mutant forms this subassembly, we C-terminally FLAG-tagged the shared Rpb10 subunit and found that the T71I mutant showed significantly reduced interaction with Rpb10 (Fig. 7C, D), indicating that Pol I and III may not form a similar subassembly in the context of the T71I mutant, and demonstrates that the mutant heterodimers are defective in Pol I and III complex integrity.
Discussion
Here our studies show that the yeast T71I and human T50I mutations retain heterodimer interaction but disrupt Pol I and III complex integrity. This likely reduces the number of functional Pol I and III complexes available, and further cascades to a reduction in the translation potential of these cells. Our results suggest that the T71I/T50I mutation disrupts a critical Pol I and III assembly step downstream of AC19-AC40 heterodimer formation (Fig. 7G). Although it was reasonable to assume the POLR1D mutations would disrupt dimerization based on the location of the mutation in the protein structure, our study emphasizes the importance of testing these predictions at the molecular genetic, biochemical and biophysical levels.
Pol biogenesis is a complex process and our understanding is still in its infancy. The most complete picture of Pol assembly originates from studies of bacterial Pol, which consists of five subunits that are homologous to the core subunits of the eukaryotic Pols. Bacterial Pol assembly begins with the formation of the α subunit homodimer (18,19), which is analogous to the yeast AC40/AC19 and human POLR1C/POLR1D heterodimers. Next, the αα homodimer interacts with the β subunit, which is analogous to the second largest eukaryotic Pol I subunit, to form ααβ intermediate that then combines with the β’ and ω to complete the assembly (18,19). The β’ and ω are homologous to the largest eukaryotic Pol subunit and the shared Pol I-III subunit Rpb6, respectively. Much less is known about eukaryotic Pol assembly, but it is hypothesized that they follow a similar assembly pathway (12).
Elegant developmental studies in zebrafish recently showed that deletion of both alleles of either POLR1C or POLR1D result in craniofacial defects (28). The resulting embryos die ∼10 days post fertilization, and exhibit reduced Pol I transcribed rRNA (28). Interestingly, in these same embryos, 5S rRNA levels are not affected, suggesting that deletion of POLR1C/D results in a Pol I-specific defect (28). This is in contrary to our results demonstrating that Pol III transcription, which includes 5S rDNA transcription is impaired in the T71I mutant yeast strain. We speculate that this may be due to the two different types of 5S rRNA expressed in the zebrafish life cycle, where they express a maternal and somatic 5S rRNA from different chromosomal loci (29). During the early stages of development, the maternal 5S rRNA is progressively replaced by the somatic type, which is exclusively found in adult zebrafish (29). Although speculative, an attractive model explaining these differences is that the maternal 5S RNA expression is dependent on a different eukaryotic Pol such as Pol II. However, this could simply be due to species-specific differences between yeast and zebrafish transcription machineries.
Our results suggest that the T71I mutation disrupts a Pol I and III assembly step immediately after heterodimer assembly as the interaction with the second largest Pol I and III subunits are disrupted. We also noticed reduced interaction with Rpb10, which current assembly models suggest would form a subcomplex with the heterodimers (12). This may indicate that an AC40/AC19/Rpb10 subassembly may not form. It is also possible that the T71I mutation disrupts interaction with one or more biogenesis assembly factors, ultimately impeding efficient and stable complex formation. In parallel with our studies, a G1007A mutation in the second largest Pol III subunit Rpc2 similarly reduced Pol III assembly (30). Intriguingly, this Rpc2 mutation is at the surface of the heterodimer interaction interface and is adjacent to the T71 residue, further stressing the connection between maintaining the heterodimer interaction surface and efficient Pol assembly. Finally, it is interesting that the Pol II AC19 paralog, Rpb11, contains a conserved threonine residue that aligns with the AC19 T71 residue. Likewise, the Pol II AC40 paralog, Rpb3, contains an arginine that aligns with the AC40 R69 residue. We speculate that a threonine to isoleucine mutation in Rpb11 would have a similar affect on Pol II complex integrity, yet there are no reports of genetic disorders associated with Rpb11 nor Rpb3 mutations, so it is possible that this mutation would be lethal.
It is presumed that mutations in shared Pol I and III subunits can result in Pol-specific diseases. A clear example of this is leukodystrophy, a rare neurodegenerative disorder caused by a defect in genes involved in the maintenance or growth of the myelin sheath that is characterized as a Pol III specific disease (31–33). A vast number of genetic mutations cause leukodystrophy including a new category of the disease called 4H (hypomyelination, hypogonadotropic hypogonadism and hypodontia) syndrome that is caused by autosomal recessive mutations in the genes that encode for the two largest Pol III subunits, POLR3A and POLR3B (31–36). Analogous to the TCS disease model, the current model for leukodystrophy is that mutations in POLR3A and POLR3B reduce tRNA synthesis, resulting in decreased protein yield, and subsequently affecting the production of the myelin sheath for the central nervous system (36).
However, not all 4H syndrome patients have mutations in POLR3A and POLR3B. Recent studies discovered 4H syndrome mutations in POLR1C, the gene that encodes for the shared Pol I and III subunit that is also mutated in TCS (36). Biochemical analysis of two homozygous recessive POLR1C 4H syndrome mutations (N32I and N74S) revealed that the assembly and nuclear import of Pol III was significantly reduced, whereas Pol I was relatively unaffected (36). The same study tested one POLR1C TCS mutation (R279Q), which retained Pol I complex assembly, but its import to the nucleolus was impaired (36). Together, these findings demonstrate that mutations in shared Pol I and III subunits can result in Pol specific diseases.
Pol specificity of leukodystrophy and TCS is not always clearly delineated. Our results also provide evidence that TCS is not necessarily a Pol I-specific disease, but may also affect Pol III, which would likely further contribute to defects in ribosome biogenesis and translation. Further examples of this include a recent study showing that a mutation in POLR1A, the largest subunit of Pol I, was found in two patients who exhibited symptoms characteristic of leukodystrophy (37), which challenges the idea that leukodystrophy is exclusive to Pol III. It is also possible that Pol I or III mutations can cause more than one disease. For example, mutations in POLR1A are also associated with a disease called acrofacial dysostosis Cincinnati type, which exhibits TCS clinical features in addition to unique limb anomalies that include short, broad fingers and toes, common to another genetic disease known as Nager syndrome (1,38–41). These limb anomalies are not normally found in TCS patients, so this may represent an instance where two different disorders occur in a single individual.
Another example of the broad disease specificity phenomena is Wiedeman-Rautenstrauch syndrome, also known as neonatal progeroid syndrome, which is a rare genetic autosomal recessive disorder characterized by an aged appearance at birth (42). This syndrome is associated with mutations in POLR3A and expresses a broad spectrum of clinical features including a large skull and triangular face as well as underdeveloped facial bones which is a classical clinical feature of TCS (42). Furthermore, hypomyelination that is associated with 4H syndrome was also noted in patients containing these POLR3A mutations (42), indicating the potential convergence of three separate genetic disorders. Like POLR1A mutations, POLR3A mutations can result in a broad spectrum of clinical features that bridge multiple anomalies. More generally, these findings demonstrate that Pol I and III mutations may not always develop into a single clearly defined disease. Elucidating the underlying molecular basis of Pol I and III mutations is critical as multiple pathways are likely involved and preventive treatments will rely on our molecular understanding of their disease mechanisms at the most basic level.
Finally, our studies demonstrate that yeast has the potential to mimic Pol I and III defects of TCS mutations, and to reveal important mechanistic detail about the molecular basis of the disease. This adds to the arsenal of model systems that can be used to study TCS that includes mice and zebrafish. In future studies, we will focus on using yeast screens to find suppressors of the T71I mutation that may illuminate novel rescue pathways that could be later applied to more complex model systems.
Materials and Methods
Yeast strains and cell growth assays
Yeast strains used in this study were made in the BY4705 genetic background (MATα ade2-1 ade2Δ:: hisG his3Δ200 leu2Δ0 lys2Δ0 met15Δ0 trp1Δ63-112 ura3Δ0) (43). The AC19 plasmid shuffle strain contained a chromosomal deletion of AC19 using the pAG32 hygromycin B deletion cassette (25). Indicated Pol I and/or Pol III subunits were C-terminally FLAG-tagged or V5-tagged in the AC19 shuffle strain. These yeast strains were transformed with either wild type or mutant AC19 gene derivatives. Cells were grown on glucose complete (GC) medium lacking leucine (L) and then spread onto GC-L media containing FOA, incubated at indicated temperatures for 2–4 days, and then assessed for growth relative to wild type ( +++). Growth assays were preformed in biological triplicate.
Total RNA extraction and analysis
Total RNA was extracted from 20 ml yeast cells and ethanol precipitated as previously described (44). RNA pellets were resuspended in RNase-free water and 15 ug of RNA was treated with the Turbo DNase kit (Ambion). DNase treated RNAs were separated on a 2% agarose gel containing 1% bleach to protect RNAs (45). Approximately 2 ug of RNA was analyzed on the gel, and the RNA was visualized by staining with GelRed dye (Biotium) and with the Odyssey FC (LiCor) imager. These assays were preformed in biological duplicate.
Heterodimer protein expression and purification
Yeast and human versions of WT and mutant AC40/AC19 and POLR1C/POLR1D recombinant protein complexes were expressed in BL21 (DE3) Rosetta2 cells (Stratagene) by autoinduction in ZY5052 medium (25 mM Na2HPO4, 25 mM KH2PO4, 50 mM NH4Cl, 5 mM NaSO4, 2 mM MgSO4, 0.5% glycerol, 0.05% glucose, 0.2% α-lactose, 0.01% tryptone and 0.005% yeast extract) for 16 h at 37 °C. Cells were harvested by centrifugation, and cell pellets were washed once with wash buffer (50 mM HEPES, pH 7.5, 200 mM NaCl and 0.1 mM EDTA). Cell pellets were resuspended in 5 ml lysis buffer (50 mM HEPES, pH 7.5, 200 mM NaCl, 20 mM imidazole, 0.1 mM EDTA, 10% glycerol, 0.1% Tween-20 and 1 mM DTT, supplemented with protease inhibitors) per 1 g of cells, and lysed by sonication. Lysates were cleared by centrifugation, and cleared lysates were added to Ni-Sepharose affinity medium (GE Healthcare) and incubated for 4H at 4 °C. Complex-bound beads were washed with 10 column-volumes wash buffer (50 mM HEPES, pH 7.5, 1 M NaCl, 40 mM imidazole, 0.1 mM EDTA, 10% glycerol, 0.1% Tween-20) and eluted with elution buffer (50 mM HEPES, pH 7.5, 200 mM NaCl, 250 mM imidazole, 0.1 mM EDTA, 10% glycerol, 0.1% Tween-20 and 1 mM DTT). Peak elutions were pooled, desalted with a 40-kDa-cutoff Zeba Spin desalting column (ThermoScientific) and further purified over a His HiTrap HP column (GE Healthcare). Fractions were analyzed by SDS-PAGE, and those containing purest AC40/AC19 complexes were desalted and further purified with a HiTrap Q HP column (GE Healthcare) linear gradient of buffer A (50 mM HEPES, pH 7.5, 200 mM NaCl, 0.1 mM EDTA, 5% glycerol, 0.05%Tween20) to buffer B (50 mM HEPES, pH 7.5, 800 mM NaCl, 0.1 mM EDTA, 5% glycerol, 0.05% Tween-20) over 10 column volumes. Complexes eluted at approximately 800 mM NaCl and were subsequently diluted into buffer A (100 mM sodium phosphate, 1.5 M ammonium sulfate, pH 7.5) for polishing with HiTrap Butyl over a linear gradient to buffer B (100 mM sodium phosphate, pH 7.5). Complexes eluted at approximately 200 mM ammonium sulfate. Pure complexes were desalted into buffer C (50 mM HEPES, 150 mM NaCl, pH 7.5) and concentrated on a 10-kDa-cutoff Centricon filter (Millipore).
Protein thermal shift assays
Thermal shift assays for wild type and mutant yeast and human complexes were carried out using the Protein Thermal Shift™ Starter Kit (Life Technologies) and an Eppendorf Realplex Mastercycler EP GradientS RTPCR instrument. Complexes were diluted in buffer C to final reaction concentrations ranging from 5 to 30 μg/ml. Reactions which compared Tm over increasing urea concentrations had a constant protein amount of 15 μg/ml. Protein melt reactions were assembled on ice according to kit instructions in 20 μl reactions, and were added to 96-Well twin.tec qPCR plates (Eppendorf) in triplicate, sealed with Masterclear real-time PCR film (Eppendorf) and almost immediately fluorescence emission was measured. The samples were heated from 25 °C to 95 °C over 25 minutes. The data were analyzed using the dFluorescence derivative method. The Tm values were taken as the minima in the derivative plot (derivative melt profiles). The mean of three experiments were considered for data analysis.
Preparation of transcription-competent extracts
Transcription–competent extracts were prepared as previously described (46). Two liters of wild type or T71I mutant strains were grown to an OD of 1.0 in YP medium containing 2% glucose as a carbon source. Extracts contained approximately 15 mg/ml protein.
In vitro transcription assays
Transcription assays were performed as previously described (46). Briefly, assays were assembled in 50 μl reactions containing 0, 45, 90, 180 μg extract, 1 μl RNase Out (Invitrogen), 100 μM each NTP, 200 ng plasmid template DNA, 12.5 μL 4× transcription buffer (80 mM HEPES-KOH, pH 7.9, 200 mM KCl, 40 mM MgCl2, 20 mM EGTA, 0.2 mM EDTA, 10 mM DTT and 40% glycerol). Pol I and III transcription reactions contained 10 mg/ml or 1 mg/ml α-amanitin, respectively. Transcription reactions were incubated at room temperature for 30 min and stopped by addition of 180 μl stop solution (100 mM NaOAc, 10 mM EDTA and 0.5% SDS) supplemented with 10 μg/ml Glycogen (Ambion). RNA was extracted with phenol/chloroform (2:1) once, ethanol (EtOH) precipitated and dried. RNA were reverse transcribed using a Superscript IV cDNA synthesis kit (Invitrogen) and a LacI primer fluorescently labeled with Cyanine 5.5. cDNAs were EtOH precipitated, and pellets were washed with 80% EtOH, dried, resuspended in RNase A (40 μg/ml), incubated for 3 min at room temperature, and then followed by the addition of 3 μl formamide loading dye containing bromophenol blue (95% formamide, 5 mM EDTA, 0.025% w/v bromophenol blue). Samples were heated for 1 min at 90 °C, cooled on ice, and run on a denaturing 6% urea acrylamide gel. Gels were visualized by an Odyssey scanner (LiCor) using the 700-wavelength channel. These assays were preformed in biological duplicate and representative results are shown.
Chromatin immunoprecipitation
Chromatin immunopreciptiation assays were conducted as previously described (46–48). Briefly, yeast strains expressing various epitope tagged Pol I/III subunit variants were grown in GC medium lacking leucine. Cells were crosslinked with 1% formaldehyde (Sigma) for 5 min at room temperature. After crosslinking, cells were harvested and washed twice with cold TBS buffer (50 mM Tris-Cl, pH 7.5, 150 mM NaCl). Cells were resuspended in ChIP buffer (150 mM NaCl, 50 mM Tris-HCl, pH 7.5, 5 mM EDTA, 0.5% NP-40 and 1.0% Triton X-100) supplemented with 0.5 mM DTT, 0.5 mM PMSF and protease inhibitors. Cells were lysed with 0.5-mm zirconia beads (Biospec) with a Bead Ruptor 12 (Omni) at 2 × 45 s intervals until greater than 95% cell breakage was achieved. Lysates were sonicated 4 × 10 min on high setting with the Bioruptor UCD-200 (Diagencode). Sonicated lysates were cleared by centrifugation, and protein concentrations were determined by Bradford assay. Next, 500 μg of sheared chromatin was incubated overnight at 4°C with either 10 μl anti-HA (Biotool), anti-V5 (Biotool), or anti-FLAG (Biotool) affinity agarose beads. Beads were washed three times in ChIP buffer containing 1 M NaCl, once with standard ChIP buffer, and once with water. Next, 100 μl of ChIP elution buffer (25 mM Tris-Cl, pH 9.8, 1 mM EDTA) was added to beads and boiled for 10 min. The suspension was centrifuged, and supernatant containing the eluted DNA was collected. The beads were washed with 60 μl water and centrifuged, and the supernatants were combined. Eluted DNA was used directly in quantitative PCR using the SsoAdvanced Universal SYBR Green Supermix (Bio-Rad). To determine the immunoprecipitated ChIP signal, values were calculated as the ratio of the percentage precipitated at a specific locus to the percentage precipitated at the DNA POL1 reference locus. All values are expressed relative to wild type, which was set at 1.0. Experiments were performed in biological duplicate. Primer sets used for qPCR are listed as follows: Pro-rDNA-F, 5′-TCGGCGAGAAATACGTAGTTAAG-3′; Pro-rDNA-R, 5′-CCTCACACTTGTACTCCATGAC-3′; DNA-POL1-F, 5′-TTTCTGCTGAGGTGTCTTATAGAATTCA-3′; DNA-POL1-R, 5′-CGTTTGGGCCCATGCAT-3′. Pro-LEUtRNA-F, 5′-AGACGAGCAGCTTATCCCATAATGA-3′; Pro-LEUtRNA-R, 5′- GTGACGCCTGGTCGGTAAAAAGAT-3′. Pro-5S-rDNA-F, 5′-CCACCTACTGAACATGTCTGG-3′; Pro-5S-rDNA-R, 5′-ACGGTGCTTTCTGGTAGATATG-3′. These assays were preformed in biological triplicate.
Pol I/III immunoprecipitations
IP assays were conducted as previously described (44,46). Briefly, epitope tagged (HA or FLAG) proteins were purified from 200 ml mid-log-phase cultures grown in minimal glucose-containing medium. For HA-tagged AC19 IPs, either wild type HA-tagged AC19 or mutant T71I plasmid constructs were transformed into AC19 plasmid shuffle yeast strain containing chromosomally FLAG-tagged indicated Pol I or Pol III subunit genes. Cells were collected by centrifugation and lysed by zirconia bead-beating in lysis buffer (100 mM Tris-HCl, pH 7.9, 250 mM AmSO4, 1 mM EDTA and 10% glycerol) supplemented with 0.5 mM DTT, 0.5 mM PMSF and protease inhibitors, and lysates were cleared by centrifugation. Approximately 3–4 mg of the whole cell extract diluted with two volumes of dilution buffer (25 mM HEPES, pH 7.5, 50 mM NaCl and 1 mM EDTA) was incubated overnight at 4°C with either 20 μl of anti-HA affinity agarose (Biotool) or 20 μl of anti-FLAG affinity agarose (Biotool) for HA and FLAG immunoprecipitations, respectively. Beads were washed three times in 1 ml TBS buffer containing 0.1% Tween and two times with TBS buffer, and then the proteins were eluted with 1× NuPAGE LDS sample buffer (Invitrogen) at 70 °C for 10 min. Samples were resolved on 4–20% polyacrylamide gradient gels (Bio-Rad) in Tris-Glycine-SDS running buffer for 35 min at 200 V. Proteins were transferred to PVDF and probed with mouse monoclonal antibodies against FLAG (Sigma, F1805), and HA (SCBT, F-7). These assays were preformed in biological duplicate and representative results are shown.
Supplementary Material
Supplementary Material is available at HMG online.
Supplementary Material
Acknowledgements
We thank Knutson lab members for insightful discussions on the manuscript and Marissa L. Smith for critical reading of the manuscript. We are grateful to Dr. Paul Trainor (Stowers Institute) for helpful discussions prior to submission.
Conflict of Interest statement. None declared.
Funding
This work was supported by B.A.K. grants funded by the US National Institute of Health (NCI 5K22CA184235), the Central New York Community Foundation, Joseph C. George Fund, and Virginia Simons & Dr. C. Adele Brown Fund, and State University of New York (SUNY) Research Foundation. B.A.K. is a Sinsheimer Scholar award recipient from the Alexandrine and Alexander L. Sinsheimer fund. G.N.P was supported by the SUNY Upstate Summer Undergraduate Research (SURF) program for a portion of this work.
References
- 1. Terrazas K., Dixon J., Trainor P.A., Dixon M.J. (2017) Rare syndromes of the head and face: mandibulofacial and acrofacial dysostoses. Wiley Interdisc. Rev. Develop. Biol., 6, e263.. [DOI] [PMC free article] [PubMed] [Google Scholar]
- 2. Ross A.P., Zarbalis K.S. (2014) The emerging roles of ribosome biogenesis in craniofacial development. Front. Physiol., 5, 26. [DOI] [PMC free article] [PubMed] [Google Scholar]
- 3. Dauwerse J.G., Dixon J., Seland S., Ruivenkamp C.A., van Haeringen A., Hoefsloot L.H., Peters D.J., Boers A.C., Daumer-Haas C., Maiwald R. (2011) Mutations in genes encoding subunits of RNA polymerases I and III cause Treacher Collins syndrome. Nat. Genet., 43, 20–22. [DOI] [PubMed] [Google Scholar]
- 4.(1996) Positional cloning of a gene involved in the pathogenesis of Treacher Collins syndrome. The Treacher Collins Syndrome Collaborative Group. Nat. Genet., 12, 130–136. [DOI] [PubMed] [Google Scholar]
- 5. Gonzales B., Henning D., So R.B., Dixon J., Dixon M.J., Valdez B.C. (2005) The Treacher Collins syndrome (TCOF1) gene product is involved in pre-rRNA methylation. Hum. Mol. Genet., 14, 2035–2043. [DOI] [PubMed] [Google Scholar]
- 6. Lin C.I., Yeh N.H. (2009) Treacle recruits RNA polymerase I complex to the nucleolus that is independent of UBF. Biochem. Biophys. Res. Commun., 386, 396–401. [DOI] [PubMed] [Google Scholar]
- 7. Hayano T., Yanagida M., Yamauchi Y., Shinkawa T., Isobe T., Takahashi N. (2003) Proteomic analysis of human Nop56p-associated pre-ribosomal ribonucleoprotein complexes. Possible link between Nop56p and the nucleolar protein treacle responsible for Treacher Collins syndrome. J. Biol. Chem., 278, 34309–34319. [DOI] [PubMed] [Google Scholar]
- 8. Larsen D.H., Hari F., Clapperton J.A., Gwerder M., Gutsche K., Altmeyer M., Jungmichel S., Toledo L.I., Fink D., Rask M.B.. et al. (2014) The NBS1-Treacle complex controls ribosomal RNA transcription in response to DNA damage. Nat. Cell Biol., 16, 792–803. [DOI] [PMC free article] [PubMed] [Google Scholar]
- 9. Ciccia A., Huang J.W., Izhar L., Sowa M.E., Harper J.W., Elledge S.J. (2014) Treacher Collins syndrome TCOF1 protein cooperates with NBS1 in the DNA damage response. Proc. Natl. Acad. Sci. USA, 111, 18631–18636. [DOI] [PMC free article] [PubMed] [Google Scholar]
- 10. Schaefer E., Collet C., Genevieve D., Vincent M., Lohmann D.R., Sanchez E., Bolender C., Eliot M.M., Nurnberg G., Passos-Bueno M.R.. et al. (2014) Autosomal recessive POLR1D mutation with decrease of TCOF1 mRNA is responsible for Treacher Collins syndrome. Genet. Med., 16, 720–724. [DOI] [PubMed] [Google Scholar]
- 11. Giampietro P.F., Armstrong L., Stoddard A., Blank R.D., Livingston J., Raggio C.L., Rasmussen K., Pickart M., Lorier R., Turner A.. et al. (2015) Whole exome sequencing identifies a POLRID mutation segregating in a father and two daughters with findings of Klippel-Feil and Treacher Collins syndromes. Am. J. Med. Genet. A, 167, 95–102. [DOI] [PubMed] [Google Scholar]
- 12. Wild T., Cramer P. (2012) Biogenesis of multisubunit RNA polymerases. Trends Biochem. Sci., 37, 99–105. [DOI] [PubMed] [Google Scholar]
- 13. Ulmasov T., Larkin R.M., Guilfoyle T.J. (1996) Association between 36- and 13.6-kDa alpha-like subunits of Arabidopsis thaliana RNA polymerase II. J. Biol. Chem., 271, 5085–5094. [DOI] [PubMed] [Google Scholar]
- 14. Yao Y., Yamamoto K., Nishi Y., Nogi Y., Muramatsu M. (1996) Mouse RNA polymerase I 16-kDa subunit able to associate with 40-kDa subunit is a homolog of yeast AC19 subunit of RNA polymerases I and III. J. Biol. Chem., 271, 32881–32885. [DOI] [PubMed] [Google Scholar]
- 15. Shpakovski G.V., Shematorova E.K. (1999) Rpc19 and Rpc40, two alpha-like subunits shared by nuclear RNA polymerases I and III, are interchangeable between the fission and budding yeasts. Curr. Genet., 36, 208–214. [DOI] [PubMed] [Google Scholar]
- 16. Dequard-Chablat M., Riva M., Carles C., Sentenac A. (1991) RPC19, the gene for a subunit common to yeast RNA polymerases A (I) and C (III). J. Biol. Chem., 266, 15300–15307. [PubMed] [Google Scholar]
- 17. Mann C., Buhler J.M., Treich I., Sentenac A. (1987) RPC40, a unique gene for a subunit shared between yeast RNA polymerases A and C. Cell, 48, 627–637. [DOI] [PubMed] [Google Scholar]
- 18. Kimura M., Ishihama A. (1996) Subunit assembly in vivo of Escherichia coli RNA polymerase: role of the amino-terminal assembly domain of alpha subunit. Genes Cells, 1, 517–528. [DOI] [PubMed] [Google Scholar]
- 19. Ishihama A. (1981) Subunit of assembly of Escherichia coli RNA polymerase. Adv. Biophys., 14, 1–35. [PubMed] [Google Scholar]
- 20. Vannini A. (2013) A structural perspective on RNA polymerase I and RNA polymerase III transcription machineries. Biochim. Biophys. Acta, 1829, 258–264. [DOI] [PubMed] [Google Scholar]
- 21. Vannini A., Cramer P. (2012) Conservation between the RNA polymerase I, II, and III transcription initiation machineries. Mol. Cell, 45, 439–446. [DOI] [PubMed] [Google Scholar]
- 22. Fernandez-Tornero C., Moreno-Morcillo M., Rashid U.J., Taylor N.M., Ruiz F.M., Gruene T., Legrand P., Steuerwald U., Muller C.W. (2013) Crystal structure of the 14-subunit RNA polymerase I. Nature, 502, 644–649. [DOI] [PubMed] [Google Scholar]
- 23. Hoffmann N.A., Jakobi A.J., Moreno-Morcillo M., Glatt S., Kosinski J., Hagen W.J., Sachse C., Muller C.W. (2015) Molecular structures of unbound and transcribing RNA polymerase III. Nature, 528, 231–236. [DOI] [PMC free article] [PubMed] [Google Scholar]
- 24. Engel C., Sainsbury S., Cheung A.C., Kostrewa D., Cramer P. (2013) RNA polymerase I structure and transcription regulation. Nature, 502, 650–655. [DOI] [PubMed] [Google Scholar]
- 25. Goldstein A.L., McCusker J.H. (1999) Three new dominant drug resistance cassettes for gene disruption in Saccharomyces cerevisiae. Yeast (Chichester, England), 15, 1541–1553. [DOI] [PubMed] [Google Scholar]
- 26. Boeke J.D., Trueheart J., Natsoulis G., Fink G.R. (1987) 5-Fluoroorotic acid as a selective agent in yeast molecular genetics. Methods Enzymol., 154, 164–175. [DOI] [PubMed] [Google Scholar]
- 27. Aguilera J., Randez-Gil F., Prieto J.A. (2007) Cold response in Saccharomyces cerevisiae: new functions for old mechanisms. FEMS Microbiology Reviews, 31, 327–341. [DOI] [PubMed] [Google Scholar]
- 28. Noack Watt K.E., Achilleos A., Neben C.L., Merrill A.E., Trainor P.A., Lipton J.M. (2016) The roles of RNA polymerase I and III subunits Polr1c and Polr1d in craniofacial development and in zebrafish models of treacher collins syndrome. PLoS Genet., 12, e1006187. [DOI] [PMC free article] [PubMed] [Google Scholar]
- 29. Locati M.D., Pagano J.F.B., Ensink W.A., van Olst M., van Leeuwen S., Nehrdich U., Zhu K., Spaink H.P., Girard G., Rauwerda H.. et al. (2017) Linking maternal and somatic 5S rRNA types with different sequence-specific non-LTR retrotransposons. RNA (New York, N.Y.), 23, 446–456. [DOI] [PMC free article] [PubMed] [Google Scholar]
- 30. Cieśla M., Makała E., Płonka M., Bazan R., Gewartowski K., Dziembowski A., Boguta M. (2015) Rbs1, a new protein implicated in RNA polymerase III biogenesis in yeast Saccharomyces cerevisiae. Mol. Cell. Biol., 35, 1169–1181. [DOI] [PMC free article] [PubMed] [Google Scholar]
- 31. Ashrafi M.R., Tavasoli A.R. (2017) Childhood leukodystrophies: a literature review of updates on new definitions, classification, diagnostic approach and management. Brain Dev., 39, 369–385. [DOI] [PubMed] [Google Scholar]
- 32. Daoud H., Tétreault M., Gibson W., Guerrero K., Cohen A., Gburek-Augustat J., Synofzik M., Brais B., Stevens C.A., Sanchez-Carpintero R.. et al. (2013) Mutations in POLR3A and POLR3B are a major cause of hypomyelinating leukodystrophies with or without dental abnormalities and/or hypogonadotropic hypogonadism. J. Med. Genet., 50, 194–197. [DOI] [PubMed] [Google Scholar]
- 33. Bernard G., Vanderver A. (1993) In: Pagon, R.A., Adam, M.P., Ardinger, H.H., Wallace, S.E., Amemiya, A., Bean, L.J.H., Bird, T.D., Ledbetter, N., Mefford, H.C., Smith, R.J.H. and Stephens, K. (eds.), GeneReviews(R). University of Washington, Seattle. [GeneReviews is a registered trademark of the University of Washington, Seattle. All rights reserved., Seattle (WA), in press].
- 34. Vrij-van den Bos S., Hol J.A., La Piana R., Harting I., Vanderver A., Barkhof F., Cayami F., van Wieringen W.N., Pouwels P.J.W., van der Knaap M.S.. et al. (2017) 4H Leukodystrophy: a brain magnetic resonance imaging scoring system. Neuropediatrics, 48, 152–160. [DOI] [PubMed] [Google Scholar]
- 35. Orcesi S., Tonduti D., Uggetti C., Larizza D., Fazzi E., Balottin U. (2010) New case of 4H syndrome and a review of the literature. Pediatric Neurol., 42, 359–364. [DOI] [PubMed] [Google Scholar]
- 36. Thiffault I., Wolf N.I., Forget D., Guerrero K., Tran L.T., Choquet K., Lavallée-Adam M., Poitras C., Brais B., Yoon G.. et al. (2015) Recessive mutations in POLR1C cause a leukodystrophy by impairing biogenesis of RNA polymerase III. Nat. Commun., 6, 7623.. [DOI] [PMC free article] [PubMed] [Google Scholar]
- 37. Kara B., Köroğlu Ç., Peltonen K., Steinberg R.C., Maraş Genç H., Hölttä-Vuori M., Güven A., Kanerva K., Kotil T., Solakoğlu S.. et al. (2017) Severe neurodegenerative disease in brothers with homozygous mutation in POLR1A. Eur. J. Hum. Genet. EJHG, 25, 315–323. [DOI] [PMC free article] [PubMed] [Google Scholar]
- 38. Weaver K.N., Watt K.E., Hufnagel R.B., Navajas Acedo J., Linscott L.L., Sund K.L., Bender P.L., Konig R., Lourenco C.M., Hehr U.. et al. (2015) Acrofacial dysostosis, cincinnati type, a mandibulofacial dysostosis syndrome with limb anomalies, is caused by POLR1A dysfunction. Am. J. Hum. Genet., 96, 765–774. [DOI] [PMC free article] [PubMed] [Google Scholar]
- 39. Czeschik J.C., Voigt C., Alanay Y., Albrecht B., Avci S., Fitzpatrick D., Goudie D.R., Hehr U., Hoogeboom A.J., Kayserili H.. et al. (2013) Clinical and mutation data in 12 patients with the clinical diagnosis of Nager syndrome. Hum. Genet., 132, 885–898. [DOI] [PubMed] [Google Scholar]
- 40. Trainor P.A., Andrews B.T. (2013) Facial dysostoses: etiology, pathogenesis and management. Am. J. Med. Genet. C. Semin. Med. Genet., 163, 283–294. [DOI] [PMC free article] [PubMed] [Google Scholar]
- 41. Lehalle D., Wieczorek D., Zechi-Ceide R.M., Passos-Bueno M.R., Lyonnet S., Amiel J., Gordon C.T. (2015) A review of craniofacial disorders caused by spliceosomal defects. Clin. Genet., 88, 405–415. [DOI] [PubMed] [Google Scholar]
- 42. Jay A.M., Conway R.L., Thiffault I., Saunders C., Farrow E., Adams J., Toriello H.V. (2016) Neonatal progeriod syndrome associated with biallelic truncating variants in POLR3A. Am. J. Med. Genet. A, 170, 3343–3346. [DOI] [PubMed] [Google Scholar]
- 43. Brachmann C.B., Davies A., Cost G.J., Caputo E., Li J., Hieter P., Boeke J.D. (1998) Designer deletion strains derived from Saccharomyces cerevisiae S288C: a useful set of strains and plasmids for PCR-mediated gene disruption and other applications. Yeast (Chichester, England), 14, 115–132. [DOI] [PubMed] [Google Scholar]
- 44. Knutson B.A., Hahn S. (2011) Domains of Tra1 important for activator recruitment and transcription coactivator functions of SAGA and NuA4 complexes. Mol. Cell. Biol., 31, 818–831. [DOI] [PMC free article] [PubMed] [Google Scholar]
- 45. Aranda P.S., LaJoie D.M., Jorcyk C.L. (2012) Bleach gel: a simple agarose gel for analyzing RNA quality. Electrophoresis, 33, 366–369. [DOI] [PMC free article] [PubMed] [Google Scholar]
- 46. Knutson B.A., Luo J., Ranish J., Hahn S. (2014) Architecture of the Saccharomyces cerevisiae RNA polymerase I Core Factor complex. Nat. Struct. Mol. Biol., 21, 810–816. [DOI] [PMC free article] [PubMed] [Google Scholar]
- 47. Nelson J.D., Denisenko O., Sova P., Bomsztyk K. (2006) Fast chromatin immunoprecipitation assay. Nucleic Acids Res., 34, e2. [DOI] [PMC free article] [PubMed] [Google Scholar]
- 48. Yu J., Feng Q., Ruan Y., Komers R., Kiviat N., Bomsztyk K. (2011) Microplate-based platform for combined chromatin and DNA methylation immunoprecipitation assays. BMC Mol. Biol., 12, 49. [DOI] [PMC free article] [PubMed] [Google Scholar]
Associated Data
This section collects any data citations, data availability statements, or supplementary materials included in this article.