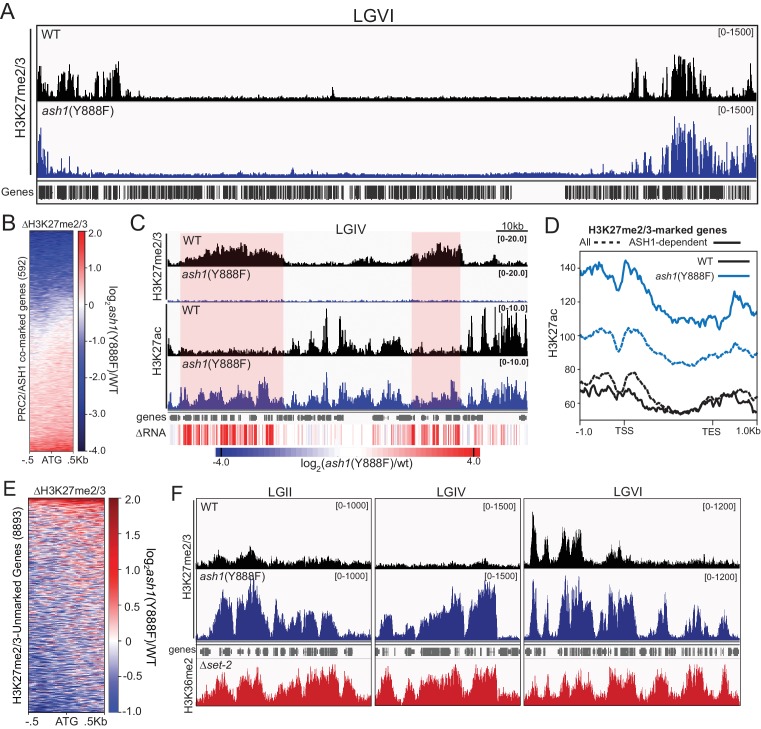
Figure 5. ASH1 activity differentially regulates H3K27me2/3 accumulation.
(A) Representative IGV tracks of H3K27me2/3 in WT and ash1(Y888F) are shown for LGVI. Gene locations are included for reference. (B) Heatmap highlighting frequency and intensity of H3K27me2/3 loss over in the ash1(Y888F) background. (C) IGV tracks of H3K27me2/3 and H3K27ac in WT and ash1(Y888F) strains. Regions of H3K27ac accumulation correlating with gene upregulation (ΔRNA track) are highlighted. (D) Metaplot of H3K27ac accumulation in WT (black) and ash1(Y888F) (blue) strains at either all WT H3K27me2/3-marked genes (dashed line) or genes identified as ‘ASH1-dependent’ (solid line). (E) Change in H3K27me2/3 signal intensity by ChIPseq in the ash1(Y888F) background. Only genes established as ‘unmarked’ are included (Figure 4B). (F) ChIPseq tracks demonstrating H3K27me2/3 gains in ash1(Y888F) and comparison to H3K36me2 in the set-2 background. Depicted regions were selected for their multiple aberrant domains of H3K27me3.


