Abstract
Abnormalities of lateral temporal lobe development are associated with a spectrum of genetic and environmental pathologic processes, but more normative data are needed for a better understanding of gyrification in this brain region. Here, we begin to establish guidelines for the analysis of the lateral temporal lobe in humans in early life. We present quantitative methods for measuring gyrification at autopsy using photographs of the gross brain and simple computer-based quantitative tools in a cohort of 28 brains ranging in age from 27 to 70 postconceptional weeks (end of infancy). We provide normative ranges for different indices of gyrification and identify a constellation of qualitative features that should also be considered in these analyses. The ratio of the temporal area to the whole brain area increased dramatically in the second half of gestation, but then decelerated after birth before increasing linearly around 50 postconceptional weeks. Tertiary gyrification continued beyond birth in a linear process through infancy with considerable variation in patterns. Analysis of 2 brains with gyral disorders of the lateral temporal lobe demonstrated proof-of-principle that the proposed methods are of diagnostic value. These guidelines are proposed for assessments of temporal lobe pathology in pediatric brains in early life.
Keywords: Down syndrome, Gyrification, Operculum, Sylvian fissure, Temporal lobe pathology
INTRODUCTION
Within the lateral temporal lobe resides the cerebral cortex critical for language comprehension, hearing, visual processing, and facial recognition (1–5). The insula, which is covered by the temporal, frontal, and parietal cortices, is closely linked to the temporal lobe in the perisylvian region, and is also involved in language comprehension (6, 7). In addition, the insula contains a viscerotopic map of autonomic and respiratory function and has been implicated pathologically in apnea, hypotension, arrhythmias, and sudden death (8–11). Gyrification of the temporal lobe and closure of the opercula by the surrounding cerebral cortex to cover the insula are spectacular events in the development of the human brain and are generally considered to be condensed between midgestation and term birth—only a 20-week period in the overall time course of a full lifetime. Certain diseases that are known to target gyrification of the temporal lobe and operculation result in simplified or excessive development of regional or global gyri of the temporal lobe and premature or delayed closure of the opercula, as determined in both neuroimaging and autopsy studies (12–23). Moreover, these diseases are associated with cognitive and neurobehavioral deficits, notably in language and visual (i.e. facial) processing, autonomic aberrations, and limbic-related seizures. Indeed, gyrification appears to be an indication of advanced mental processes not present in the developing fetus in the first trimester. Disorders affecting the lateral temporal lobe are associated with a spectrum of genetic and environmental pathological processes, including thanatophoric dysplasia, Down syndrome, epilepsy with asymmetry of the temporal lobe, and fetal alcohol syndrome (12–21). In addition, preterm children at 8 years of age demonstrate a significantly increased bilateral gyrification index of the temporal lobe compared with term controls (22, 23). Many of the anomalies in lateral temporal lobe development are quantitative, that is, related to the size and number of sulci, the area and volume of the temporal lobe relative to that of the other brain lobes, and the correct timing of the appearance of gyri (either advanced or delayed). Alternatively, anomalies may be grossly qualitative, such as a perpendicular pattern of temporal gyri, rather than parallel, to the Sylvian fissure.
Normal variations in gyral and sulcal patterns are poorly understood. To delineate abnormalities in gyral formation at autopsy, neuropathologists need information about normative data for comparison that is based upon reproducible and valid measures of the number, orientation, and length of gyri, and the timing of the closing of the opercula. The timing of the appearance of different sulci and gyri and operculation have been described in the developing human temporal lobe during the critical period of midgestation to term birth and through infancy into adolescence, the latter based upon in vivo neuroimaging studies (24–34), but reliable quantitative methods for temporal gyrification at different developmental stages for use at autopsy are not available. Moreover, human autopsy brains available for study are typically from fetuses, preterm and full term infants, and postnatal infants who die from a variety of diseases, some of which affect brain development and structure in unknown, particularly subtle ways.
The lateral temporal lobe is typically comprised of 3 gyri that run parallel to the Sylvian fissure; the superior and middle temporal gyri are divided by the superior temporal sulcus; caudally, the inferior temporal gyrus is divided from the middle temporal gyrus by the middle temporal sulcus. In considering gyrification at autopsy, however, there appears to be considerable variation in this basic pattern with gyrification in some infant brains appearing to form complex (“jumbled”) configurations without parallel temporal gyri. Normative indices are needed to help delineate the abnormal ends of the spectrum, that is, too few or too many gyri.
In the following study, our overall aim was to begin to establish guidelines for the rigorous analysis of the lateral temporal lobe in humans. Our focus is on the second half of gestation and the first year of postnatal life because that period is when gyrification of the lateral temporal lobe is most explosive. We present quantitative methods for measuring gyrification at autopsy using photographs of the gross brain and simple computer-based quantitative tools in a cohort of 28 brains from 27 to 70 postconceptional weeks (end of infancy). We provide normative ranges for different indexes of gyrification and identify a constellation of qualitative features that are necessary to consider in the assessment of abnormal from normal variant patterns in an autopsy population. Additionally, 2 brains with well-recognized disorders of gyrification of the lateral temporal lobe were analyzed in the same manner as the normative brains to demonstrate proof-of-principle of the proposed methods.
MATERIALS AND METHODS
Clinicopathologic Database
We analyzed the gyrification and operculation of the right lateral temporal lobe of autopsied (male and female) brains from photographs taken of the fixed (10% formalin) brains. Photographs of the right temporal lobe were available in the archives of the Department of Pathology (Boston Children’s Hospital, Boston, MA); thus, the selection of the temporal lobe side was in part determined by the availability of the photographed specimens. The age range selected was the midfetal period through the first 12 postnatal months, that is, infancy. The following data were recorded upon review of the autopsy reports: sex, gestational age, postnatal age, postconceptional age (PCA), postmortem interval, brain weight, any significant lateral temporal lobe or other brain pathology, and cause of death. Parental consent for the use of brains for research was present in each case and the study was approved by the Institutional Review Board of Boston Children’s Hospital. Photographs had been taken between 2003 and 2013 with a standard quality camera utilized consistently for autopsies. Photographs were used that were of technically satisfactory quality to delineate the sulci and gyri of all lobes and degree of operculation in the lateral view of the cerebral hemisphere. Brains that were fragmented upon autopsy removal, distorted in fixation, or demonstrated macroscopic cerebral edema were excluded, as were those with a postnatal age >12 months. Brains were excluded if they had grossly recognizable anomalies of the cerebral cortex, including in the temporal lobe, for example, lissencephaly, polymicrogyria, microcephaly, and pachygyria. Two brains with cortical anomalies were measured separately to validate the measures of temporal lobe gyrification delineated in the normative brains.
Computer-Based Measurements of Gyrification
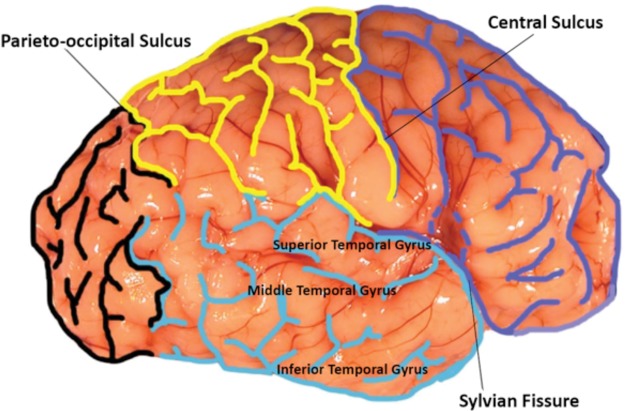
During computer-based analysis of the lateral temporal lobe, we were blinded to the age and cause of death in each case. The computer used for all measurements was a 21.5-in. Retina 5K Display Apple iMac, Model Number A1418. This computer contained both Illustrator and Photoshop CS6 programs. We used Adobe Photoshop to trace the sulci of the lateral cerebral hemisphere of the whole brain. The sulci were delineated in color to facilitate identification: the frontal lobe in dark blue, the parietal lobe in yellow, the occipital lobe in black, and the temporal lobe in turquoise (Fig. 1). The frontal lobe was defined by the boundaries of the Sylvian fissure and cerebral cortex anterior to the central sulcus. The parietal lobe was demarcated by the Sylvian fissure caudally, the central sulcus anteriorly, and the parieto-occipital sulcus posteriorly. The lateral temporal lobe was demarcated posteriorly by the parieto-occipital sulcus, anteriorly by the temporal pole, and rostrally by the Sylvain fissure. The 3 main gyri of the lateral temporal lobe included the superior lateral temporal gyrus below the Sylvian fissure, the middle lateral temporal gyrus, and the inferior lateral temporal gyrus. We used Adobe Illustrator with a Telegraphics Path Area Filter to assess area.
FIGURE 1.
Each brain was first analyzed by marking the sulci of the 4 lobes of the brain. The frontal lobe was marked in blue, the temporal lobe in turquois, the parietal lobe in yellow, and the occipital lobe in black for rapid visualization of lobar sulcation. The boundaries of each lobe and the sulci within each lobe were traced using Photoshop. The frontal lobe and parietal lobe were separated by the central sulcus. The temporal lobe and frontal lobe were divided by the Sylvian fissure; the temporal lobe was further identified through its 3 distinct gyri: superior, middle, and inferior temporal gyri. The parieto-occipital sulcus divided the parietal lobe from the occipital lobe. The identification of these specific sulci and gyri for each case allowed for a consistent labeling of the lobes examined.
To standardize the measures relative to the different variations in sizes with increasing ages, we measures were presented as ratios. The 5 ratios determined were: (1) area of temporal lobe/whole brain area, (2) area of temporal lobe/area of frontal lobe, (3) length of Sylvian fissure/the entire fronto-occipital length, (4) area of any open opercula/length of Sylvian fissure, and (5) width of the superior temporal gyrus/width of the entire temporal lobe (Table 1). For the ratio of the open opercula area to the length of the Sylvian fissure, the square root of the area of the open operculum (mm2) was taken and divided by the length of the Sylvian fissure (mm) to convert units from mm2 to mm. The open exposure of the insula by overhanging temporal, frontal, and parietal lobes was delineated by the area of any insula exposed. A thin superior temporal gyrus was established by determination of the width of the superior temporal gyrus relative to the area of the temporal lobe. The length of the Sylvian fissure was determined by tracing the sulcus that separates the temporal lobe from the parietal and frontal lobes, and dividing this measure by the entire fronto-occipital length. The gyrification index was established by determination of the number of uninterrupted sulci through each lobe added to each other into 1 variable/lobe. Sulci were counted by identifying each new sulcus at a branched point and the formation of an angle (Fig. 2). The greater the total numbers of sulci (additive), the greater the gyrification.
TABLE 1.
Measures of Gyrification Proposed in this Study
|
FIGURE 2.
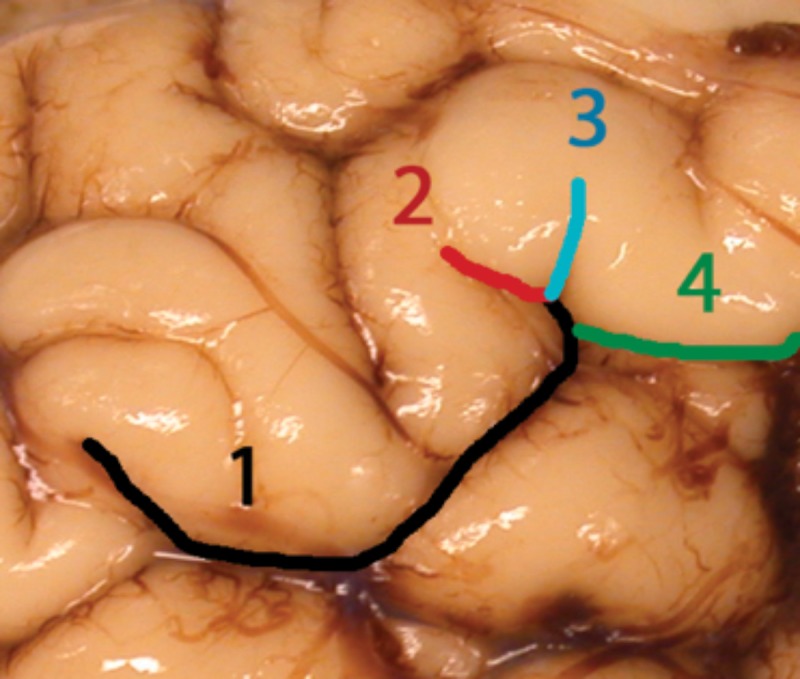
The gyrification index measured based on sulcation of the examined lobes. Each sulcus was counted as “one” (1 in the figure), and the total number of sulci were added to form a gyrification index for the entire brain. For the gyrification index of the temporal lobe, only the sulci within the temporal lobe were summed. Whenever there was a “branching” of a sulcus, after the branch point, the sulcus 1 branched into sulci 2–4 in the figure. Not all the sulci are labeled in this figure for illustration.
Qualitative Assessment of Gyrification
In addition to quantitative measurements, each brain in the cohort was analyzed qualitatively by visual inspection. The brains were surveyed for the following qualities: (1) open operculum after 44 weeks PCA; (2) abnormal shape of the temporal lobe relative to other lobes; (3) thin superior temporal gyrus; (4) sulci running in the perpendicular direction to the Sylvian fissure; (5) a jumbled appearance due to sulci tightly packed together with many oblique sulci; (6) an obviously enlarged area of the temporal lobe compared with that of the frontal lobe; and (7) an abnormal length of the Sylvian fissure, either obviously too short or too long (Table 1). We assessed the presence of these traits visually based on the same photographs utilized for quantitative analysis, and then determined the frequency of each trait within our cohort. Many of these qualitative assessments intend to capture the same trait as the quantitative measures, and thus confirm these traits both qualitatively and quantitatively.
Statistical Analysis
Generalized additive modeling was used to determine whether PCA had a nonlinear relationship with quantitative outcomes. Means of quantitative outcomes by sex and presence versus absence of visually complex gyral pattern (“jumbled gyri”) were compared using the Student t-test. Means of quantitative outcomes by jumbled gyri status with adjustment for PCA were compared using analysis of covariance. Postmortem interval by sex and by presence versus absence of jumbled gyri was compared using the Wilcoxon rank sum test. The association of presence versus absence of jumbled gyri with quantitative measurements and adjustment for PCA was also examined with logistic regression. Classification and Regression Tree (CART) analysis was used to identify morphological subgroups most likely to have jumbled gyri. Quantile regression was used to estimate the 10th, 50th, and 90th percentile values for the quantitative measurements as a flexible function of PCA (natural cubic splines with knots at 37 and 46 weeks).
RESULTS
Clinicopathologic Database
The entire cohort consisted of 30 brains, of which 2 had gross malformations of the temporal lobe. The ages ranged from 27 to 70 postconceptional weeks. In the normative cohort brains (n = 28), the mean PCA was 42.6 ± 10.4 weeks with a median of 41.0 weeks (range: 34.6–46.6 weeks). The causes of death are provided in Table 2. There were no differences between the males (n = 18) and females (n = 12) in gyrification of the lateral temporal lobe in this cohort (data not shown); thus, the brains of males and females were combined to form the normative cohort without known brain malformations.
TABLE 2.
Causes of Death in Study Cohort
| Case | PCA weeks | Sex/race | Clinical diagnosis |
|---|---|---|---|
| 1 | 48.0 | F/– | Down syndrome, congenital heart disease |
| 2 | 38.9 | M/– | Anterior mediastinal teratoma |
| 3 | 46.3 | M/– | Congenital heart disease |
| 4 | 40.6 | M/C | Unspecified urea cycle defect |
| 5 | 47.0 | M/– | Carbohydrate deficient glycosylation disorder with pontocerebellar hypoplasia |
| 6 | 39.6 | M/– | Respiratory failure and sepsis |
| 7 | 56.6 | F/– | Prematurity, bronchopulmonary dysplasia |
| 8 | 44.0 | F/– | Congenital heart disease |
| 9 | 33.9 | M/– | Necrotizing enterocolitis |
| 10 | 32.6 | M/– | Tracheo-esophageal fistula |
| 11 | 48.6 | M/C | Prematurity, bronchopulmonary dysplasia necrotizing enterocolitis |
| 12 | 57.0 | M/– | Shone’s syndrome, congenital heart disease |
| 13 | 66.0 | M/– | Hypoxic ischemic encephalopathy; superior sagittal vein thrombosis |
| 14 | 37.6 | F/– | Congenital heart disease |
| 15 | 71.0 | F/– | Pulmonary hypertension with lung transplant |
| 16 | 41.4 | M/– | Glycogen storage disease |
| 17 | 33.1 | F/– | Bronchopulmonary dysplasia necrotizing enterocolitis |
| 18 | 46.3 | M/– | Congenital heart disease |
| 19 | 43.9 | M/– | Prematurity, shortened bowel syndrome |
| 20 | 32.1 | M/– | Congenital heart disease |
| 21 | 33.0 | M/– | Renal cystic dysplasia |
| 22 | 29.3 | M/– | Hyaline membrane disease, pulmonary hemorrhage |
| 23 | 35.3 | M/– | Disseminated type I herpes |
| 24 | 41.4 | M/– | Birth Asphyxia |
| 25 | 47.0 | F/– | Prematurity; hyaline membrane disease |
| 26 | 43.7 | F/– | Prematurity; hyaline membrane disease |
| 27 | 38.4 | F/– | Congenital heart disease |
| 28 | 27.1 | M/– | Hyaline membrane disease, pulmonary hemorrhage |
| 29 | 39.3 | F/– | Myopathy, probable glycogen disorder |
| 30 | 39.6 | F/– | Congenital heart disease |
PCA, postconceptual age, weeks; C, Caucasian; –, not available; M, male; F, female.
Prenatal Development in Gyrification of the Lateral Temporal Lobe
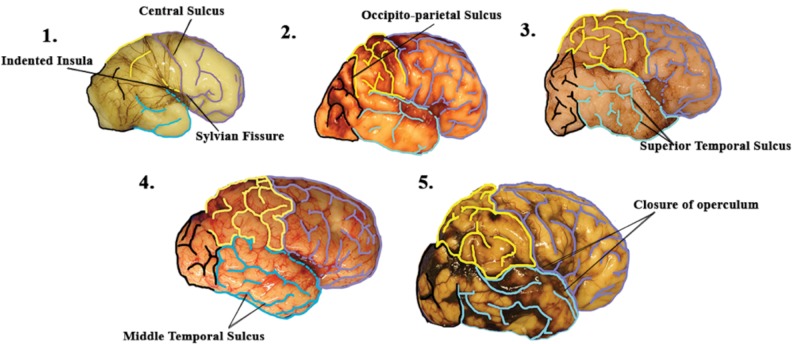
The primary Sylvian fissure and interhemispheric fissure, central sulcus, and indentation of the insula all first appear earlier than the youngest brain in our cohort (27 weeks), occurring at 10–15 weeks (24, 25; Table 3). The superior temporal gyrus and sulcus are known to begin to develop at 20–23 postconceptional weeks, and the major hemispheric growth in the temporal lobe is starts at 20–22 postconceptional weeks (Fig. 3). Frontal, parietal, and temporal lobes covered the insula from 27 postconceptional weeks until full term when the operculum was completely closed (Fig. 3; Table 3). The operculum closed in the posterior to middle to anterior direction of the Sylvian fissure. Three parallel gyri were noted at birth: the superior, middle, and inferior temporal gyri (Fig. 3). At birth, the primary and secondary sulci appeared formed in their basic configuration. The ratio of operculum to Sylvian fissure length was negatively correlated with PCA R = −0.70, p < 0.001; Table 4). All other quantitative measurements were positively correlated with PCA (R ranging from 0.38 to 0.76), except width of the superior temporal gyrus/area of temporal lobe (R = 0.08, p = 0.70; Table 4). The gyrification indices had the strongest correlation with PCA (R = 0.76 for temporal lobe and R = 0.72 for whole brain, both p < 0.001).
TABLE 3.
Sequential Development of Human Sulcation in the Lateral Temporal Lobe From 27 to the End of Infancy
| Sulcus | First appearance in past studies (PCA) | First appearance in cohort | Completion of development (PCA) |
|---|---|---|---|
| Sylvian fissure | 14–16 weeks (24) | 27 weeks | 32.5 weeks |
| Indented insula | 19–20 weeks (24) | 27 weeks | 27 weeks |
| Central sulcus | 20 weeks (24) | 27 weeks | 27 weeks |
| Occipital–temporal sulcus | 16 weeks (24) | 27 weeks | 32 weeks |
| Superior temporal sulcus | 27–32 weeks (24) | 27 weeks | 33 weeks |
| Middle temporal sulcus | 30 weeks (24) | 27 weeks | 38.5 weeks |
| Closure of posterior operculum | NA | 29 weeks | 39.5 weeks |
| Closure of middle operculum | NA | 32 weeks | 35 weeks |
| Closure of anterior operculum | Term (24) | 44 weeks | 46 weeks |
Data from 28 brains. The youngest age in the cohort was 27 gestational weeks. We provide information from the literature about the timing of sulci before that age from published references by others. NA, not available; PCA, postconceptional age.
FIGURE 3.
A basic “timeline” of the development of the normal human brain in its earliest stages. In the youngest brain in the cohort, at 27 gestational weeks, the central sulcus and Sylvian fissure are already present and there is a clear indentation of the insula (panel 1). At 32 postconceptional weeks (panel 2), the formation of the occipito-parietal sulcus dividing the parietal lobe from the occipital lobe is seen. At 33 postconceptional weeks, the superior temporal sulcus of the temporal lobe is clearly defined to begin the formation of the 3 parallel gyri of the temporal lobe (panel 3). At 38.5 postconceptional weeks, the middle temporal sulcus is also defined to complete the gyrification of the temporal lobe (panel 4). Finally, around 44 postconceptional weeks (the pictured brain is 46 postconceptional weeks) there is closing of the open operculum in the anterior, middle, and posterior regions (panel 5).
TABLE 4.
Pearson Correlation Between Quantitative Measures and Postconceptional Age
| Measure | Correlation R | p value |
|---|---|---|
| Temporal lobe area/whole brain area | 0.38 | 0.04 |
| Temporal lobe area/frontal lobe area | 0.36 | 0.06 |
| Area of open opercula/length of Sylvian fissure | −0.70 | <0.001 |
| Width of superior temporal gyrus/temporal lobe area | 0.08 | 0.70 |
| Length of Sylvian fissure/length of fronto-occipital line | 0.51 | 0.005 |
| Gyrification of temporal lobe | 0.76 | <0.001 |
| Gyrification of whole brain | 0.72 | <0.001 |
Postnatal Changes in Gyrification of the Lateral Temporal Lobe
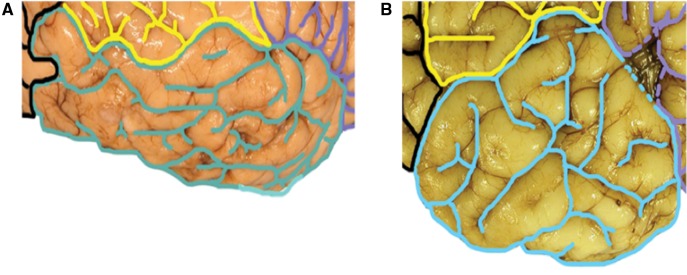
After term birth, tertiary sulcation continued both qualitatively and quantitatively throughout the first year of life (Fig. 3). Such sulci were noted qualitatively in oblique directions in the superior, middle, and inferior temporal gyri at relatively simultaneous time points. In 16/28 (57%) of the brains, the oblique sulci did not “blur” the distinctions in sulcation of the 3 major temporal lobe gyri running in parallel (Fig. 3). However, the sulci pattern in 12 brains (43%) appeared visually more complex, with the tertiary sulci in a “jumbled” pattern with oblique tertiary sulci, which made the parallel configuration indistinct and almost obliterated (Fig. 4). The cases with jumbled gyri were older (49.8 ± 13.6 postconceptional weeks) than those without jumbled gyri (38.2 ± 7.1 weeks; p = 0.008). The gyrification index in the temporal lobes both with and without jumbled gyri increased linearly with PCA (p < 0.001), but the age-adjusted mean ± SE gyrification index was higher in the cases with jumbled gyri (19.47 ± 1.67) compared with the cases without jumbled gyri (13.03 ± 1.42; p = 0.010). To explore the age effect further, nonparametric modeling was performed to confirm the linear association. We estimated the mean gyrification index by PCA using a flexible model and linear model (data not shown). The nonlinearity p value from the flexible model was not significant (p = 0.55), indicating that age-related increases in the temporal lobe gyrification index were linear.
FIGURE 4.
Two examples of jumbled gyrification of the temporal lobes. (A, B) Three parallel gyri of the temporal lobe that typically characterize the main configuration of the lateral temporal lobe are not evident. Rather, multiple gyri and sulci form a seemingly random configuration in these examples.
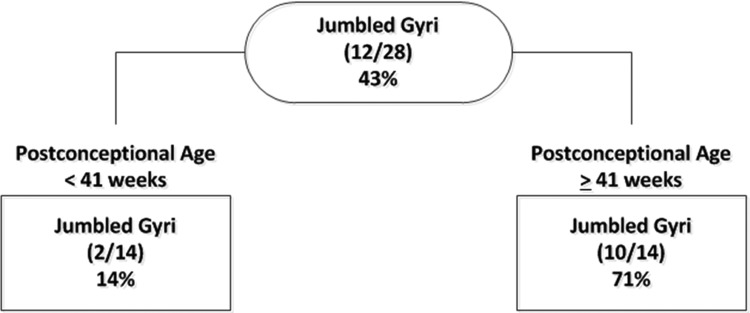
We raised the question of whether jumbled gyri in the first year of life were abnormal, and not a complex variant of normal, even though they were present in a large number of cases in our sample size (43%). Nevertheless, this large proportion could reflect enrichment of “abnormal” cases in an autopsy population with diverse brain insults prior to death in which gyrification defects are subtle and not currently recognized as problems. We reasoned that if the jumbled gyri were “abnormal”, they would be associated with 1 or more other gross or quantitative markers of abnormal gyrification. Thus, a CART analysis was performed to identify the factors that provided the greatest discrimination between brains with and without jumbled gyri (Fig. 5). Because of their correlation by definition, the gyrification indexes were not used in the CART analysis. All other quantitative and qualitative brain measures were included as potential predictors. The qualitative measures were persistence of open opercula, box shape of frontal lobes (as seen in Down syndrome (13)), thin superior temporal gyrus, disproportionately enlarged temporal lobe, and shortened or elongated Sylvian fissure. PCA was also allowed as a potential factor for the CART. When PCA was considered, it was the only factor that was selected by the CART algorithm, with a cutoff point of 41 weeks (Fig. 5). The overall prevalence of jumbled gyrus in the “normative” cohort was 43% (Fig. 5). Jumbled gyri were present in 71% (10/14) of the brains from cases dying at 41 postconceptional weeks or older. In contrast, jumbled gyri were present in only 14% (2/14) of the deaths occurring at <41 postconceptional weeks. Thus, PCA was the strongest discriminator of brains with and without jumbled gyri in the CART analysis, and no other qualitative or quantitative measure had additional significant discriminatory power after stratification by PCA.
FIGURE 5.
Classification and Regression Tree (CART) for qualitative determination of jumbled gyri. Only PCA significantly discriminated between cases with and without jumbled gyri.
Normative Curves of Growth of Lateral Temporal Lobe
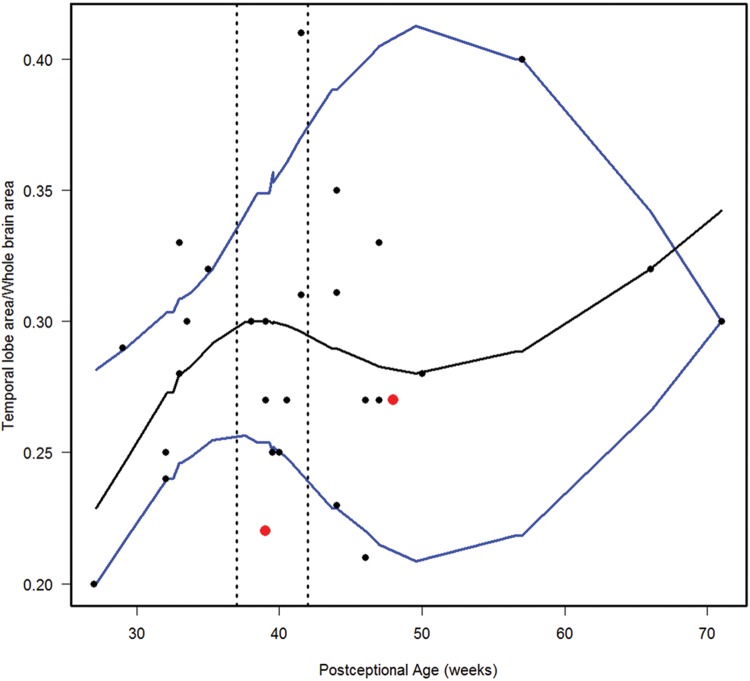
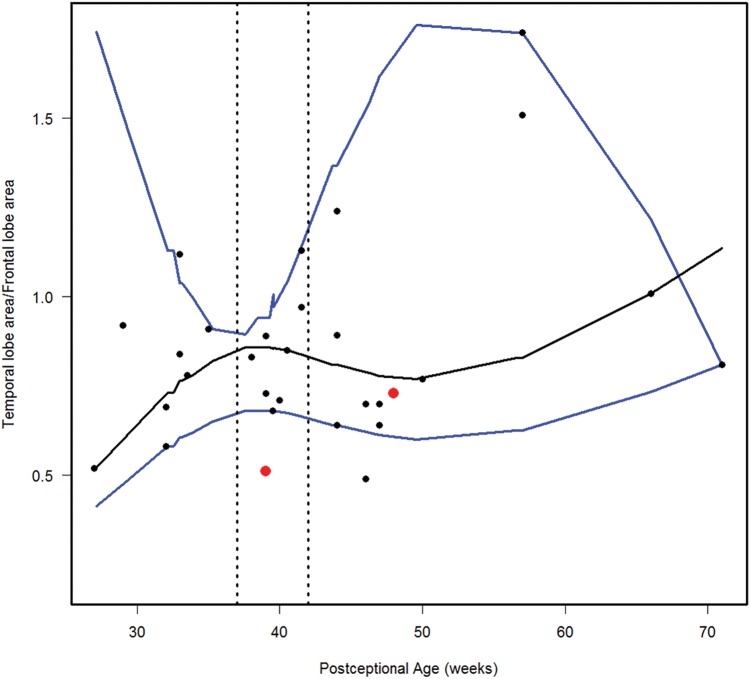
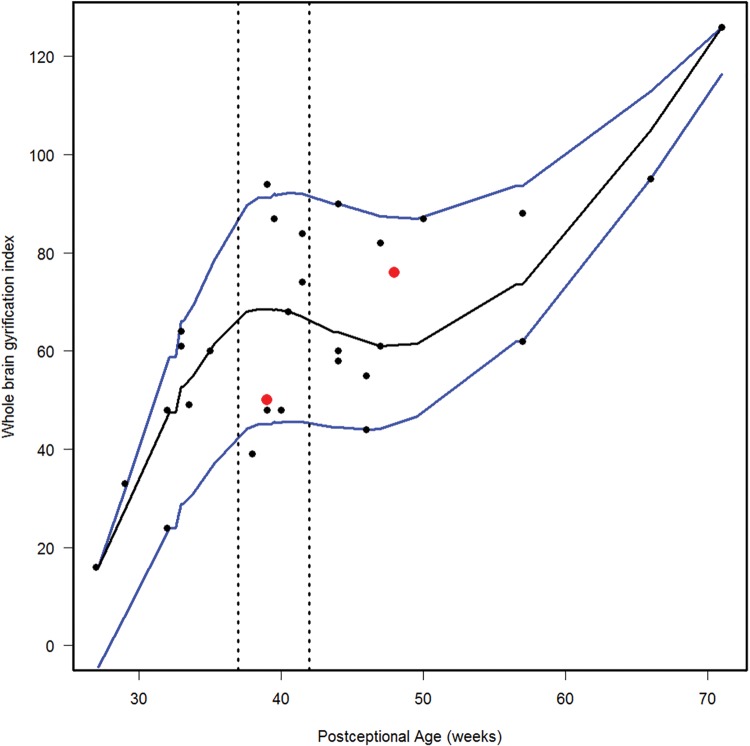
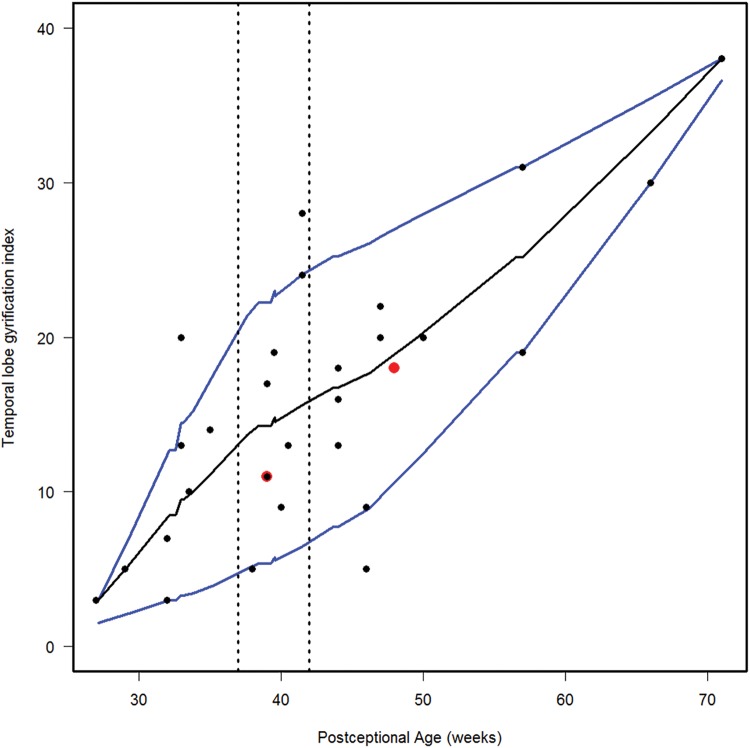
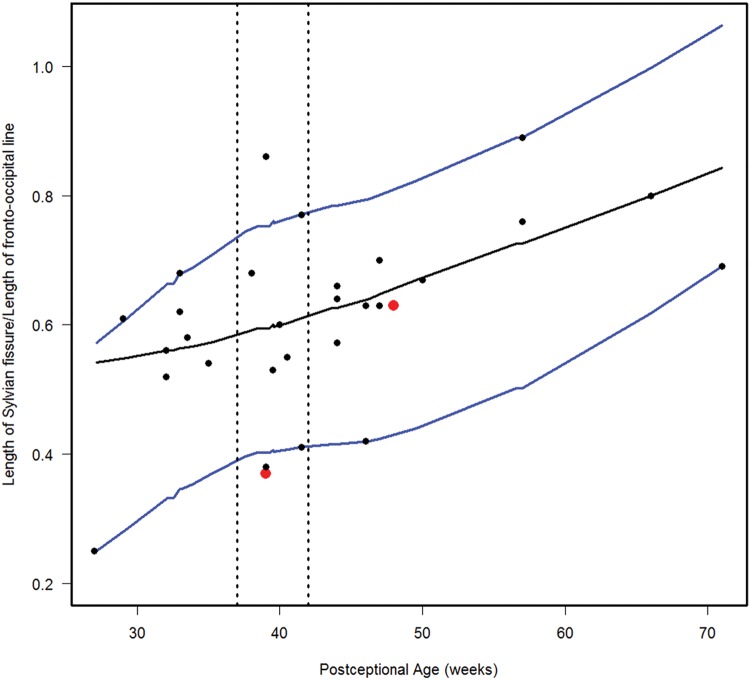
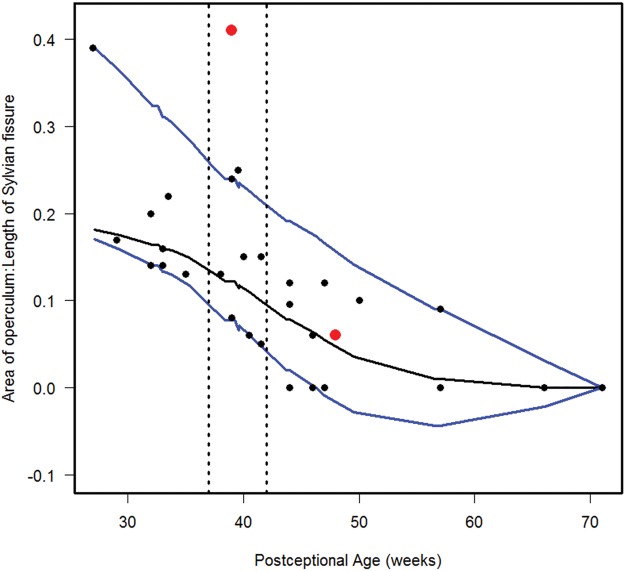
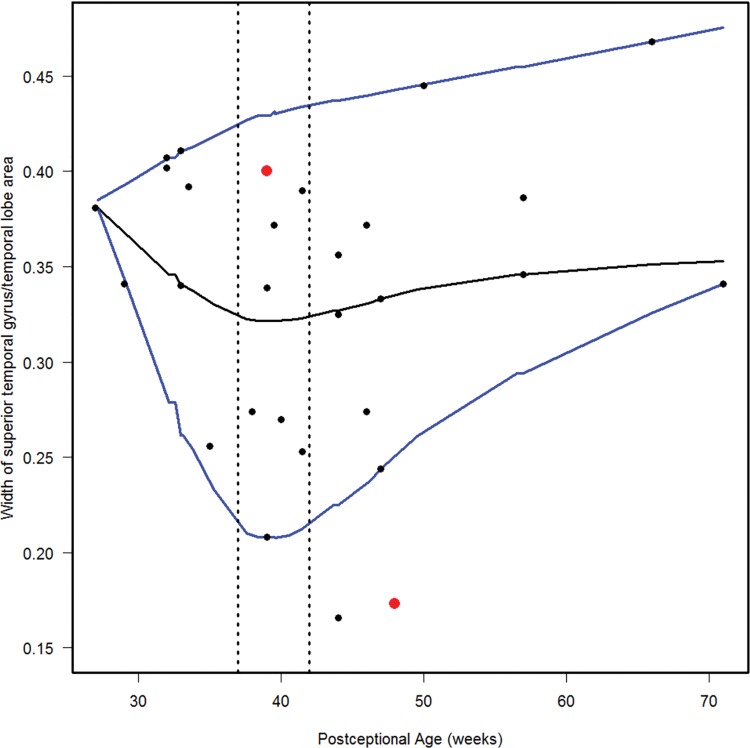
We estimated the 10th, 50th, and 90th percentiles for 7 of the computer-based quantitative measures in the normative cohort (Figs. 6–12). With increasing PCA from midgestation to term birth (37–42 weeks), the ratio of the temporal lobe area to whole brain area increased by ∼83%, and the temporal lobe area grew disproportionately faster than the brain area as a whole (Fig. 6). At term birth, however, this disproportionate growth of the temporal lobe area decelerated with a fall in the ratio by 10% by 50 postconceptional weeks, with a steady rise of 76% from then to the end point of 70 postconceptional weeks (Fig. 6). At the 50th percentile, the temporal lobe area over the frontal lobe area (Fig. 7) is similar to temporal lobe area over whole brain area (Fig. 6). The overall gyrification index of the whole brain followed this same pattern, with an initial peak at term birth (Fig. 8). This pattern of growth was also similar in the ratio of the temporal lobe area to the frontal lobe area, although the increase in overall ratio was 65% greater in size than the temporal lobe area to overall brain area ratio. The gyrification index of the temporal lobe rose steadily, without a peak at term and subsequent valley (Fig. 9). Thus, the temporal lobe continued to form sulci up to at least 1 year of life. The ratio of the Sylvian fissure length to the fronto-occipital length increased steadily by 10%, indicating an increased lengthening of the Sylvian fissure relative to the length of the overall expanding brain length from occipital to frontal pole (Fig. 10). The ratio of the area of the open operculum to the length of the Sylvian fissure steadily decreased from midgestation to 70 postconceptional weeks, indicating increasing closure of the operculum with increasing age; there was a ratio of zero (complete closure) at ∼65 postconceptional weeks; Fig. 11). The ratio of the width of the superior temporal gyrus to the area of the remaining temporal lobe initially decreased by 8% to term birth and plateaued thereafter to 70 postconceptional weeks (Fig. 12), indicative of an initial decrease in width of the superior temporal gyrus with relative stabilization of growth thereafter.
FIGURE 6.
Normative curve for the temporal lobe area/whole brain area. The vertical dotted lines bracket term birth (37–40 postconceptional weeks). The black line represents the estimated 50th percentile (median), and the 10th and 90th percentiles are denoted with blue lines. The red dots represent the 2 abnormal cases with the Down syndrome case (Case 1) at 48 postconceptional weeks, and the case (Case 2) with at malformed temporal lobe with an asymmetric and malrotated hippocampus, at 39 postconceptional weeks.
FIGURE 7.
Normative curve for the temporal lobe area/frontal lobe area. The vertical dotted lines bracket term birth (37–40 postconceptional weeks). The black line represents the estimated 50th percentile (median), and the 10th and 90th percentiles are denoted with blue lines. The red dots represent the 2 abnormal cases with the Down syndrome case (Case 1) at 48 postconceptional weeks, and the case (Case 2) with at malformed temporal lobe with an asymmetric and malrotated hippocampus, at 39 postconceptional weeks.
FIGURE 8.
Normative curve of the whole brain gyrification index. The vertical dotted lines bracket term birth (37–40 postconceptional weeks). The black line represents the estimated 50th percentile (median), and the 10th and 90th percentiles are denoted with blue lines. The red dots represent the 2 abnormal cases with the Down syndrome case (Case 1) at 48 postconceptional weeks, and the case (Case 2) with at malformed temporal lobe with an asymmetric and malrotated hippocampus, at 39 postconceptional weeks.
FIGURE 9.
Normative curve of the temporal lobe gyrification index. The vertical dotted lines bracket term birth (37–40 postconceptional weeks). The black line represents the estimated 50th percentile (median), and the 10th and 90th percentiles are denoted with blue lines. The red dots represent the 2 abnormal cases with the Down syndrome case (Case 1) at 48 postconceptional weeks, and the case (Case 2) with a malformed temporal lobe with an asymmetric and malrotated hippocampus, at 39 postconceptional weeks.
FIGURE 10.
Normative curve for the length of Sylvian fissure/length of fronto-occipital line. The vertical dotted lines bracket term birth (37–40 postconceptional weeks). The black line represents the estimated 50th percentile (median), and the 10th and 90th percentiles are denoted with blue lines. The red dots represent the 2 abnormal cases with the Down syndrome case (Case 1) at 48 postconceptional weeks, and the case (Case 2) with at malformed temporal lobe with an asymmetric and malrotated hippocampus, at 39 postconceptional weeks.
FIGURE 11.
Normative curve for the area of the open opercula/length of the Sylvian fissure. The vertical dotted lines bracket term birth (37–40 postconceptional weeks). The black line represents the estimated 50th percentile (median), and the 10th and 90th percentiles are denoted with blue lines. The red dots represent the two abnormal cases with the Down syndrome case (Case 1) at 48 postconceptional weeks, and the case (Case 2) with at malformed temporal lobe with an asymmetric and malrotated hippocampus, at 39 postconceptional weeks.
FIGURE 12.
Normative curve for the width of the superior temporal gyrus/temporal lobe area. The vertical dotted lines bracket term birth (37–40 postconceptional weeks). The black line represents the estimated 50th percentile (median), and the 10th and 90th percentiles are denoted with blue lines. The red dots represent the two abnormal cases with the Down syndrome case (Case 1) at 48 postconceptional weeks, and the case (Case 2) with at malformed temporal lobe with an asymmetric and malrotated hippocampus, at 39 postconceptional weeks.
Analysis of 2 Primary Malformations of the Brain
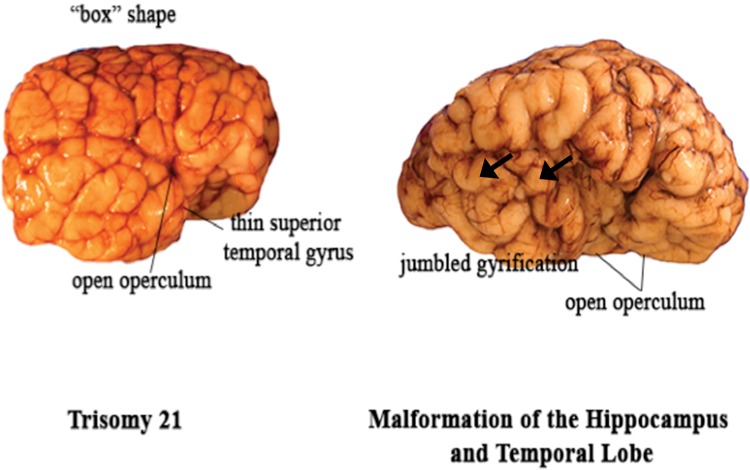
We analyzed 2 brains with grossly recognized malformations in the lateral temporal lobe: a case of Down syndrome at 48 postconceptional weeks (Case 1), and a case of a malformed temporal lobe with an asymmetric and malrotated hippocampus at 39 postconceptional weeks in a patient with an anterior mediastinal teratoma (Case 2, Table 2; Fig. 13). The Down syndrome brain had the typical box shape of the frontal lobes (Fig. 13). Qualitatively, the superior temporal gyrus appeared narrow, particularly at the anterior and middle levels (Fig. 13). Quantitatively the ratio of the width of the superior temporal gyrus to the area of the temporal lobe was below the 10th percentile (Fig. 12), indicative of the narrow width of the superior temporal gyrus relative to the temporal lobe area, as expected from the gross inspection of the brain. The other quantitative indices were all between the 10th and 90th percentiles (Figs. 6–11). In Case 2, the operculum was wide open on gross inspection and the frontal lobe area appeared disproportionately larger than the temporal lobe area (Fig. 13). The temporal gyri were not parallel; rather, they ran in an anterior oblique direction from the Sylvian fissure to the caudal border of the interior temporal gyrus, almost perpendicular to the Sylvian fissure. The quantitative measures highlighted the following features: (1) the ratio of the temporal area to total brain area was below the 10th percentile, indicative of a smaller temporal area relative to the total area (Fig. 6); (2) the ratio of the temporal area to the frontal area also was below the 10th percentile, indicative of a larger frontal area relative to temporal area (Fig. 7); (3) the ratio of the area of the operculum to the length of the Sylvian fissure is much greater than the 90th percentile, indicative of a wide open operculum for age (Fig. 11); and (4) the ratio of the Sylvian fissure length to the fronto-occipital length was below the 10th percentile (Fig. 10), indicative of a markedly shortened Sylvian fissure relative to the long, wide open opercula (Fig. 11). The other quantitative indices were within the 10th and 90th percentiles, although just above the 10th percentile for the temporal gyrification index (Fig. 9), consistent with the appearance of simplified gyri in the temporal lobe (Fig. 13).
FIGURE 13.
Two brains with abnormal lateral temporal lobes. Left: In Case 1 of Down syndrome, the superior temporal gyrus is narrow, particularly in the anterior and middle portions. The overall shape of the frontal lobes is box-like. Right: In Case 2 (patient with an anterior mediastinal teratoma), the perisylvian area is abnormal with an inappropriately wide opercula for age, 2 anteriorly perpendicular temporal lobe gyri (arrows), and a relatively small temporal lobe area relative to that of the frontal lobe.
DISCUSSION
The major finding of this study is that gyrification (i.e. the process by which the brain undergoes changes in surface morphology to create sulcal and gyral regions) of the temporal lobe does not end at term birth, but rather continues at least through the first year of postnatal life. It is an orderly developmental topographical process with the temporal and frontal areas being the last to develop mature gyri (34, 35). It has been thought that during evolution cortical folding enables the human brain to grow markedly in volume and to expand in surface area despite being confined within the bony skull (36). It is suggested that the development of gyral folds allow for an optimal compaction of neuronal fibers with efficient signal transmit time that results in effective wiring and volume configurations for the dense axonal connectivity that exists within the human brain (25, 37–40). As verified here, human gyrification begins prior to birth with the early stages taking place between 10 and 20 weeks of fetal life and with the most dramatic growth occurring in the third trimester. During this span of only 20 weeks, the brain surface develops from a relatively smooth lissencephalic structure to one that closely resembles the morphology of the adult brain; standard teaching is that essentially all primary, secondary, and tertiary sulci have formed at term (25, 31). Zilles et al applied a 2-dimensional gyrification index, which demonstrated that brains with a higher degree of cortical folding yielded larger values of the gyrification index (41). On the basis of a series of autopsy brains ranging from 11 gestational weeks to 97 years, Armstrong et al found that the gyrification index applied by them (defined by the ratio between the lengths of coronal outlines of the brain including and excluding sulcal regions) increases dramatically during the third trimester, and then remains relatively constant throughout development thereafter (31). Because the brain nearly triples its volume from birth to adulthood, the process of gyrification was considered to continue through the postneonatal period, but by maintaining this constant ratio (31). Our data utilizing a different 2-dimensional gyrification index suggests that new tertiary sulci continue to form, thereby linearly increasing the gyrification index of the temporal lobe through the first postnatal year. The age at which this tertiary gyrification in the temporal lobe is complete is unknown; the present study focuses only through the first postnatal year.
The demonstration that the “jumbled gyri” in a near majority of the autopsy brains otherwise considered normative reflects a complex pattern of sulcal development due to the appearance of tertiary gyri, and is only predicted by PCA. This pattern is not associated with definite abnormities (e.g. delayed closure of operculum) or small superior temporal gyrus. These observations support the conclusion that jumbled gyri occur as normal variations with increasing complexity with increasing age across infancy and that they are not associated with frank abnormalities. This underscores the likelihood that jumbled gyri are not abnormal. The 1 case with perpendicular gyri to the Sylvian fissure was the temporal lobe malformation, in which 2 perpendicular gyri were associated with other distinct abnormalities, including a small area of the temporal lobe relative to that of the frontal area, and a wide open operculum with short Sylvian fissure. We did not find a consistent pattern in the complex tertiary oblique sulcation in the jumbled gyri, suggesting that they are not genetically “hard-wired” in appearance or possibly in number. Therefore, they may represent individual, even environmentally induced, changes. Little attention has been paid in previous studies to the wide range in the variation in gyrification in the lateral temporal lobe in autopsy brains, but the recognition of this degree of variation is important for assessing temporal lobe pathology in individual cases.
Geometric techniques with MRI have been used to compute global and local gyrification indices with 3-dimensional parameters (25). By applying this method to a population of older children and adolescents, significantly increased gyrification in the right parietal lobe and right cingulate cortex, as well as age-related differences in the left frontal, right parietal and right cingulate cortex, were found between the ages of 8 and 19 years (25). In another study of gyrification in normal development studied with neuroimaging techniques, increased cortical complexity was found in the prefrontal regions of protracted brain development between the ages of 6 and 16 years (42). Our data based on measuring sulcation in 2 dimensions from readily obtained photographic images of the external brain suggest that gyrification with tertiary sulci continues at least through the first postnatal year, and future examination of older brains with the same technique may confirm continuous cortical molding, particularly in the frontal lobe with the known longest time frame of maturation. A large series of autopsy brains with a sufficient sample size at regular yearly intervals is needed through adolescence. In this way, a reference autopsy population (which unavoidably contains brains with likely minimal insults that may potentially impact gyrification) can be developed for studying the relationship between gyrification and neurological and psychiatric conditions throughout childhood. A wide variation in tertiary gyrification of the temporal lobe gyri as seen in our study increases the difficulty in distinguishing abnormalities from the normal variants.
A second major finding of this study is that the ratio of the temporal area to the whole brain area increases dramatically in the second half of gestation, but then decelerates after birth before increasing linearly again around 50 postconceptional weeks. This pattern of temporal lobe growth, which is also similar relative to the area of the frontal lobe, has not been previously recognized. Despite these rises and falls in the ratio of area of lobe, the gyrification index in the temporal lobe steadily increases. The biological basis of this rise, then fall, then rise again in ratio of temporal area to overall brain area is not known, but speaks to the plasticity of lobar development across its growth in early life. Because gyrification is partially dependent upon an increasing cortical tissue volume and thickness (22), we speculate that regressive changes in the cerebral cortex in the immediate postnatal period may be responsible for the decreased ratio, perhaps due to programmed cell loss in the cerebral cortex and/or pruning of axonal afferents to the cortex. It may less likely be due to synaptic pruning because synaptogenesis in the temporal lobe begins in the third trimester, increases rapidly, and reaches a peak at 3–4 postnatal months (43). The period of the dramatically rapid rise and fall in the ratio in the second half of gestation suggests that this time period is particularly sensitive to environmental insults or teratogens. The lateral temporal lobe in the perisylvian area, as well as overall, has been shown to be particularly vulnerable to prenatal exposure to alcohol across gestation (17, 18). With increasing age, the length of the Sylvian fissure relative to the fronto-occipital length increases as the Sylvian fissure increases in size. The Sylvian fissure seems to lengthen as the operculum closes, which could be another determinant of age and brain maturity. This developmental change also coincides with our hypothesis that gyrification increases with age, as the Sylvian fissure is a specific primary sulcus.
Examination of 2 brains with readily recognizable malformations of the lateral temporal lobe served as proof-of-principle that our methods of quantitation of lateral temporal lobe measures are valid. The quantitative measures that were outside the estimated 10th and 90th percentiles matched the qualitative abnormalities identified by visual inspection. The use of the estimated curves for the 10th and 90th percentiles should be of help in evaluating brains when the abnormalities are not a priori expected or visually obvious, and are novel to understanding the particular brain or its disorder.
A limitation of our analysis is the relatively small size of our cohort, which limits the precision of the estimated centiles, including the median. We did not graph the confidence bands around the estimated median curve because they are understandably wide based on a cohort of 28 brains, and approach the 10th and 90th centile curves. Thus it is possible that a value from a brain under evaluation that does not greatly exceed our estimated 10th and 90th percentiles is within the range of normal; nevertheless, our graphs are a starting point for development of a reference standard. The proposed method is relatively easy to use, requiring only a graphics program on a personal computer, and good quality photographs of the lateral surface of the brain on the right side for comparison. Of note, it is important to measure the right side for comparison because asymmetries between the right and left temporal lobes have been reported in the human brain beginning during gestation (44). Prior to midgestation, it is difficult to predict the anomalies of temporal lobe development because the lobe is lissencephalic. The rapid changes in gyrification during the second trimester mark a period when temporal lobe anomalies are first reliably detectable. The quantitative curves in this study should provide initial measures of different developmental parameters for reference.
This study is also limited in that it is based upon autopsy information from young children in early life who have died of a variety of causes, some of which are known, and some that are likely to affect gyrification. Deriving normative data from autopsy populations is, therefore, challenging. In observing brain features in an autopsy population of fetuses and infants, the question arises as to whether they are normal variants, or rather, abnormalities readily detected in the abnormality-enriched population of an autopsy series. The major dilemma comes with deciphering “normality” in brains of autopsied fetuses and infants because they are prima facia “not normal”, reflecting the truism that “normal fetuses and infants don’t die”. In this study, we address this issue directly by defining curves with estimated 10th and 90th percentile brackets, and determining whether potential normal variants, that is, jumbled gyri, stand alone or are associated with other anomalies. Furthermore, the study is limited in its relatively small sample size based on available autopsies of infants from a single institution database defined by a time span when standardized photographs of the right side of the brain were available.
In conclusion, gyrification with its direction, width, length, and timing of sulci is considered a way to measure brain health. The reference curves generated in this study of autopsy brains provide an upper (90th percentile) and lower (10th) threshold of quantitative indices of lateral temporal lobe formation in early human life, with the speculation that measures within the threshold values correlate with optimal brain function. Although we framed abnormal gyrification as a malformation of brain development outside the threshold, past studies have approached the topic with a different perspective. The 3 parallel gyri of the temporal lobe could in fact be an “idealized” version of the reality of a developing temporal lobe across a wide spectrum of the population. In the case of Albert Einstein’s brain, for example, variants in gyrification patterns were not interpreted as abnormal, although conventionally considered abnormal (e.g. short Sylvian fissure), but were interpreted as an indication of Einstein’s superior intelligence in certain areas (36). The “abnormal” gyrification (different from the norm) noted in his parietal lobe was seen as an indication of his heightened spatial and reasoning skills, while the apparent decreased volume of his temporal lobe and shortened or “branched” Sylvian fissure was thought to explain his shortcomings in language and social skills, particularly in early life, with the clinical recognition of the delayed onset of speech (36). Clearly, much research remains to determine what is “abnormal” and what is “normal”, with detailed pathologic correlations with sophisticated measures of cognitive processing and language comprehension in the lateral temporal lobe in a large series of brains at autopsy. It is not yet certain whether gyrification can always be neatly categorized and whether apparent anomalies truly have adverse effects on development, learning, and overall neurological health, or are indicative of individual variant patterns born of different environmental experiences or genius.
ACKNOWLEDGEMENTS
The authors thank Dr Dawna D. Armstrong for critical reading of the manuscript during manuscript preparation. We thank Dr Marco M. Hefti with help in identification of the brains in the early phases of the study.
REFERENCES
- 1. Mesulam MM, Rogalski EJ, Wieneke C, et al. Primary progressive aphasia and the evolving neurology of the language network. Nat Rev Neurol 2014;10:554–69 [DOI] [PMC free article] [PubMed] [Google Scholar]
- 2. Pickles JO. Auditory pathways: anatomy and physiology. Handb Clin Neurol 2015;129:3–25 [DOI] [PubMed] [Google Scholar]
- 3. Mozaffari B. The medial temporal lobe-conduit of parallel connectivity: a model for attention, memory, and perception. Front Integr Neurosci 2014;8:86. [DOI] [PMC free article] [PubMed] [Google Scholar]
- 4. Rauschecker JP. Auditory and visual cortex of primates: a comparison of two sensory systems. Eur J Neurosci 2015;41:579–85 [DOI] [PMC free article] [PubMed] [Google Scholar]
- 5. Collins JA1, Olson IR.. Beyond the FFA: the role of the ventral anterior temporal lobes in face processing. Neuropsychologia 2014;61:65–79 [DOI] [PMC free article] [PubMed] [Google Scholar]
- 6. Clark M, Carr L, Reilly S, et al. Worster-Drought syndrome, a mild tetraplegic perisylvian cerebral palsy. Review of 47 cases. Brain 2000;123:2160–70 [DOI] [PubMed] [Google Scholar]
- 7. Yasuda CL, Guimarães CA, Guerreiro MM, et al. Voxel-based morphometry and intellectual assessment in patients with congenital bilateral perisylvian syndrome. J Neurol 2014;261:1374–80 [DOI] [PubMed] [Google Scholar]
- 8. Naidich TP, Kang E, Girish M, et al. The insula: anatomic study and MR imaging display at 1.5 T. AJNR Am J Neuroradiol 2004;25:222–32 [PMC free article] [PubMed] [Google Scholar]
- 9. Mufson EJ, Mesulam M-M, Pandya DN.. Insular interconnections with the amygdala in the rhesus monkey. Neuroscience 1981;6:1231–48 [DOI] [PubMed] [Google Scholar]
- 10. Craig AD. How do you feel – now? The anterior insula and human awareness. Nat Rev Neurosci 2009;10:59–70 [DOI] [PubMed] [Google Scholar]
- 11. Critchley HD. Neural mechanisms of autonomic, affective, and cognitive integration. J Comp Neurol 2005;493:154–66 [DOI] [PubMed] [Google Scholar]
- 12. Hevner RF. The cerebral cortex malformation in thanatophoric dysplasia: neuropathology and pathogenesis. Acta Neuropathol 2005;110:208–21 [DOI] [PubMed] [Google Scholar]
- 13. Golden JA, Hyman BT.. Development of the superior temporal neocortex is anomalous in trisomy 21. J Neuropathol Exp Neurol 1994;53:513–20 [DOI] [PubMed] [Google Scholar]
- 14. Kinney HC, Poduri AH, Cryan JB, et al. Hippocampal formation maldevelopment and sudden death across the pediatric age spectrum. J Neuropathol Exp Neurol 2016;75:981–97 [DOI] [PMC free article] [PubMed] [Google Scholar]
- 15. Weil AG, Le NM, Jayakar P, et al. Medically resistant pediatric insular-opercular/perisylvian epilepsy. Part 2: Outcome following resective surgery. J Neurosurg Pediatr 2016;18:523–35 [DOI] [PubMed] [Google Scholar]
- 16. Stoos C, Nelsen L, Schissler KA, et al. Fetal alcohol syndrome and secondary schizophrenia: a unique neuropathologic study. J Child Neurol 2014;30:601–5 [DOI] [PMC free article] [PubMed] [Google Scholar]
- 17. Sowell ER, Thompson PM, Mattson SN, et al. Regional brain shape abnormalities persist into adolescence after heavy prenatal alcohol exposure. Cereb Cortex 2002;12:856–65 [DOI] [PubMed] [Google Scholar]
- 18. Macey PM, Sarma MK, Nagarajan R, et al. Obstructive sleep apnea is associated with low GABA and high glutamate in the insular cortex. J Sleep Res 2016;25:390–4 [DOI] [PMC free article] [PubMed] [Google Scholar]
- 19. Bingham PM, Parrish B, Chen SC, et al. Spectrum of disorders associated with enlarged Sylvian fissures in infancy. Neurology 1998;51:1732–5 [DOI] [PubMed] [Google Scholar]
- 20. Sarnat HB, Flores-Sarnat L.. Telencephalic flexure and malformations of the lateral cerebral (Sylvian) fissure. Pediatr Neurol 2016;63:23–38 [DOI] [PubMed] [Google Scholar]
- 21. Barta PE, Pearlson GD, Powers RE, et al. Auditory hallucinations and superior temporal gyral volume in schizophrenia. Am J Psychiatry 1990;147:1457–62 [DOI] [PubMed] [Google Scholar]
- 22. Kesler SR, Vohr B, Schneider KC, et al. Increased temporal lobe gyrification in preterm children. Neuropsychologia 2006;44:445–53 [DOI] [PubMed] [Google Scholar]
- 23. Zhang Y, Inder TE, Neil JJ, et al. Cortical structural abnormalities in very preterm children at 7 years of age. Neuroimage 2015;109:469–79 [DOI] [PMC free article] [PubMed] [Google Scholar]
- 24. Chi JG, Dooling EC, Gilles FH.. Gyral development of the human brain. Ann Neurol 1977;1:86–93 [DOI] [PubMed] [Google Scholar]
- 25. White T, Su S, Schmidt M, et al. The development of gyrification in childhood and adolescence. Brain Cogn 2010;72:36. [DOI] [PMC free article] [PubMed] [Google Scholar]
- 26. Dubois J, Benders M, Cachia A, et al. Mapping the early cortical folding process in the preterm newborn brain. Cereb Cortex 2008;18:1444–54 [DOI] [PubMed] [Google Scholar]
- 27. Dubois J, Benders M, Borradori-Tolsa C, et al. Primary cortical folding in the human newborn: an early marker of later functional development. Brain 2008;131:2028–41 [DOI] [PMC free article] [PubMed] [Google Scholar]
- 28. Li G, Wang L, Shi F, et al. Mapping longitudinal development of local cortical gyrification in infants from birth to two years of age. J Neurosci 2014;34:4228–38 [DOI] [PMC free article] [PubMed] [Google Scholar]
- 29. Chen C, Zimmerman RA, Faro S, et al. MR of the cerebral operculum: abnormal opercular formation in infants and children. AJNR Am J Neuroradiol 1996;17:1303–11 [PMC free article] [PubMed] [Google Scholar]
- 30. Tatum WO, Coker SB, Ghobrial M, et al. The open opercular sign: Diagnosis and significance. Ann Neurol 1989;25:196–9 [DOI] [PubMed] [Google Scholar]
- 31. Armstrong E, Schleicher A, Omran H, et al. The ontogeny of human gyrification. Cereb Cortex 1995;5:56–63 [DOI] [PubMed] [Google Scholar]
- 32. Utsunomiya H, Takano K, Okazaki M, et al. Development of the temporal lobe in infants and children: analysis by MR-based volumetry. AJNR Am J Neuroradiol 1999;20:717–23 [PMC free article] [PubMed] [Google Scholar]
- 33. Hu HH, Guo WY, Chen HY, et al. Morphological regionalization using fetal magnetic resonance images of normal developing brains. Eur J Neurosci 2009;29:1560–7 [DOI] [PubMed] [Google Scholar]
- 34. Battin MR, Maalouf EF, Counsell SJ, et al. Magnetic resonance imaging of the brain in very preterm infants: visualization of the germinal matrix, early myelination, and cortical folding. Pediatrics 1998;101:957–62 [DOI] [PubMed] [Google Scholar]
- 35. Van der Knaap MS, van Wezel-Meijler G, Barth PG, et al. Normal gyrification and sulcation in preterm and term neonates: appearance on MR images. Radiology 1996;200:389–96 [DOI] [PubMed] [Google Scholar]
- 36. Sun T, Hevner RF.. Growth and folding of the mammalian cerebral cortex: from molecules to malformations. Nat Rev Neurosci 2014;15:217–32 [DOI] [PMC free article] [PubMed] [Google Scholar]
- 37. Fernandez V, Llinares-Benadero C, Borell V.. Cerebral cortex expansion and folding: what have we learned? Embo J 2016;35:1021–44 [DOI] [PMC free article] [PubMed] [Google Scholar]
- 38. Murre JM, Sturdy DP.. The connectivity of the brain: multi-level quantitative analysis. Biol Cybern 1995;73:529–45 [DOI] [PubMed] [Google Scholar]
- 39. Wen Q, Chklovkii DB.. Segregation of the brain into gray and white matter: a design minimizing conduction delays. PLoS Comput Biol 2005;1:e78. [DOI] [PMC free article] [PubMed] [Google Scholar]
- 40. Naidich TP, Grant JL, Altman N, et al. The developing cerebral surface. Preliminary report on the patterns of sulcal and gyral maturation – anatomy, ultrasound, and magnetic resonance imaging. Neuroimag Clin N Am 1994;4:201–40 [PubMed] [Google Scholar]
- 41. Zilles K, Armstrong E, Schleicher A, et al. The human pattern of gyrification in the cerebral cortex. Anat Embryol 1988;179:173–9 [DOI] [PubMed] [Google Scholar]
- 42. Blanton RE, Levitt JG, Thompson PM, et al. Mapping cortical asymmetry and complexity patterns in normal children. Psychiatry Res 2001;107:29–43 [DOI] [PubMed] [Google Scholar]
- 43. Huttenlocher PR. Synaptic density in human frontal cortex – developmental changes and effects of aging. Brain Res 1979;163:195–205 [DOI] [PubMed] [Google Scholar]
- 44. Geschwind N, Levetsky W.. Left/right asymmetries in temporal lobe region. Science 1968;161:186–7 [DOI] [PubMed] [Google Scholar]


