

Abstract
Background
Reliance on self-reported dietary intake methods is a commonly cited research limitation, and dietary misreporting is a particular problem in children and adolescents. Objective indicators of dietary intake, such as dietary biomarkers, are needed to overcome this research limitation. The added sugar (AS) biomarker δ13C, which measures the relative abundance of 13C to 12C, has demonstrated preliminary validity in adults.
Objective
The purpose of this investigation was to determine the comparative validity, test-retest reliability, and sensitivity of the δ13C biomarker to detect AS and sugar-sweetened beverage (SSB) intake using fingerstick blood samples in children and adolescents.
Methods
Children (aged 6–11 y, n = 126, 56% male, mean ± SD age: 9 ± 2 y) and adolescents (aged 12–18 y, n = 200, 44% male, mean ± SD age: 15 ± 2 y) completed 4 testing sessions within a 3-wk period. Participants’ height, weight, demographic characteristics, and health history were determined at the first session; 24-h recalls were obtained at each visit and fingerstick blood samples were collected at visits 1 and 3. Samples were analyzed for δ13C value using natural abundance stable isotope mass spectrometry. δ13C value was compared with dietary outcomes in the full sample, and in child and adolescent subgroups. t Tests and correlational analyses were used to assess biomarker validity and reliability, whereas logistic regression and area under the receiver-operator characteristic curve (AUC) were used to evaluate sensitivity.
Results
Reported mean ± SD AS consumption was 82.2 ± 35.8 g/d and 329 ± 143 kcal/d, and SSB consumption was 222 ± 243 mL/d and 98 ± 103 kcal/d. Mean δ13C value was –19.65 ± 0.69‰, and was lower in children than in adolescents (–19.80 ± 0.67‰ compared with –19.56 ± 0.67‰, P = 0.002). δ13C values were similar across sessions (visit 1: –19.66 ± 0.68‰; visit 3: –19.64 ± 0.68‰; r = 0.99, P < 0.001) and were associated (P < 0.001) with intake of total AS (grams, kilocalories: r = 0.29) and SSB (milliliters, kilocalories: r = 0.35). The biomarker was able to better discriminate between high and low SSB consumers than high and low AS consumers, as demonstrated by the AUC (0.75 and 0.62, respectively).
Conclusions
The δ13C biomarker is a promising, minimally invasive, objective biomarker of SSB intake in children and adolescents. Further evaluation using controlled feeding designs is warranted. Registered at clinicaltrials.gov as NCT02455388.
Keywords: dietary assessment, obesity, sugar-sweetened beverages, children and adolescents, corn and cane sugar, added sugar
Introduction
Childhood obesity has become a major public health concern, with 17% of children and adolescents (in the US) now considered obese (1). Excessive consumption of added sugar (AS) has been suggested as a contributor to this public health problem (2–5). Despite recommendations from major health organizations (6–8), children and adolescents consume AS in excess of the 10% intake level currently recommended (9), with children consuming ∼16% of their total calories from AS (7). Sugar-sweetened beverages (SSBs) represent the primary source of AS, accounting for 8% of total caloric intake (10). Excessive AS intake, particularly in the form of SSBs, has demonstrated an association with obesity (11, 12). High AS consumption is also associated with an increased risk for dental caries (13), chronic diseases such as diabetes, hypertension, ischemic heart disease and stroke (6, 14, 15), stunted growth and development (9), and an inadequate micronutrient intake (8, 9, 16, 17).
Although research findings have suggested a relation between AS and SSB intake and several chronic diseases (6, 14, 15, 18–22), a causal relation is difficult to determine due to the limitations of self-reported dietary assessment methodologies (23). Misreporting is more pronounced in younger populations who may have difficulty estimating portion sizes, conceptualizing foods, understanding food preparation, and recalling all foods and beverages consumed (23–25). Furthermore, it is common for people of all ages to underreport foods deemed socially undesirable (e.g., sugar-rich foods) and those that are consumed as snacks (25), which makes the relation between dietary intake and disease prevention or progression challenging to assess. The Institute of Medicine and others have highlighted the need to develop and validate dietary biomarkers in order to objectively assess dietary intake (26, 27). Currently, there are no validated predictive dietary biomarkers of AS intake in children and adolescents—a population that consumes even greater amounts of AS than adults (28).
Naturally occurring variations in stable isotope ratios, including 13C:12C (reported as δ13C), have been used as objective measures of diet in modern humans (29–34). The δ13C value of a given plant sugar reflects the biochemical pathways used by the plant during photosynthesis. “C4” plants, such as corn and sugar cane, give rise to sugar with high δ13C value, while “C3” plants, which include the majority of fruits and vegetables, give rise to sugars with much lower δ13C values (33, 38). Therefore, the consumption of corn and cane sugars and their derivatives is reflected in the δ13C value of adult human tissues using a variety of biological sample types, including a minimally invasive fingerstick blood sample (29, 35). The δ13C AS biomarker has demonstrated promising preliminary evidence of validity and reliability in adults (26, 29, 31–33, 35). However, tissue turnover times may vary according to growth stage, which could impact biomarker values (35, 36). Thus, the purpose of this investigation was to determine the comparative validity and test-retest reliability of the δ13C biomarker of AS intake, particularly in the form of SSBs, using fingerstick blood samples in children and adolescents aged 6–18 y.
Methods
Subjects
Three-hundred sixty-four children (aged 6–11 y) and adolescents (aged 12–18 y) were screened online from a local university community in southwestern Virginia, between January 2014 and September 2015. Three-hundred twenty-six children and adolescents completed all study sessions (90% completion rate). Interested participants were enrolled in the study following parental consent and if they met eligibility criteria, as follows: aged 6–18 y; can read, write, and speak English; and willing to comply with all study procedures. Study participation required the completion of 4 laboratory sessions within a 3-wk period (Figure 1). Study sessions were primarily scheduled in the early afternoon to early evening period (i.e., 1500–1900), on days that would allow the dietary recalls to reflect 3 weekdays and 1 weekend day, on nonconsecutive days. The Virginia Tech Institutional Review Board approved the study protocol. This investigation is registered at clinical trials.gov as NCT02455388.
FIGURE 1.
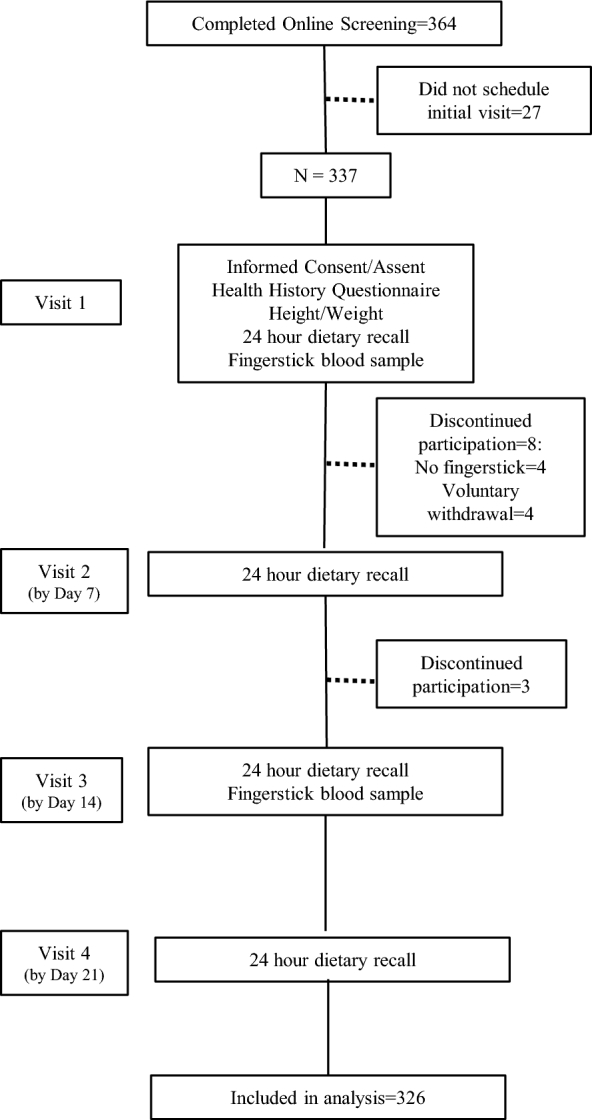
Recruitment and procedures for a cross-sectional study assessing the reliability, validity, and sensitivity of the δ 13C biomarker of added sugar intake in children and adolescents.
Procedures
Following parental consent and participant assent, a health history questionnaire was administered to gather information regarding participants’ age, race, ethnicity, medical conditions, and medication use. Height was measured in meters without shoes using a wall-mounted stadiometer, and weight was measured in light street clothing without shoes to the nearest 0.1 kg (Scale Tronix 5002; Carol Stream, IL); values were used to calculate BMI and BMI percentile (37); BMI percentile was used to categorize the weight status of participants. Resting energy expenditure (REE) (38) was calculated to identify potential underreporters. Participants were classified as underreporters if their reported total caloric intake was <80% of their estimated REE.
At each session, a record-assisted 24-h dietary recall (24-HR) was administered by a trained research assistant using the multiple-pass method; visual aids, including food diagrams and food models, were used. The four 24-HRs were obtained on nonconsecutive days, including 1 weekend day, in a manner consistent with NHANES methodology (24, 25, 39). However, all participants were encouraged to have an adult present to aid in completing the 24-HR. The 24-HRs were analyzed with the use of NDS-R (Nutrition Data System for Research 2013; University of Minnesota, Minneapolis, MN) to quantify dietary intake variables using a 4-d average, including usual AS and SSB intake.
Non-fasting fingerstick blood samples were obtained at 2 of the 4 visits (visits 1 and 3; Figure 1) via routine fingersticks (One Touch Fine Point Lancet; Johnson & Johnson Company). Blood samples were blotted onto sterilized, binder-free glass microfiber filters (Whatman type GF/D, 2.5-cm diameter; Whatman, Inc.) and air-dried. Blood samples were analyzed in triplicate for δ13C value via natural abundance stable isotope mass spectrometry (Isoprime; Micromass UK Ltd), as described previously (29). δ15N values, measuring the relative abundance of 15N to 14N, were also determined and evaluated as possible covariates to control for the potential confounders of meat (i.e., livestock consuming corn feed) consumption on δ13C values (32, 40). Total variability across the 3 measurements was within 0.04‰.
Statistical methods
Statistical analyses were performed using statistical analysis software (Medcalc 17.8, STATA 14, SPSS 22). Descriptive statistics (mean ± SD) are reported for participant demographic characteristics and dietary intake variables [total kilocalories, total dietary AS (grams, kilocalories), and total SSBs (milliliters, kilocalories)]. Paired-sample t tests, independent-sample t tests, chi-square tests and one-factor ANOVA were used to evaluate differences within and between assessment methods and group differences. Test-retest reliability (i.e., δ13C values obtained at the 2 laboratory visits) was assessed using the intraclass correlation coefficient (ICC), and a Pearson correlation coefficient between δ13C values and reported dietary AS intake evaluated comparative validity. Lastly, binary logistic regression analyses and non-parametric receiver operator curves (ROCs) were used to evaluate the diagnostic value of δ13C biomarker using the fingerstick blood. Participant AS and SSB intakes based on 24-HR recalls were dichotomized into high and low subgroups; participants were characterized as high AS consumers if their AS consumption (kilocalories) constituted >20% of total calories (i.e., twice the recommended 10% of total kilocalories) and as high SSB consumers if their SSB intake (kilocalories) was >128 kcal/d (twice the recommended intake suggested by the American Heart Association) (9, 41). The area under the ROC (AUC) was used as a measure for the diagnostic accuracy of the δ13C biomarker, with values closer to 1.0 indicating greater ability to distinguish between low and high AS and SSB consumers. Logistic regression analyses were performed separately for gender and for the age groups of children (aged 6–11 y) and adolescents (aged 12–18 y). The variability in ROC AUC was assessed to ensure that the difference in the AUC was not significantly different. ROC analyses were evaluated with and without potential covariates (BMI, δ15N, age, and gender).
Results
Participant demographic characteristics, dietary intake, and biomarker values are presented in Table 1. The sample (n = 326) was balanced with regard to sex (49% males, 51% females), while 93% of participants considered themselves white (2% were Asian, 1% were African American, and 1% were other) and non-Hispanic (93%). Age ranged from 6 to 18 y (mean age: 12 ± 3 y). The sample comprised 126 participants who were children (aged 6–11 y; 44% girls) and 200 participants who were adolescents (aged 12–18 y; 56% female). Mean BMI was in the normal range with most participants categorized between the 5th and 85th percentile. Age group differences were noted between the percentage of children and adolescents classified as underweight and obese (P < 0.05). As expected, adolescents had greater REE and reported energy intake than did children. Approximately 12% of the sample were classified as underreporters; however, reliability (r = 0.992, P < 0.001) and validity (AS g/d, kcal/d: r = 0.23, P < 0.001; SSB mL/d: r = 0.35, P < 0.001 and SSB kcal/d: r = 0.35, P < 0.001) results were not different after excluding potential underreporters.
TABLE 1.
Participant characteristics of the full sample and among children and adolescent subgroups in a study evaluating the validity and reliability of the δ13C value of fingerstick blood as a biomarker of added sugar intake1
| Participant | Total | Children | Adolescents |
|---|---|---|---|
| characteristics | sample | (6–11 y) | (12–18 y) |
| Total number of participants, n | 326 | 126 | 200 |
| Male, n (%) | 159 (49) | 71 (56) | 88 (44)* |
| Female, n (%) | 167 (51) | 55 (44) | 112 (56)* |
| Age, y | 12 ± 3 | 9 ± 2 | 15 ± 2 |
| BMI status, n (%) | |||
| Underweight (<5th percentile) | 12 (4) | 9 (7) | 3 (2)* |
| Normal weight (5th to <85th percentile) | 254 (78) | 101 (80) | 153 (77) |
| Overweight (85th to <95th percentile) | 35 (11) | 11 (9) | 24 (12) |
| Obese (≥95th percentile) | 25 (8) | 5 (4) | 20 (10)* |
| BMI, kg/m2 | 20.0 ± 4.5 | 17.0 ± 2.8 | 21.8 ± 4.4* |
| BMI-for-age, percentiles | 56.1 ± 27.9 | 49.6 ± 28.4 | 60.1 ± 26.8* |
| Resting energy expenditure, kcal/d | 1891 ± 472 | 1736 ± 412 | 1992 ± 485* |
| Reported energy intake, kcal/d | 2063 ± 552 | 1862 ± 418 | 2190 ± 588* |
| δ13C, ‰ | –19.65 ± 0.69 | –19.80 ± 0.67 | –19.56 ± 0.67* |
| Added sugar | |||
| g/d | 82.2 ± 35.8 | 73.2 ± 28.1 | 87.8 ± 38.9* |
| kcal/d | 329 ± 143 | 293 ± 112 | 351 ± 155* |
| Sugar-sweetened beverage | |||
| mL/d | 222 ± 243 | 177 ± 210 | 251 ± 254* |
| kcal/d | 98 ± 103 | 79 ± 88 | 110 ± 110* |
1Values are means + SDs unless otherwise indicated. Chi-square tests were used to compare proportions across groups; independent-sample t tests were used to compare age group means; BMI-for-age percentiles were calculated according to CDC standards (37); resting energy expenditure was calculated based upon data from the Institute of Medicine (38); reported energy intake was the average energy intake from the four 24-h dietary recalls. *Different from children, P < 0.05.
Among children and adolescents in this sample, reported total daily AS intake was similar to the mean intake of AS by persons >2 y (83.9 g, 336 kcal/d) in the United States (8, 42). AS and SSB intakes were significantly different between children and adolescents (P < 0.001), with children reporting a lower consumption than adolescents.
Mean δ13C values at visits 1 and 3, respectively, were –19.66 ± 0.68‰ (range –22.26‰ to –17.79‰) and –19.64 ± 0.68‰ (range –22.39‰ to –17.84‰). Biomarker measurements were strongly correlated across the 2 visits (ICC = 0.99, P < 0.001) and for subsequent analyses the δ13C value at visit 1 was used. (Note: the following results do not differ when using the visit 2 δ13C value, or the average of the 2 measures.) The δ13C values differed between children and adolescents with lower values noted in children (i.e., farther from zero, reflecting a lower AS and SSB intake), which is consistent with self-reported AS and SSB intake. In the full sample, significant differences in δ13C value were noted between normal weight and obese participants (mean difference = –0.551‰, P < 0.001), but not between normal weight and overweight participants (mean difference = –0.196‰, P = 0.11) or by gender (mean difference = 0.112‰, P = 0.14).
Significant correlations were noted between δ13C values and self-reported dietary variables including: total AS grams per day and kilocalories per day (r = 0.23, P < 0.001), SSB milliliters per day (r = 0.35, P < 0.001) and kilocalories per day (r = 0.35, P < 0.001). Scatterplots (Figure 2) show that δ13C was significantly higher in the high AS and high SSB consumers. δ13C value was correlated (P < 0.01) with BMI (r = 0.28), δ15N (r = 0.63), and age (r = 0.17), and only marginally with gender (P = 0.07). After controlling for BMI, δ15N, and age, all differences in δ13C values between high and low AS and SSB consumers were maintained.
FIGURE 2.

δ13C values of fingerstick blood in children and adolescents with low and high SSB (A) and AS (B) intakes. Values are significantly higher in the high-SSB (high, n = 98; low, n = 228) and high-AS (high, n = 82; low, n = 244) consumers. **Means differ, P < 0.01. After controlling for age, BMI, and δ15N (‰), these differences were maintained, P < 0.01. AS, added sugar; SSB, sugar-sweetened beverage.
δ13C discriminated low SSB consumers from high consumers with a sensitivity of 52% and a specificity of 77% (at a cut-off of >–19.31‰; AUC = 0.70, SE = 0.03). Binary logistic regression with block entry using BMI, δ15N and gender provided a model [Model 1: 26.91 + (1.20 × δ13C) + (0.09 × BMI) – (0.65 × δ15N) – (0.74 × gender)] that significantly improved the ability to distinguish low from high SSB consumers with a specificity of 84% and a sensitivity of 60% (at a cut-off of >–19.51‰; AUC = 0.75, SE = 0.03; ROC AUC comparison: P < 0.01; see Table 2). Adding age to the above model did not improve the discrimination between high and low SSB consumers (AUC = 0.75). δ13C discriminated low AS consumers from high AS consumers with a sensitivity of 83% and a specificity of 38% (at a cut-off of >–19.85‰; AUC = 0.62, SE = 0.03). Adding BMI, δ15N, gender, and age did not improve the discrimination between high and low AS consumers (AUC = 0.61). The discrimination capability of δ13C was not significantly different between children and adolescents, or between males and females.
TABLE 2.
AUC for the associations between AS and SSB intake with δ13C in children and adolescents1
| AS (AUC) | SSB (AUC) | |
|---|---|---|
| Full sample | 0.61 ± 0.03 | 0.75 ± 0.03 |
| Gender | ||
| Male (n = 159) | 0.59 ± 0.05 | 0.76 ± 0.04 |
| Female (n = 167) | 0.64 ± 0.05 | 0.68 ± 0.05 |
| Age group | ||
| Children (n = 126) | 0.70 ± 0.06 | 0.78 ± 0.05 |
| Adolescents (n = 200) | 0.60 ± 0.05 | 0.74 ± 0.04 |
1All values are means ± SEs. Analyses for the full sample and age groups adjusted for δ15N, BMI and gender; analyses by gender adjusted for δ 15N, BMI and age. AS, added sugar; SSB, sugar-sweetened beverage.
Discussion
Our findings represent the first investigation to evaluate the validity, reliability, and sensitivity of the δ13C AS biomarker using fingerstick blood samples in children and adolescents. Only one prior investigation has evaluated the δ13C biomarker in youth, using hair samples from 51 children in the Alaskan native Yup'ik population (43). That investigation did not include a direct assessment of dietary intake, but used δ13C values from hair samples to demonstrate associations between biomarker-based estimates of AS intake with carious tooth surfaces. In the present investigation, the biomarker demonstrated strong test-retest reliability, similar to findings from previous investigations (29, 32). The δ13C biomarker demonstrated comparative validity as it was moderately correlated with AS intake, expressed in g and kcal, and SSB intake, expressed in mL and kcal. The association between δ13C and SSB intake was stronger than when compared with AS intake, consistent with the literature (29, 32–44). This is likely explained by SSBs being comprised of 99% corn and cane sweeteners (36), while AS could be derived from a wider variety of sugar sources (i.e., C4 or C3 plants) (35). This may also explain the ROC results, which indicated that the biomarker was able to better discriminate between high and low SSB consumers than high and low AS consumers. While the δ13C biomarker can be useful for identifying high and low AS and SSB consumers, the AUC for these variables was within the acceptable range (0.7–0.9) (45) for SSB but not for AS. In part, this could be attributed to the use of self-reported dietary data, which may underestimate biomarker validity due to both dietary underreporting and the variability in self-reported intake (46). Therefore, this technique merits further investigation using controlled feeding study designs in children and adolescents, given its potential to contribute to the investigations of the health consequences of AS and SSB intake (6, 8, 9, 13–16, 43, 47, 48).
The current investigation reported mean intakes of SSB intake for children (79 kcal/d) and adolescents (110 kcal/d) that were below the current estimates of 129 and 350 kcal/d from SSBs alone for children and adolescents, respectively, determined using a single 24-HR, in the United States (2). Johnson et al. (8) found that the mean AS intake, using two 24-HRs, for children aged 4–8 y was ∼336 kcal/d while adolescent males and females reported much higher intakes (467 and 371 kcal/d, respectively); our results are consistent with the current literature, indicating that our sample is generalizable with respect to AS and SSB intake in children. These estimates of AS and SSB intake far exceed recommendations made by the Dietary Guidelines for Americans (9), the American Heart Association (8, 41), and the WHO (6).
Strengths of this investigation include a large sample size (n = 326) with a wide age range (6–18 y). The approach used also allowed us to evaluate differences in dietary intake and biomarker values between children and adolescents. Utilizing fingerstick blood samples minimized the degree of invasiveness, which is a commonly cited limitation of biochemical data collection, particularly among children, and no adverse effects were reported.
We acknowledge several limitations in our study. Despite a large sample size, there was a lack of racial and ethnic diversity in our sample; minority populations are more likely to consume SSBs than their white counterparts (2). Pubertal status was not assessed; however, this was addressed by dichotomizing the sample into child and adolescent subgroups, which did not present any significant differences in AUC values. The δ13C biomarker is limited to assessing intake of sugar from C4 plants, which demonstrate a conspicuously high δ13C value (30, 34, 35). Although ∼75% of high AS foods carry the C4 signature in their carbon isotope composition (35, 36), there are a few other sweeteners with a C3 signature, including beet sugar, honey, and maple syrup, that can be used in products. However, these comprise the minority of AS used in the United States (35). Furthermore, the δ13C value in whole blood cannot distinguish between corn consumption and corn-derivative consumption (33, 35, 49). However, we and others have reported no significant differences in the relation between δ13C and SSB consumption when using corn consumption as a covariate (40, 44). An additional complication may be livestock fed corn products, which are then ingested as meat. To address this, the δ15N value was tested as a covariate to control for meat intake using methods proposed elsewhere (31, 32, 50). However for this study, the addition of δ15N did not enhance the ability of δ13C values to predict AS intake, as was previously seen in populations of mostly white US residents (40). The limitations of self-reported dietary assessment methodologies, including misreporting, are also acknowledged (23). Lastly, these results only apply to the timeframe studied (i.e., 3 wk). Longer-term studies are needed to determine whether the δ13C value assessed in fingerstick blood is a valid indicator of AS and SSB intake in children and adolescents over the course of ≥1 mo.
In conclusion, the δ13C biomarker holds promise as a minimally invasive, objective indicator of AS and SSB intake in children and adolescents. This biomarker has the potential to overcome limitations posed by self-reported dietary data that may aid in discovering consistent and causal relations between AS and SSB intake and health (26, 29, 35, 51). Further research is warranted using a controlled feeding study design, where AS intake and/or SSB intake is manipulated. This approach could also determine the dose-response relations between δ13C values and AS and SSB intake (52), which could potentially be translated into clinically relevant thresholds to objectively characterize the AS and SSB consumption of children and adolescents. As MS technology advances to include portable, lower-cost mass spectrometers (53), a valid stable isotope biomarker of AS and SSB intake could have substantial public health impact both for research and clinical practice.
Acknowledgments
The authors’ responsibilities were as follows—BMD, AHJ, JS, VEH, HAR, MIF, and JCD: designed the research; CRM, CEH, and SKR: conducted the research; BMD and AHJ: provided essential materials; CRM, BMD, and JS: analyzed the data; and all authors: wrote the paper and read and approved the final manuscript.
Funding for this project was provided by NIH R21 HD078636 (to BMD); Virginia Tech Fralin Translational Obesity Research Center; Virginia Tech Institute for Society, Culture and Environment.
Author disclosures: CRM, CEH, AHR, JS, SKR, VEH, HAR, JCD, MIF, and BMD, no conflicts of interest.
Abbreviations used
- AS
added sugar
- ICC
intraclass correlation coefficient
- REE
resting energy expenditure
- ROC
receiver operating curve
- SSB
sugar-sweetened beverage
- 24-HR
24-h dietary recall
References
- 1. Ogden CL, Carroll MD, Lawman HG, Fryar CD, Kruszon-Moran D, Kit BK. Trends in obesity prevalence among children and adolescents in the United States, 1988–1994 through 2013–2014. JAMA 2016;315:2292–9. [DOI] [PMC free article] [PubMed] [Google Scholar]
- 2. Han E, Powell LM. Consumption patterns of sugar-sweetened beverages in the United States. J Acad Nutr Diet 2013;113:43–53. [DOI] [PMC free article] [PubMed] [Google Scholar]
- 3. Welsh JA, Sharma A, Cunningham SA, Vos MB. Consumption of added sugars and indicators of cardiovascular disease risk among US adolescents. Circulation 2011;123:249–57. [DOI] [PMC free article] [PubMed] [Google Scholar]
- 4. Piernas C, Popkin BM. Increased portion sizes from energy-dense foods affect total energy intake at eating occasions in US children and adolescents: patterns and trends by age group and sociodemographic characteristics, 1977–2006. Am J Clin Nutr 2011;94:1324–32. [DOI] [PMC free article] [PubMed] [Google Scholar]
- 5. Krebs-Smith SM, Guenther PM, Subar AF, Kirkpatrick SI, Dodd KW. Sugar-sweetened carbonated beverage consumption correlates with BMI, waist circumference, and poor dietary choices in school children. J Nutr 2010;140:1832–8. [DOI] [PMC free article] [PubMed] [Google Scholar]
- 6. WHO Diet, nutrition and the prevention of chronic diseases. World Health Organ Tech Rep Ser 2003;916:i–viii, 1–149, backcover. [PubMed] [Google Scholar]
- 7. Ervin RB, Kit BK, Carroll MD, Ogden CL. Consumption of added sugar among U.S. children and adolescents, 2005–2008. NCHS Data Brief 2012:1–8. [PubMed] [Google Scholar]
- 8. Johnson RK, Appel LJ, Brands M, Howard BV, Lefevre M, Lustig RH, Sacks F, Steffen LM, Wylie-Rosett J, American Heart Association Nutrition Committee of the Council on Nutrition, Physical Activity, and Metabolism and the Council on Epidemioloyg and Prevention Dietary sugars intake and cardiovascular health: a scientific statement from the American Heart Association. Circulation 2009;120:1011–20. [DOI] [PubMed] [Google Scholar]
- 9. United States Department of Health and Human Services, United States Department of Agriculture 2015–2020 dietary guidelines for Americans. 8th ed.Washington, DC: US Government Printing Office; 2015. [Google Scholar]
- 10. Kit BK, Fakhouri TH, Park S, Nielsen SJ, Ogden CL. Trends in sugar-sweetened beverage consumption among youth and adults in the United States: 1999–2010. Am J Clin Nutr 2013;98:180–8. [DOI] [PMC free article] [PubMed] [Google Scholar]
- 11. Bray GA, Nielsen SJ, Popkin BM. Consumption of high-fructose corn syrup in beverages may play a role in the epidemic of obesity. Am J Clin Nutr 2004;79:537–43. [DOI] [PubMed] [Google Scholar]
- 12. Vartanian LR, Schwartz MB, Brownell KD. Effects of soft drink consumption on nutrition and health: a systematic review and meta-analysis. Am J Public Health 2007;97:667–75. [DOI] [PMC free article] [PubMed] [Google Scholar]
- 13. Academy of Nutrition and Dietetics Position of the Academy of Nutrition and Dietetics: oral health and nutrition. J Acad Nutr Diet 2013;113:693–701. [DOI] [PubMed] [Google Scholar]
- 14. Fried SK, Rao SP. Sugars, hypertriglyceridemia, and cardiovascular disease. Am J Clin Nutr 2003;78:S873S–80. [DOI] [PubMed] [Google Scholar]
- 15. Kell KP, Cardel MI, Bohan Brown MM, Fernandez JR. Added sugars in the diet are positively associated with diastolic blood pressure and triglycerides in children. Am J Clin Nutr 2014;100:46–52. [DOI] [PMC free article] [PubMed] [Google Scholar]
- 16. Bowman SA. Beverage choices of young females: changes and impact on nutrient intakes. J Am Diet Assoc 2002;102:1234–9. [DOI] [PubMed] [Google Scholar]
- 17. Marriott BP, Olsho L, Hadden L, Connor P. Intake of added sugars and selected nutrients in the United States, National Health and Nutrition Examination Survey (NHANES) 2003–2006. Crit Rev Food Sci Nutr 2010;50:228–58. [DOI] [PubMed] [Google Scholar]
- 18. Havel PJ. Dietary fructose: implications for dysregulation of energy homeostasis and lipid/carbohydrate metabolism. Nutr Rev 2005;63:133–57. [DOI] [PubMed] [Google Scholar]
- 19. Elliott SS, Keim NL, Stern JS, Teff K, Havel PJ. Fructose, weight gain, and the insulin resistance syndrome. Am J Clin Nutr 2002;76:911–22. [DOI] [PubMed] [Google Scholar]
- 20. Gross LS, Li L, Ford ES, Liu S. Increased consumption of refined carbohydrates and the epidemic of type 2 diabetes in the United States: an ecologic assessment. Am J Clin Nutr 2004;79:774–9. [DOI] [PubMed] [Google Scholar]
- 21. Le KA, Tappy L. Metabolic effects of fructose. Curr Opin Clin Nutr Metab Care 2006;9:469–75. [DOI] [PubMed] [Google Scholar]
- 22. Thomson CA, Giuliano A, Rock CL, Ritenbaugh CK, Flatt SW, Faerber S, Newman V, Caan B, Graver E, Hartz V, et al. Measuring dietary change in a diet intervention trial: comparing food frequency questionnaire and dietary recalls. Am J Epidemiol 2003;157:754–62. [DOI] [PubMed] [Google Scholar]
- 23. Magarey A, Watson J, Golley RK, Burrows T, Sutherland R, McNaughton SA, Denney-Wilson E, Campbell K, Collins C. Assessing dietary intake in children and adolescents: Considerations and recommendations for obesity research. Int J Pediatr Obes 2011;6:2–11. [DOI] [PubMed] [Google Scholar]
- 24. Livingstone MB, Robson PJ. Measurement of dietary intake in children. Proc Nutr Soc 2000;59:279–93. [DOI] [PubMed] [Google Scholar]
- 25. Livingstone MB, Robson PJ, Wallace JM. Issues in dietary intake assessment of children and adolescents. Br J Nutr 2004;92 Suppl 2:S213–22. [DOI] [PubMed] [Google Scholar]
- 26. Hedrick VE, Dietrich AM, Estabrooks PA, Savla J, Serrano E, Davy BM. Dietary biomarkers: advances, limitations and future directions. Nutr J 2012;11:109. [DOI] [PMC free article] [PubMed] [Google Scholar]
- 27. Institute of Medicine of the National Academies Dietary reference intakes: research synthesis workshop summary. Washington, DC: National Academies Press; 2007. [Google Scholar]
- 28. Ervin RB, Ogden CL. Consumption of added sugars among U.S. adults, 2005–2010. NCHS Data Brief 2013:1–8. [PubMed] [Google Scholar]
- 29. Davy BM, Jahren AH, Hedrick VE, Comber DL. Association of delta(1)(3)C in fingerstick blood with added-sugar and sugar-sweetened beverage intake. J Am Diet Assoc 2011;111:874–8. [DOI] [PMC free article] [PubMed] [Google Scholar]
- 30. Jahren AH, Kraft RA. Carbon and nitrogen stable isotopes in fast food: signatures of corn and confinement. Proc Natl Acad Sci U S A 2008;105:17855–60. [DOI] [PMC free article] [PubMed] [Google Scholar]
- 31. Nash SH, Bersamin A, Kristal AR, Hopkins SE, Church RS, Pasker RL, Luick BR, Mohatt GV, Boyer BB, O’Brien DM. Stable nitrogen and carbon isotope ratios indicate traditional and market food intake in an indigenous circumpolar population. J Nutr 2012;142:84–90. [DOI] [PMC free article] [PubMed] [Google Scholar]
- 32. Nash SH, Kristal AR, Bersamin A, Hopkins SE, Boyer BB, O’Brien DM. Carbon and nitrogen stable isotope ratios predict intake of sweeteners in a Yup’ik study population. J Nutr 2013;143:161–5. [DOI] [PMC free article] [PubMed] [Google Scholar]
- 33. Yeung EH, Saudek CD, Jahren AH, Kao WH, Islas M, Kraft R, Coresh J, Anderson CA. Evaluation of a novel isotope biomarker for dietary consumption of sweets. Am J Epidemiol 2010;172:1045–52. [DOI] [PMC free article] [PubMed] [Google Scholar]
- 34. Jahren AH, Saudek C, Yeung EH, Kao WH, Kraft RA, Caballero B. An isotopic method for quantifying sweeteners derived from corn and sugar cane. Am J Clin Nutr 2006;84:1380–4. [DOI] [PubMed] [Google Scholar]
- 35. Jahren AH, Bostic JN, Davy BM. The potential for a carbon stable isotope biomarker of dietary sugar intake. J Anal At Spectrom 2014;29:795–816. [Google Scholar]
- 36. O’Brien DM. Stable isotope ratios as biomarkers of diet for health research. Annu Rev Nutr 2015;35:565–94. [DOI] [PMC free article] [PubMed] [Google Scholar]
- 37. Center for Disease Control and Prevention, National Center for Health Statistics. Growth charts2009. [Google Scholar]
- 38. Institute of Medicine Dietary reference intakes for energy, carbohydrate, fiber, fat, fatty acids, cholesterol, protein and amino acids (macronutrients). Washington, DC: National Academies Press; 2005. [Google Scholar]
- 39. Center for Disease Control and Prevention National Health and Nutrition Examination Survey (NHANES) MEC in-person dietary interviewers procedures manual. 2008. [Google Scholar]
- 40. Hedrick VE, Zoellner JM, Jahren AH, Woodford NA, Bostic JN, Davy BM. A dual-carbon-and-nitrogen stable isotope ratio model is not superior to a single-carbon stable isotope ratio model for predicting added sugar intake in southwest Virginian adults. J Nutr 2015;145:1362–9. [DOI] [PMC free article] [PubMed] [Google Scholar]
- 41. American Heart Association Life's simple 7: eat better. 2014.
- 42. Huth PJ, Fulgoni VL, Keast DR, Park K, Auestad N. Major food sources of calories, added sugars, and saturated fat and their contribution to essential nutrient intakes in the U.S. diet: data from the National Health and Nutrition Examination Survey (2003-2006). Nutr J 2013;12:116. [DOI] [PMC free article] [PubMed] [Google Scholar]
- 43. Chi D, Hopkins S, O’Brien D, Mancl L, Orr E, Lenaker D. Association between added sugar intake and dental caries in Yup’ik children using a novel hair biomarker. BMC Oral Health 2015;15. [DOI] [PMC free article] [PubMed] [Google Scholar]
- 44. Fakhouri TH, Jahren AH, Appel LJ, Chen L, Alavi R, Anderson CA. Serum carbon isotope values change in adults in response to changes in sugar-sweetened beverage intake. J Nutr 2014;144:902–5. [DOI] [PMC free article] [PubMed] [Google Scholar]
- 45. Hajian-Tilaki K. Receiver operating characteristic (ROC) curve analysis for medical diagnostic test evaluation. Caspian J Intern Med 2013;4:627–35. [PMC free article] [PubMed] [Google Scholar]
- 46. Willett W, Lenart E. Nutritional epidemiology. 2nd ed.New York: Oxford University Press; 1998. [Google Scholar]
- 47. Lingstrom P, van Houte J, Kashket S. Food starches and dental caries. Crit Rev Oral Biol Med 2000;11:366–80. [DOI] [PubMed] [Google Scholar]
- 48. Pollard M. Potential cariogenicity of starches and fruits as assessed by plaque-sampling method and an intraoral cariogenicity test. Caries Res 1995;29:68–74. [DOI] [PubMed] [Google Scholar]
- 49. Cook CM, Alvig AL, Liu YQ, Schoeller DA. The natural 13C abundance of plasma glucose is a useful biomarker of recent dietary caloric sweetener intake. J Nutr 2010;140:333–7. [DOI] [PubMed] [Google Scholar]
- 50. Kuhnle GG, Joosen AM, Kneale CJ, O’Connell TC. Carbon and nitrogen isotopic ratios of urine and faeces as novel nutritional biomarkers of meat and fish intake. Eur J Nutr 2013;52:389–95. [DOI] [PMC free article] [PubMed] [Google Scholar]
- 51. Thompson FE, Subar AF, Loria CM, Reedy JL, Baranowski T. Need for technological innovation in dietary assessment. J Am Diet Assoc 2010;110:48–51. [DOI] [PMC free article] [PubMed] [Google Scholar]
- 52. O’Brien DM. Stable isotope ratios as biomarkers of diet for health research. Annu Rev Nutr 2015;35:565–94. [DOI] [PMC free article] [PubMed] [Google Scholar]
- 53. Perkel JM. Miniaturizing mass spectrometry. Science, 2014; Feb 21. [Google Scholar]