

Abstract
Background
The ability to oxidize fat is associated with a lower risk of chronic metabolic disease. Preclinical data in mice showed that a high-fat “breakfast” increased 24-h fat oxidation relative to a high-carbohydrate breakfast.
Objectives
The objectives of this study were to determine whether the timing of macronutrient intake in humans affects daily fuel utilization and to examine associations between fuel utilization and metabolic indexes.
Methods
Participants were 29 healthy sedentary men and women (aged 55–75 y) with a body mass index (kg/m2) between 25 and 35. Participants were randomly assigned to receive either a high-fat breakfast (FB; 35% carbohydrate, 20% protein, 45% fat; n = 13) or a high-carbohydrate breakfast (CB; 60% carbohydrate, 20% protein, 20% fat; n = 16) for 4 wk while consuming a “neutral” lunch and dinner. Twenty-four-hour and postprandial respiratory quotients (RQs) were measured by whole-room indirect calorimetry. Insulin and glucose measures including insulin sensitivity were determined by an oral-glucose-tolerance test. Measures were taken at baseline and after the 4-wk intervention. Group-by-time interactions were determined by 2-factor repeated-measures mixed-model ANOVA. Pearson’s correlation analyses were used to determine associations of 24-h RQs with metabolic measures after the intervention.
Results
There was a significant group-by-time interaction for change in the 24-h RQ [FB (mean ± SD): 0.88 ± 0.02 to 0.86 ± 0.02; CB: 0.88 ± 0.02 for both; P < 0.05], breakfast RQ (FB: 0.88 ± 0.03 to 0.86 ± 0.03; CB: 0.89 ± 0.02 to 0.90 ± 0.02; P < 0.01), and lunch RQ (FB: 0.089 ± 0.03 to 0.85 ± 0.03; CB: 0.89 ± 0.03 for both; P < 0.01). In the CB group at follow-up, 24-h RQ was positively associated with fasting glucose (r = 0.66, P < 0.05), glucose area under the curve (AUC) (r = 0.51, P < 0.05), and insulin AUC (r = 0.52, P < 0.05) and inversely associated with insulin sensitivity (r = –0.51, P < 0.05).
Conclusions
The macronutrient composition of breakfast affects substrate utilization throughout the day in older adults. The consumption of a high-fat, lower-carbohydrate breakfast may reduce the risk of metabolic disease. This trial was registered at www.clinicaltrials.gov as NCT03164200.
Keywords: fat oxidation, respiratory quotient, whole-room calorimetry, dietary intervention, meal timing, insulin sensitivity
Introduction
The ability to oxidize dietary fat as a fuel is critical for the maintenance of metabolic health and the prevention of chronic disease. Impairment of fat oxidation can lead to weight gain and insulin resistance (1, 2), increasing the risk of chronic metabolic disease. Given the prevalence of chronic diseases such as type 2 diabetes, cardiovascular disease, Alzheimer disease, and cancer among older adults (3, 4), strategies to maximize metabolic health in this at-risk population are needed.
Dietary factors, both quantitative and qualitative, are likely to contribute to the ability to maintain effective fat oxidation. Although diet quantity has received much attention due to its connection to obesity, additional dietary factors such as the timing and macronutrient composition of food intake are garnering more attention as important contributors to metabolic health (5–8). The time when food, or specific food groups, are consumed may have clinically relevant implications. In animal models, the timing of intake of specific macronutrients is associated with the daily pattern of fuel utilization (9). Mice fed a high-fat meal at the onset of the daily dark (active) phase for 12 wk showed greater 24-h fat oxidation and metabolic flexibility than mice fed a high-carbohydrate “breakfast” meal. Furthermore, “fat-breakfast” mice exhibited significantly lower body weights and body fat, greater glucose tolerance, lower insulin, and lower TGs relative to “carbohydrate-breakfast” mice (9).
Similarly, in humans, changes in the timing of food intake affect metabolic health. Shift workers, who routinely consume meals out of phase with the normal daily light-dark cycle, are at increased risk of obesity, type 2 diabetes, and cardiovascular disease (10). Likewise, experimental data have shown that shifting the time of meals leads to changes in resting energy expenditure, fasting carbohydrate oxidation, glucose tolerance, cortisol rhythms, thermic effect of food, and insulin sensitivity (11) and affects success with weight loss (12). This circadian sensitivity to food consumption also may apply to specific macronutrients. It has been speculated that a breakfast high in carbohydrate and protein prevents weight gain through effects on hunger, cravings, and ghrelin (13). In addition, the consumption of higher-fat foods such as eggs compared with higher-carbohydrate foods such as bagels for breakfast was associated with greater weight loss and tended to be associated with an improved lipid profile (14), suggesting that the consumption of a breakfast relatively enriched in dietary fat may be beneficial for metabolic health.
To our knowledge, no study to date has tested the hypothesis that, in humans, the timing of ingestion of specific macronutrients affects fuel utilization across the 24-h day. Thus, the objective of this study was to determine the effect of consumption of either a high-fat breakfast or a high-carbohydrate breakfast for 4 wk on the daily profile of fuel utilization as determined by respiratory quotient (RQ) and to examine associations between RQ and metabolic indexes. The study was conducted in adults aged ≥55 y to address the need to identify means of optimizing metabolic health in older adults.
Methods
Participants
This study included data from 29 sedentary or moderately active (<2 h moderate intentional exercise/wk) men and women between the ages of 55 and 75 y, with a BMI (kg/m2) between 25 and 35 who were recruited for the study between May 2012 and October 2013. Exclusion criteria included diabetes or other medical conditions contraindicated for study inclusion, unwillingness or inability to follow the study diet, tobacco use, excess alcohol intake (>400 g/d), significant weight change (±5 kg) in the past 12 mo, or use of medications known to affect metabolism or energy expenditure. Eight individuals taking statins were allowed to participate in the study. All of the participants signed an informed consent before any testing procedures were performed, and the study was approved by the University of Alabama at Birmingham's Institutional Review Board.
Study design
The study used a 2-arm, parallel-group design with participants randomly assigned to receive either a fat-based breakfast (FB; n = 12) or a carbohydrate-based breakfast (CB; n = 17) for 4 wk (Figure 1). Randomization was performed by first stratifying participants according to sex and then using a blocked randomization strategy with block size varying randomly from 4 to 8 participants. A randomization schedule was created by using a computerized random-number–generating algorithm. Randomization was performed by a statistician and provided to the study coordinator who enrolled and assigned participants to their respective groups. Twenty-four-hour and postprandial RQ, insulin sensitivity, body composition, lipids, and markers of inflammation were measured at baseline and after the 4-wk intervention in the core facilities of the University of Alabama at Birmingham's Center for Clinical and Translational Science, Nutrition Obesity Research Center, and Diabetes Research Center. This trial was registered at www.clinicaltrials.gov as NCT03164200.
FIGURE 1.
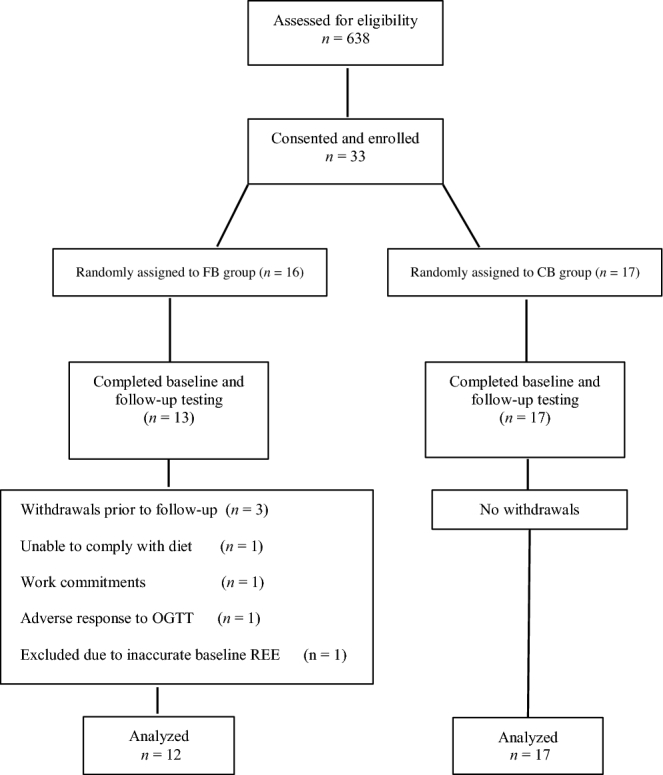
Study flow diagram. CB, carbohydrate-based breakfast; FB, fat-based breakfast; OGTT, oral-glucose-tolerance test; REE, resting energy expenditure.
Diets
The diets were designed to alter the macronutrient content of the breakfast meal, with the FB group receiving ∼45% of energy from fat, 20% from protein, and 35% from carbohydrate and the CB group receiving ∼20% of energy from fat, 20% from protein, and ∼60% from carbohydrate. The lunch and dinner meals for both groups were designed to be metabolically “neutral,” with a macronutrient content of 50%, 20%, and 30% of energy from carbohydrate, protein, and fat, respectively. On average, meals contained <10% saturated fat.
For individuals randomly assigned to receive the FB diet, ≥1 whole egg was consumed 5 d/wk as part of the breakfast meal. Eggs were emphasized due to data showing that they are a preferred food of older adults in Alabama (15), thus increasing the translational potential of the study. Furthermore, eggs provided a useful means for increasing the fat content of the breakfast while also offering an easily prepared and consumed source of high-quality protein, which is beneficial for older adults (16). All breakfast items were provided to participants in both groups.
For lunch and dinner, participants in both groups were provided with 7-d menu plans and received detailed, individualized instructions on the consumption of metabolically “neutral” meals. A 1-d menu example including breakfast items for both groups is shown in Supplemental Table 1. The diet plans were based on participants’ energy requirements determined at baseline by indirect calorimetry, with an activity factor calculated for each individual on the basis of his or her reported habitual physical activity. The study dietitian met with participants on an individual basis each week during the intervention period to record their weight and to address any questions or concerns with regard to dietary adherence.
Whole-room indirect calorimetry
Twenty-four-hour resting, sleeping, and postprandial energy expenditure and substrate utilization were assessed by using whole-room indirect calorimetry, as previously described (17, 18). For calculating the response to a meal, the postprandial period was taken as the 3-h block starting at the time of meal initiation. During the baseline 24-h calorimeter period (before the intervention), all of the participants received meals provided at a macronutrient concentration of 50% of energy from carbohydrate, 20% from protein, and 30% from fat across the day. To ensure energy balance before testing, participants were provided with instructions with regard to pretest diet and asked to adhere to these instructions for 3 d. At the 4-wk test, the diet provided matched each participant's randomization assignment. For both tests, energy needs for each individual were calculated from resting energy expenditure times an activity factor of 1.2. Energy balance while in the respiratory chamber was calculated by subtracting energy expenditure during the 24-h period from energy intake of food consumed. Participants were required to eat all of the food provided. For both tests, participants were instructed to avoid strenuous physical activity the day before testing, but otherwise to maintain their usual activity level.
Body composition
Body composition was determined by DXA (iDXA; GE Healthcare Lunar). Participants were scanned in light clothing while lying flat on their backs with arms at their sides. Total and regional (trunk, leg) body composition (fat mass, bone mass, lean mass) was determined.
Insulin sensitivity index
An index of insulin sensitivity was determined by using a formula based on glucose and insulin data obtained during an oral-glucose-tolerance test (19). Participants were required to fast for 12 h before the test. To perform the test, a flexible intravenous catheter was placed in the antecubital space of one arm. At time “zero,” participants consumed a standard 75-g dextrose solution. Blood samples were collected at baseline and at minutes 30, 60, 90, and 120. Sera were stored at −85°C until analyzed for glucose and insulin.
Laboratory analyses
Serum analytes including glucose, high-sensitivity C-reactive protein (CRP), total cholesterol, HDL cholesterol, and TGs were measured by using a SIRRUS analyzer (Stanbio Laboratories); serum LDL cholesterol was determined by the Friedewald method (20). Serum insulin was measured by using a TOSOH immunoassay analyzer (TOSOH AIA-600 II analyzer; TOSOH Bioscience).
Statistical analysis
Outcomes of interest are presented as means ± SDs. A 2-factor repeated-measures mixed-model ANOVA was used to determine main effects of group, time, and the group × time interaction. Tukey's honestly significant difference post hoc analysis for multiple comparisons was performed on variables with a significant group-by-time interaction. Pearson's correlation analyses were used to examine the associations of 24-h RQ with metabolic measures at baseline and after the 4-wk intervention, and to determine associations for changes in RQ with changes in metabolic measures over the 4-wk intervention. Partial correlation analyses were used to adjust for the possible influence of energy balance on associations of 24-h RQ with metabolic variables at baseline and after the 4-wk intervention. Preliminary analyses with the use of 2-group t tests were performed to assess differences in sex and race on 24-h RQ and other main outcomes of interest. Because no significant differences were observed, sex and race were not included as covariates in subsequent analyses. Fasting glucose, fasting insulin, glucose and insulin AUC, TGs, and CRP were logarithmically transformed to approximate a normal distribution.
On the basis of previously published data, we estimated that a total sample size of 26 (13 subjects/group) would be needed to detect a 0.035-unit difference in RQ between groups at 80% power (21). Estimating an attrition rate of ∼10%, we initially enrolled 33 participants. Three participants in the FB group withdrew before the 4-wk follow-up visit (Figure 1). In addition, 1 participant in the FB group was excluded from analyses due to issues with the baseline indirect calorimetry measure, which resulted in an inaccurate resting energy expenditure (800-kcal deficit) and underfeeding during baseline testing. This resulted in a final sample size of n = 12 for the FB group. A total of n = 17 participants were included in the CB group. All of the statistical tests were 2-tailed and were performed with the use of a 5% significance level. All of the statistical analyses were performed by using JMP (version 10; SAS Institute, Inc.), except for partial correlations, which were performed by using the SAS software package (version 9.4; SAS Institute, Inc.).
Results
Individuals participating in the study were ∼64 ± 6 y of age, 30% of whom were men and 20% of whom were African American. Descriptive characteristics of the participants and outcomes of interest at baseline and after the 4-wk dietary intervention are presented in Table 1 by diet group. On average, participants were considered overweight on the basis of BMI (28.4 ± 2.7) at baseline. Most participants lost weight after the 4-wk intervention, with mean weight losses of 0.50 ± 0.8 kg in the FB group and 1.10 ± 1.1 kg in the CB group. There was no significant group-by-time interaction effect for weight loss.
TABLE 1.
Body composition, RQ, and metabolic outcomes at baseline and after a 4-wk dietary intervention among older adults who consumed a high-fat or high-carbohydrate breakfast1
| P | |||||
|---|---|---|---|---|---|
| Variable and breakfast group | Baseline | 4-wk Follow-up | Group | Time | Group by time |
| Weight, kg | 0.167 | <0.001 | 0.126 | ||
| FB | 82.3 ± 12.8 | 81.8 ± 12.7 | |||
| CB | 76.3 ± 11.1 | 75.2 ± 10.8 | |||
| BMI, kg/m2 | 0.101 | <0.001 | 0.098 | ||
| FB | 29.3 ± 2.7 | 29.1 ± 2.7 | |||
| CB | 27.7 ± 2.6 | 27.3 ± 2.5 | |||
| Waist circumference, cm | 0.263 | 0.202 | 0.093 | ||
| FB | 96.2 ± 12.5 | 96.4 ± 11.8 | |||
| CB | 92.9 ± 8.7 | 91.1 ± 7.9 | |||
| Total fat, % | 0.784 | <0.001 | 0.920 | ||
| FB | 41.1 ± 8.0 | 40.5 ± 8.1 | |||
| CB | 40.4 ± 6.6 | 39.7 ± 6.8 | |||
| Total fat, kg | 0.283 | <0.001 | 0.353 | ||
| FB | 33.5 ± 7.5 | 32.8 ± 7.6 | |||
| CB | 30.6 ± 7.2 | 29.6 ± 7.1 | |||
| Total lean, kg | 0.359 | 0.452 | 0.190 | ||
| FB | 45.6 ± 9.9 | 46.0 ± 10.0 | |||
| CB | 42.7 ± 8.1 | 42.6 ± 8.3 | |||
| 24-h RQ | 0.091 | 0.010 | 0.036 | ||
| FB | 0.88 ± 0.02a | 0.86 ± 0.02b | |||
| CB | 0.88 ± 0.02a | 0.88 ± 0.02a | |||
| 24-h NPRQ | 0.078 | 0.006 | 0.037 | ||
| FB | 0.90 ± 0.03a | 0.87 ± 0.03b | |||
| CB | 0.90 ± 0.03a | 0.90 ± 0.03a | |||
| Resting RQ | 0.587 | 0.821 | 0.537 | ||
| FB | 0.89 ± 0.07 | 0.88 ± 0.04 | |||
| CB | 0.87 ± 0.05 | 0.88 ± 0.05 | |||
| Breakfast RQ | 0.008 | 0.412 | 0.008 | ||
| FB | 0.88 ± 0.03a,b | 0.86 ± 0.03b | |||
| CB | 0.89 ± 0.02a | 0.90 ± 0.02a | |||
| Lunch RQ | 0.061 | 0.001 | 0.001 | ||
| FB | 0.89 ± 0.03a | 0.85 ±0.03b | |||
| CB | 0.89 ± 0.03a | 0.89 ± 0.03a | |||
| Dinner RQ | 0.249 | <0.001 | 0.345 | ||
| FB | 0.91 ± 0.03 | 0.87 ± 0.03 | |||
| CB | 0.91 ±0.03 | 0.89 ± 0.02 | |||
| Sleep RQ | 0.838 | 0.596 | 0.964 | ||
| FB | 0.87 ± 0.02 | 0.87 ± 0.03 | |||
| CB | 0.87 ± 0.03 | 0.87 ± 0.03 | |||
| 24-h Energy expenditure, kcal/d | 0.500 | 0.013 | 0.077 | ||
| FB | 1991 ± 346 | 1975 ± 355 | |||
| CB | 1952 ± 240 | 1865 ± 253 | |||
| 24-h Energy balance, kcal/d | 0.429 | 0.020 | 0.054 | ||
| FB | −216 ± 193 | −207 ± 173 | |||
| CB | −198 ± 131 | −116 ± 139 | |||
| Serum cholesterol, mg/dL | 0.772 | 0.010 | 0.015 | ||
| FB | 188 ± 29a,b | 187 ± 22a,b | |||
| CB | 194 ± 36a | 174 ± 36b | |||
| Serum TGs, mg/dL | 0.934 | 0.349 | 0.279 | ||
| FB | 108 ± 38 | 106 ± 34 | |||
| CB | 116 ± 64 | 109 ± 61 | |||
| Serum HDL cholesterol, mg/dL | 0.842 | 0.038 | 0.909 | ||
| FB | 60 ± 18 | 57 ± 14 | |||
| CB | 59 ± 18 | 56 ± 16 | |||
| Serum LDL cholesterol, mg/dL | 0.762 | 0.062 | 0.014 | ||
| FB | 106 ± 31a,b | 109 ± 24a,b | |||
| CB | 112 ± 32a | 96 ± 28b | |||
| Serum fasting glucose, mg/dL | 0.730 | 0.287 | 0.852 | ||
| FB | 100 ± 16 | 102 ± 15 | |||
| CB | 98 ± 10 | 100 ± 12 | |||
| Serum fasting insulin, μIU/mL | 0.485 | 0.059 | 0.585 | ||
| FB | 13.3 ± 16.6 | 15.9 ± 15.1 | |||
| CB | 10.1 ± 8.0 | 10.9 ± 7.0 | |||
| Insulin sensitivity index | 0.598 | 0.147 | 0.247 | ||
| FB | 5.43 ± 4.40 | 4.41 ± 3.67 | |||
| CB | 4.89 ± 2.94 | 4.78 ± 2.82 | |||
| Serum glucose AUC, g/L × 120 min | 0.726 | 0.647 | 0.018 | ||
| FB | 169 ± 51a | 180 ± 49a | |||
| CB | 172 ± 45a | 161 ± 49a | |||
| Serum insulin AUC, IU/L × 120 min | 0.569 | 0.598 | 0.189 | ||
| FB | 10.7 ± 9.8 | 12.9 ± 14.3 | |||
| CB | 7.9 ± 3.7 | 7.5 ± 3.5 | |||
| Serum C-reactive protein, mg/L | 0.888 | 0.136 | 0.950 | ||
| FB | 3.41 ± 3.22 | 2.81 ± 2.62 | |||
| CB | 2.60 ± 1.16 | 2.76 ± 2.38 | |||
1Values are means ± SDs; n = 12 for the FB group and n = 17 for the CB group. Tukey's honestly significant difference post hoc analysis was performed for variables with a significant group-by-time interaction. Statistical analysis for serum TGs, insulin sensitivity index, and serum insulin AUCs were performed by using logarithmically transformed data. Means in a row without a common superscript letter differ, P < 0.05. CB, carbohydrate-based breakfast; FB, fat-based breakfast; NPRQ, nonprotein respiratory quotient; RQ, respiratory quotient.
As shown in Table 1, there was a significant group-by-time interaction for 24-h RQ, breakfast RQ, and lunch RQ, but not dinner RQ. A significant group-by-time interaction was also observed for 24-h nonprotein respiratory quotient (Table 1). There was a tendency for the CB group to have a lower energy expenditure over time compared with the FB group; however, this did not reach significance (P = 0.08). Although the majority of the lipids, metabolic variables, and inflammatory markers did not change significantly after the dietary intervention, there were significant group-by-time interactions for total cholesterol and LDL cholesterol, such that the CB group had significantly lower total cholesterol and LDL cholesterol over time compared with the FB group. Although there was a significant group-by-time interaction for the glucose AUC due to a slight increase in the FB group and a slight decrease in the CB group, multiple-comparison analysis did not indicate a significant difference in group means over time (Table 1).
Associations of 24-h RQ with metabolic variables within each breakfast group after the 4-wk dietary intervention are presented in Figure 2. At baseline, 24-h RQ was significantly and positively associated with fasting glucose in the FB group (r = 0.60, P = 0.02; data not shown). However, the significance was attenuated after adjusting for energy balance (r = 0.47, P = 0.15). Similar results were observed for the FB group after the dietary intervention, with a significant association observed for 24-h RQ with fasting glucose (r = 0.66, P = 0.02), which was attenuated after adjustment for energy balance (r = 0.36, P = 0.31). No other significant associations were observed for 24-h RQ with metabolic variables among the FB group at either baseline or follow-up.
FIGURE 2.
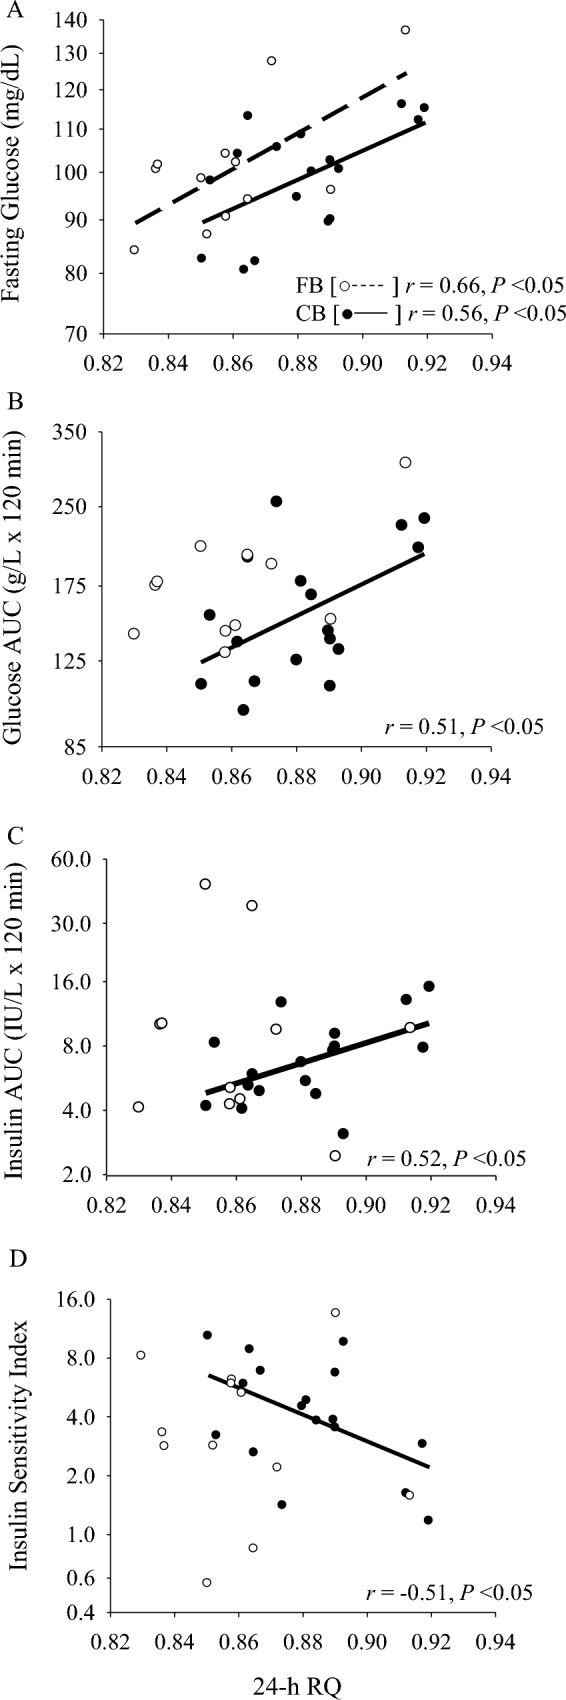
Associations of 24-h RQ with serum fasting glucose (A), serum glucose AUC (B), serum insulin AUC (C), and insulin sensitivity index (D) at follow-up among older adults who consumed a high-fat or high-carbohydrate breakfast for 4 wk. FB group: n = 12; CB group: n = 17. CB, carbohydrate-based breakfast; FB, fat-based breakfast; RQ, respiratory quotient.
Among the CB group, 24-h RQ was not significantly associated with any metabolic variables at baseline. However, after the 4-wk intervention, 24-h RQ was significantly associated with fasting glucose (r = 0.56, P = 0.02; Figure 2A), glucose AUC (r = 0.51, P = 0.04; Figure 2B), insulin AUC (r = 0.52, P = 0.03; Figure 2C), and insulin sensitivity (r = −0.51, P = 0.04; Figure 2D). The association with fasting glucose remained significant after adjusting for energy balance (r = 0.60, P = 0.01), but the associations with glucose AUC, insulin AUC, and insulin sensitivity were slightly attenuated (r = 0.49, P = 0.06; r = 0.43, P = 0.09; and r = −0.45, P = 0.08, respectively).
Discussion
The major findings of the study support the hypothesis that breakfast composition affects 24-h substrate oxidation. Participants who consumed the high-fat breakfast for 4 wk showed significantly lower RQ (greater fat oxidation) throughout the 24-h day, as well as after the lunch and dinner meals, than did participants who consumed a carbohydrate-based breakfast. On the basis of previous studies in both humans and animal models, these changes in substrate utilization may confer benefit for metabolic health.
The timing of consumption of specific macronutrients has gained recent attention as a possible mediator of metabolic health. Animal studies suggest that a high-fat meal consumed at the beginning of the active cycle increases fat oxidation (9). With regard to macronutrient content of a breakfast meal in humans, previous studies have shown that a high-protein breakfast compared with a high-carbohydrate breakfast appears to increase fat oxidation in both women and children (22, 23). Less research has focused on the effects of a high-fat breakfast compared with a high-carbohydrate breakfast under weight-maintenance conditions. The present study shows that a high-fat breakfast consumed over 4 wk increases 24-h fat oxidation. Under acute settings (1-d fat challenge), increased fat intake at a breakfast meal was not shown to significantly increase fat oxidation (24, 25). However, a high-fat diet maintained for ≥3 d was shown to reduce RQ (26). Because the lunch and dinner meals were matched for macronutrient intake, and were the same for both groups, participants in the FB group had slightly higher daily fat intake than did those in the CB group. For this reason, we cannot definitively say that the increase in 24-h fat oxidation was the sole result of a high-fat breakfast as opposed to mildly increased fat intake throughout the day. However, the difference in daily fat intake was only ∼10%, with the majority consumed during the breakfast meal.
Examination of the metabolic outcomes did not show a difference between groups for TGs, HDL cholesterol, fasting glucose, fasting insulin, insulin AUC, or insulin sensitivity. Among the CB group, there were reductions in total cholesterol and LDL cholesterol, which could have been due to slightly lower fat intake as per the study design. Despite the increase in fat intake among the FB group, total cholesterol and LDL cholesterol remained virtually unchanged, suggesting that a breakfast higher in fat, which included ≥1 egg for 5 d/wk, does not adversely affect lipid concentrations and, as shown by other investigators, may even improve risk factors for metabolic syndrome (27, 28). In the FB group, the slight increase in glucose AUC coupled with the slight decrease in 24-h RQ may suggest a diet-induced shift from glucose oxidation to fat oxidation compared with the CB group, which showed slightly reduced glucose AUC and no change in 24-h RQ. The 18% decrease in serum CRP concentration in the FB group and the 6% increase in the CB group could have been a result of changes in intakes of sugar and processed carbohydrates, which are known to be associated with inflammation (29). Perhaps with a greater number of study participants, the group-by-time difference in CRP would have been significant.
Because substrate utilization is associated with lipids, insulin, and glucose in animal models (9), we also examined whether, in this study, RQ measures were associated with metabolic outcomes. Within the CB group, at 4 wk, measures of 24-h RQ were associated with fasting glucose, glucose AUC, insulin AUC, and insulin sensitivity. In all cases, a higher RQ was associated with higher fasting glucose and fasting insulin and lower insulin sensitivity. Although cause and effect cannot be determined from these observations, it is possible that a high-carbohydrate breakfast impaired metabolic flexibility, as suggested by studies in mice (9), which, in turn, led to disruptions in glucose metabolism and insulin sensitivity. The absence of similar associations in the FB group suggests that the high-carbohydrate breakfast exerts a relatively more profound perturbation to metabolism than does the high-fat breakfast.
This study shows that in humans, as in animal models, chronic consumption of a high-fat breakfast can affect 24-h substrate utilization. Given the favorable association between fat oxidation and metabolic health, it is possible that the routine consumption of a high-fat, low-carbohydrate breakfast could be beneficial for reducing the risk of chronic disease. This could be particularly important in older adults who, as a group, are at elevated risk of type 2 diabetes, cardiovascular disease, and other chronic diseases. However, this study is limited by the relatively small sample size and the negative energy balance shown in both groups. Negative energy balance has a profound effect on metabolic health and may have made it difficult to detect independent effects of diet composition on outcomes such as lipid profile, insulin sensitivity, and inflammation. Longer-term studies are needed to determine if the routine consumption of a high-fat, lower-carbohydrate breakfast has beneficial effects on metabolic health in humans of all ages.
Supplementary Material
Acknowledgments
We thank Maryellen Williams, Cindy Zeng, and Heather Hunter from the Metabolism/Human Physiology Core Laboratory of the Nutrition Obesity Research Center, Diabetes Research Center, and Center for Clinical and Translational Science for laboratory analyses. The authors’ responsibilities were as follows—BAG, JLL, and MSB: designed the research study; LLG and TS: were involved in conducting the research; NCB and HESR: performed the statistical analyses; NCB and BAG: interpreted the data and critically evaluated and revised the final manuscript; NCB, BAG, and HESR: drafted the manuscript; BAG, NCB, JLL, MSB, HESR, and TS: contributed to the intellectual content; and all authors: read and approved the final manuscript.
Notes
Supported by the Nutrition Obesity Research Center (P30DK56336), the Diabetes Research Center (P60DK079626), the Center for Clinical and Translational Science (UL1RR025777), and The Egg Nutrition Center/American Egg Board.
Supplemental Table 1 available from the “Supplementary data” link in the online posting of the article and from the same link in the online table of contents at https://academic.oup.com/jn/.
Abbreviations used:
- CB
carbohydrate-based breakfast
- CRP
C-reactive protein
- FB
fat-based breakfast
- RQ
respiratory quotient.
References
- 1. Heilbronn LK, Gregersen S, Shirkhedkar D, Hu D, Campbell LV. Impaired fat oxidation after a single high-fat meal in insulin-sensitive nondiabetic individuals with a family history of type 2 diabetes. Diabetes 2007;56:2046–53. [DOI] [PubMed] [Google Scholar]
- 2. Zurlo F, Lillioja S, Esposito-Del Puente A, Nyomba BL, Raz I, Saad MF, Swinburn BA, Knowler WC, Bogardus C, Ravussin E. Low ratio of fat to carbohydrate oxidation as predictor of weight gain: study of 24-h RQ. Am J Physiol 1990;259:E650–7. [DOI] [PubMed] [Google Scholar]
- 3. Sole-Auro A, Michaud PC, Hurd M, Crimmins E. Disease incidence and mortality among older Americans and Europeans. Demography 2015;52:593–611. [DOI] [PMC free article] [PubMed] [Google Scholar]
- 4. Weiss CO, Boyd CM, Yu Q, Wolff JL, Leff B. Patterns of prevalent major chronic disease among older adults in the United States. JAMA 2007;298:1160–2. [DOI] [PubMed] [Google Scholar]
- 5. Mattson MP, Allison DB, Fontana L, Harvie M, Longo VD, Malaisse WJ, Mosley M, Notterpek L, Ravussin E, Scheer FA et al. . Meal frequency and timing in health and disease. Proc Natl Acad Sci USA 2014;111:16647–53. [DOI] [PMC free article] [PubMed] [Google Scholar]
- 6. Morgan LM, Shi JW, Hampton SM, Frost G. Effect of meal timing and glycaemic index on glucose control and insulin secretion in healthy volunteers. Br J Nutr 2012;108:1286–91. [DOI] [PubMed] [Google Scholar]
- 7. Rabinovitz HR, Boaz M, Ganz T, Jakubowicz D, Matas Z, Madar Z, Wainstein J. Big breakfast rich in protein and fat improves glycemic control in type 2 diabetics. Obesity (Silver Spring) 2014;22:E46–54. [DOI] [PubMed] [Google Scholar]
- 8. Sherman H, Genzer Y, Cohen R, Chapnik N, Madar Z, Froy O. Timed high-fat diet resets circadian metabolism and prevents obesity. FASEB J 2012;26:3493–502. [DOI] [PubMed] [Google Scholar]
- 9. Bray MS, Tsai JY, Villegas-Montoya C, Boland BB, Blasier Z, Egbejimi O, Kueht M, Young ME. Time-of-day-dependent dietary fat consumption influences multiple cardiometabolic syndrome parameters in mice. Int J Obes (Lond) 2010;34:1589–98. [DOI] [PMC free article] [PubMed] [Google Scholar]
- 10. Froy O. Metabolism and circadian rhythms—implications for obesity. Endocr Rev 2010;31:1–24. [DOI] [PubMed] [Google Scholar]
- 11. Bandin C, Scheer FA, Luque AJ, Avila-Gandia V, Zamora S, Madrid JA, Gomez-Abellan P, Garaulet M. Meal timing affects glucose tolerance, substrate oxidation and circadian-related variables: a randomized, crossover trial. Int J Obes (Lond) 2015;39:828–33. [DOI] [PubMed] [Google Scholar]
- 12. Garaulet M, Gomez-Abellan P, Alburquerque-Bejar JJ, Lee YC, Ordovas JM, Scheer FA. Timing of food intake predicts weight loss effectiveness. Int J Obes (Lond) 2013;37:604–11. [DOI] [PMC free article] [PubMed] [Google Scholar]
- 13. Jakubowicz D, Froy O, Wainstein J, Boaz M. Meal timing and composition influence ghrelin levels, appetite scores and weight loss maintenance in overweight and obese adults. Steroids 2012;77:323–31. [DOI] [PubMed] [Google Scholar]
- 14. Vander Wal JS, Gupta A, Khosla P, Dhurandhar NV. Egg breakfast enhances weight loss. Int J Obes (Lond) 2008;32:1545–51. [DOI] [PMC free article] [PubMed] [Google Scholar]
- 15. Yang Y, Buys DR, Judd SE, Gower BA, Locher JL. Favorite foods of older adults living in the Black Belt region of the United States: influences of ethnicity, gender, and education. Appetite 2013;63:18–23. [DOI] [PMC free article] [PubMed] [Google Scholar]
- 16. Paddon-Jones D, Leidy H. Dietary protein and muscle in older persons. Curr Opin Clin Nutr Metab Care 2014;17:5–11. [DOI] [PMC free article] [PubMed] [Google Scholar]
- 17. Bray MS, Hagberg JM, Perusse L, Rankinen T, Roth SM, Wolfarth B, Bouchard C. The human gene map for performance and health-related fitness phenotypes: the 2006–2007 update. Med Sci Sports Exerc 2009;41:35–73. [DOI] [PubMed] [Google Scholar]
- 18. Jackson AS, Ellis KJ, McFarlin BK, Sailors MH, Bray MS. Body mass index bias in defining obesity of diverse young adults: the Training Intervention and Genetics of Exercise Response (TIGER) Study. Br J Nutr 2009;102:1084–90. [DOI] [PMC free article] [PubMed] [Google Scholar]
- 19. Matsuda M, DeFronzo RA. Insulin sensitivity indices obtained from oral glucose tolerance testing: comparison with the euglycemic insulin clamp. Diabetes Care 1999;22:1462–70. [DOI] [PubMed] [Google Scholar]
- 20. Friedewald WT, Levy RI, Fredrickson DS. Estimation of the concentration of low-density lipoprotein cholesterol in plasma, without use of the preparative ultracentrifuge. Clin Chem 1972;18:499–502. [PubMed] [Google Scholar]
- 21. Ellis AC, Hyatt TC, Hunter GR, Gower BA. Respiratory quotient predicts fat mass gain in premenopausal women. Obesity (Silver Spring) 2010;18:2255–9. [DOI] [PMC free article] [PubMed] [Google Scholar]
- 22. Baum JI, Gray M, Binns A. Breakfasts higher in protein increase postprandial energy expenditure, increase fat oxidation, and reduce hunger in overweight children from 8 to 12 years of age. J Nutr 2015;145:2229–35. [DOI] [PubMed] [Google Scholar]
- 23. Neumann BL, Dunn A, Johnson D, Adams JD, Baum JI. Breakfast macronutrient composition influences thermic effect of feeding and fat oxidation in young women who habitually skip breakfast. Nutrients 2016;8:490. [DOI] [PMC free article] [PubMed] [Google Scholar]
- 24. Bennett C, Reed GW, Peters JC, Abumrad NN, Sun M, Hill JO. Short-term effects of dietary-fat ingestion on energy expenditure and nutrient balance. Am J Clin Nutr 1992;55:1071–7. [DOI] [PubMed] [Google Scholar]
- 25. Flatt JP, Ravussin E, Acheson KJ, Jequier E. Effects of dietary fat on postprandial substrate oxidation and on carbohydrate and fat balances. J Clin Invest 1985;76:1019–24. [DOI] [PMC free article] [PubMed] [Google Scholar]
- 26. Hill JO, Peters JC, Reed GW, Schlundt DG, Sharp T, Greene HL. Nutrient balance in humans: effects of diet composition. Am J Clin Nutr 1991;54:10–7. [DOI] [PubMed] [Google Scholar]
- 27. Blesso CN, Andersen CJ, Barona J, Volek JS, Fernandez ML. Whole egg consumption improves lipoprotein profiles and insulin sensitivity to a greater extent than yolk-free egg substitute in individuals with metabolic syndrome. Metabolism 2013;62:400–10. [DOI] [PubMed] [Google Scholar]
- 28. Maki KC, Palacios OM, Lindner E, Nieman KM, Bell M, Sorce J. Replacement of refined starches and added sugars with egg protein and unsaturated fats increases insulin sensitivity and lowers triglycerides in overweight or obese adults with elevated triglycerides. J Nutr 2017;147:1267–74. [DOI] [PubMed] [Google Scholar]
- 29. Buyken AE, Goletzke J, Joslowski G, Felbick A, Cheng G, Herder C, Brand-Miller JC. Association between carbohydrate quality and inflammatory markers: systematic review of observational and interventional studies. Am J Clin Nutr 2014;99:813–33. [DOI] [PubMed] [Google Scholar]
Associated Data
This section collects any data citations, data availability statements, or supplementary materials included in this article.