

Abstract
Background
trans-10,cis-12 Conjugated linoleic acid (t10,c12-CLA) is a dietary supplement that promotes weight loss by increasing fat oxidation and energy expenditure. We previously reported that in the absence of t10,c12-CLA, mice forced to lose equivalent body weight by food restriction (FR) do not exhibit increases in fat oxidation or energy expenditure but have improved glucose metabolism, consistent with FR as a metabolically healthy weight-loss method.
Objective
Because diet is a primary determinant of gut bacterial populations, we hypothesized that the disparate metabolic effects accompanying weight loss from t10,c12-CLA or FR could be related to altered intestinal microbiota.
Methods
Ten-week-old male LDL receptor–deficient (Ldlr−/−) mice were fed a high-fat, high-sucrose diet (HFHS; 36% lard fat, 36.2% sucrose + 0.15% cholesterol) for 12 wk (baseline), then switched to the HFHS diet alone (obese control), HFHS + 1% c9,t11-CLA (obese fatty acid control), HFHS + 1% t10,c12-CLA (weight-loss–inducing fatty acid), or HFHS + FR (weight-loss control group with 75–85% ad libitum HFHS food intake) for a further 8 wk. Fecal microbial content, short-chain fatty acids (butyrate, acetate), tissue CLA concentrations, and intestinal nutrient transporter expression were quantified.
Results
Mice fed t10,c12-CLA or assigned to FR lost 14.5% of baseline body weight. t10,c12-CLA–fed mice had elevated concentrations of fecal butyrate (2-fold) and plasma acetate (1.5-fold) compared with HFHS-fed controls. Fecal α diversity decreased by 7.6–14% in all groups. Butyrivibrio and Roseburia, butyrate-producing microbes, were enriched over time by t10,c12-CLA. By comparing with each control group, we also identified bacterial genera significantly enriched in the t10,c12-CLA recipients, including Lactobacillus, Actinobacteria, and the newly identified Ileibacterium valens of the Allobaculum genus, whereas other taxa were enriched by FR, including Clostridiales and Bacteroides.
Conclusion
Modalities resulting in equivalent weight loss but with divergent metabolic effects are associated with compositional differences in the mouse intestinal microbiota.
Keywords: butyrate, Butyrivibrio, Roseburia, Allobaculum, conjugated linoleic acid, Ileibacterium valens, GPR41
Introduction
Obesity has reached epidemic proportions, with more than two-thirds of adults worldwide classified as overweight or obese (1). Lifestyle modifications to combat obesity, such as exercise and food restriction (FR), have proven effective against obesity in the short term, yet obesity rates continue to climb (2). Therefore, alternative approaches to effective weight loss are required. One particular dietary supplement, conjugated linoleic acid (CLA), is gaining popularity for its effectiveness at reducing body weight and body fat (3). CLA supplements contain equal amounts of naturally occurring isomers of linoleic acid: cis-9,trans-11 CLA (c9,t11-CLA) and trans-10,cis-12 CLA (t10,c12-CLA), with the latter responsible for the weight-loss effects (4). In LDL receptor–deficient (Ldlr−/−) mice previously made obese by feeding a high-fat, high-sucrose (HFHS; 36% fat from lard, 36.2% sucrose + 0.15% added cholesterol) diet, a model with features resembling the human metabolic syndrome (5), t10,c12-CLA induces high levels of fat loss, primarily from subcutaneous depots by increasing FA oxidation and browning of white adipose tissue (6). This occurs while lean body mass is maintained and energy expenditure is increased without altering energy intake (6, 7). Conversely, intentionally decreased food intake (FR) of the HFHS diet, which resulted in the proportionate loss of both fat and lean body mass and decreased energy expenditure, had no effect on adipose tissue FA oxidation and browning of white adipose tissue (6). Although weight loss by FR leads to improved insulin sensitivity, this effect is not seen in equivalent t10,c12-CLA–mediated weight loss (6), for reasons that are not well understood.
It is becoming increasingly recognized that an altered gut microbiota may contribute to obesity (8–10), potentially by altering host energy metabolism (11–13). The gut microbiota of obese animals shows an increased capacity to harvest energy from the host diet, with partial absorption by the host; when transplanted into germ-free mice such microbiota can promote enhanced adiposity (14). Other potential mechanisms by which gut microbes could affect obesity are as follows: 1) by increasing gut permeability for LPS, thereby contributing to the persistent low-grade inflammation that has been associated with obesity (15), or 2) by perturbing gut hormones that influence the gut-brain-liver-adipose tissue axis to alter energy intake, storage, and utilization (16, 17). Although it is clear that the gut microbiota is intimately involved with host energy metabolism, its contribution to weight loss is less well defined.
Changes in the host diet affect the gut microbiota, altering both species diversity and abundance (18, 19). The microbiota from obese subjects has been generally characterized as showing lower bacterial phylogenetic diversity, with higher and lower proportions of Firmicutes and Bacteroidetes, respectively (9). In our previous study, substituting 1% of the total fat from an HFHS diet with t10,c12-CLA had profound effects on body fat and energy expenditure, which were not seen with mice undergoing FR (6). This raises the possibility that small changes in specific dietary components could disproportionately affect the gut microbiota. This concept could explain why effects on adipose tissue and whole-body metabolism could diverge after equivalent degrees of weight loss resulting from different dietary approaches.
We have now examined gut microbial diversity and community structure in obese mice fed an HFHS diet with or without t10,c12-CLA, c9,t11-CLA (the metabolically inert isomer of CLA), or FR. The results of this follow-up study of our previous investigation (6) show that weight loss by t10,c12-CLA or FR lead to distinct gut microbiomes. Fecal species diversity and SCFAs also were differentially altered by FR or t10,c12-CLA. These results link specific gut microbial populations with weight loss and indicate differences in microbial compositions and community structure in response to different methods of weight loss.
Methods
Mouse study design
Male Ldlr−/− mice (C57Bl/6 background; Jackson Laboratories) were used due to their propensity to develop a phenotype resembling human metabolic syndrome, including insulin resistance, systemic inflammation, and obesity (5). Ten-week-old Ldlr−/− mice were fed an HFHS diet (36% fat from lard, 36.2% sucrose + 0.15% added cholesterol; BioServ no. F4997) for 12 wk (baseline), then switched to the HFHS diet with or without c9,t11-CLA or t10,c12-CLA, or were food-restricted (FR) for a further 8 wk. The CLA diets replaced 1% (wt:wt) of lard isocalorically with either c9,t11- or t10,c12-CLA (Nu-Chek Prep; >90% purity). All test diets were prepared by BioServ and have been reported previously in detail (6) (see also Supplemental Table 1). FR of the HFHS diet was begun at 15% of the baseline food intake and ended at 25% FR by the end of the study, because it was adjusted daily to mirror the weight loss induced by the t10,c12-CLA supplementation (6). Importantly, the diet composition of HFHS-fed and FR mice was identical, only differing in the quantity of diet consumed. Measurements of body weight and composition, energy balance, and glucose metabolism from the same mice used herein have been previously reported (6) and are also included in Supplemental Table 2. Fresh fecal pellets were collected at baseline (12 wk of HFHS diet), then 4 and 8 wk after initiation of the test diets. Mice were killed under isoflurane anesthesia, and plasma and tissues were harvested including epididymal white adipose tissue, inguinal white adipose tissue, liver, and small intestine (inclusive between the gastric pyloris and the ileocecal valve). All of the experimental procedures were undertaken with approval from the Institutional Animal Care and Use Committee of the University of Washington and followed the NIH guidelines for the care and use of laboratory animals (NIH publication no. 8023, revised 1978).
CLA tissue quantification
Lipids were extracted from plasma, epididymal white adipose tissue, inguinal white adipose tissue, and liver, as described (20); and FA components were derivatized into methyl esters also as described (21). The methyl esters were identified chromatographically on a thin layer chromatography plate by comparing the retention flow with that of the authentic standard applied on the same plate. The thin-layer chromatography powder containing purified methyl esters was extracted with chloroform; the solvents were removed under nitrogen and resuspended in a small volume of hexane. Total FA compositions were then analyzed by GC with the use of the Agilent GC (6890N equipped with flame ionization detector) with the SP-2560 GC column (100 m × 0.25 mm × 0.2-μm thickness; Sigma-Aldrich). Chemstation software version C.01.04 was used for data analysis. A temperature programming of 100–250°C was used for separations with hydrogen as a carrier gas and for flame ionization detector and nitrogen as a makeup gas. Two authentic CLA standards, 9Z,11E- and 10E,12Z-CLA (Nu-Chek Prep; >90% purity), were eluted as a single sharp peak but then separated with a minimum margin approximating a shoulder peak. Therefore, the peak corresponding to the retention time of elution and its all-trans isomerized forms that occurred during derivatization but that were kept to a minimum by optimizing the procedure (the all-trans isomerized peaks eluted 1 min apart from the nonisomerized cis/trans form) were combined and presented as CLA (nanomoles) present in the total FA profile of lipid extracted from plasma or tissues and normalized to tissue weight (nanomoles of CLA per milligram of tissue).
Gene and protein expression
RNA was extracted from whole frozen small intestine with the use of an RNA extraction kit (RNEasy Mini Kit; Qiagen), reverse transcribed, and cDNA amplified by qRT-PCR with the use of an ABI 7900HT instrument. Taqman primer/probe sets for individual genes were obtained from Thermo Fisher Scientific (Supplemental Table 3), with Gapdh used as a reference gene. The relative expression of target genes was calculated with the use of the ΔΔCt formula and expressed as fold-change from HFHS-fed control mice. For protein quantitation by Western blot, 10 μg total protein from the small intestine was electrophoresed on a native SDS-PAGE and transferred to nitrocellulose, and occludin was detected with the use of an occludin antibody (no. ab167161; AbCam), resolved with the use of a LICOR Odyssey digital system and normalized to β-actin (no. ab8227; AbCam). Densitometry was performed with the use of Image J Software (National Institutes of Health), as described (22).
SCFA analysis of fecal pellets and plasma
Mouse fecal pellets were homogenized in a bullet blender (without beads), in 30 mM hydrochloric acid plus isotopically labeled acetate (0.125 mM), butyrate (0.125 mM), and hexanoate (0.0125 mM), all fully labeled with deuterium (98% D; Sigma-Aldrich). Two hundred-fifty microliters of methyl tert-butyl ether was added to each sample, mixed on a vortex to emulsify, then held at 4°C for 5 min, and mixed on a vortex again. Samples were centrifuged for 1 min at 500 × g at room temperature on a mini benchtop centrifuge (Fisher Scientific) to separate the solvent layers. The upper layer (methyl tert-butyl ether) was then removed to an autosampler vial for GC-MS analysis. Calibration of the standards was prepared along with samples to quantify metabolites. GC-MS analysis was performed on an Agilent 69890N GC-5973 MS detector. The column used was ZB-WAXplus (30 m × 0.25 mm × 0.25 μm GC column; no. 7HG-G013-11; Phenomenex) and the column temperature kept isocratic at 310°C with helium as the carrier gas. Data were processed with the use of Masshunter Quantitative analysis software version B.07.00. SCFAs were normalized to the nearest isotope-labeled internal standard and quantitated with the use of 2 replicated injections of the standards to create a linear calibration curve with an accuracy >80% for each standard. Fecal data are presented as nanomoles of SCFAs per milligram of fecal material. Plasma samples were analyzed with the use of the same methods as the fecal samples, except the plasma was vortex-mixed under acidic conditions (30 mM HCl) instead of using a bullet blender for homogenization. All plasma data are presented as micometers of SCFAs.
Fecal microbial analyses. High-throughput DNA sequencing
Total DNA was isolated from flash-frozen fecal pellets with the use of a PowerFecal DNA Extraction Kit (MoBio), according to the manufacturer's instructions. For each sample, the V4 region of bacterial 16S ribosomal RNA genes was amplified in triplicate reactions with the use of the universal bacterial primer set 515F/806R, which amplifies both bacterial and archaeal 16S genes (23, 24), with PCRs and library preparations performed as described (25). DNA sequencing was performed with the use of the Illumina MiSeq platform at the New York University Langone Medical Center Genome Technology Center. Primary sequences were deposited in the Sequence Read Archives, project accession no. SRP119909.
Sequencing data analysis
Sequence data from fecal samples were processed with QIIME v1.9.0, as described (26, 27). Briefly, sequences were demultiplexed and quality-filtered with the use of default QIIME parameters, and clustered into operational taxonomic units (OTUs) with a sequence similarity threshold of 97% with the use of UCLUST (28) within QIIME; 16S ribosomal RNA OTUs were selected with the use of an open-reference OTU protocol with the following parameters: max accepts: 1; max rejects: 8; step words: 8; word length: 8. The sequence reads, with an average length of 253 bp, were clustered with the use of the Greengenes 97% reference data set (29, 30) (http://greengenes.secondgenome.com; August 2013 release). α Diversity (i.e., the number of unique species per sample) was determined with the use of the Phylogenetic Distance Index, represented as rarefaction curves. β Diversity (i.e., the differences in species diversity within a localized habitat) was determined with the use of unweighted UniFrac analysis (31), and results presented as principal coordinates axis plots. Linear discriminant analysis effect size was used to detect significant differences in relative abundances of microbial taxa among the experimental groups, with significance thresholds performed at the default settings (32).
Statistical analysis
Measurements of tissue and fecal CLA, fecal SCFAs and fecal gene expression were analyzed with the use of GraphPad Prism 6 software and represented as means ± SEMs. One-factor ANOVA was used to compare differences between mice fed the different diets, with a Sidak post hoc test to detect differences between groups. Adonis (permutational multivariate ANOVA using distance matrixes) and Anosim (analysis of similarities: nonparametric distribution-free method of multivariant data analysis that operates on a ranked dissimilarity matrix, allowing comparison of variation in species abundance and composition between sampled units) analyses were performed on fecal sequences, comparing groups and across time, as described (see Table 1) (33). A P value <0.05 was considered significant.
TABLE 1.
β Diversity statistical tests between dietary groups over time1
| Comparisons over time (0, 4, and 8 wk) | ||
|---|---|---|
| Adonis | Anosim | |
| Diet2 | ||
| HFHS | 0.02* | 0.01* |
| c9,t11-CLA | 0.01* | 0.01* |
| t10,c12-CLA | 0.21 | 0.11 |
| HFHS+FR | 0.04* | 0.19 |
| Group3 | ||
| HFHS vs. t10,c12-CLA | 0.269 | 0.498 |
| c9,t11-CLA vs. t10,c12-CLA | 0.030* | 0.019* |
| FR vs. t10,c12-CLA | 0.007* | 0.006* |
1*P < 0.05. CLA, conjugated linoleic acid; c9,t11-CLA, cis-9,trans-11 conjugated linoleic acid; FR, food restriction; HFHS, high-fat, high-sucrose; t10,c12-CLA, trans-10,cis-12 conjugated linoleic acid.
2Compares mice fed the specified diet over time, from 0 to 8 wk.
3Compares mice from the t10,c12-CLA group with the indicated treatment group.
Results
t10,c12-CLA promoted weight loss, despite being undetectable in plasma, adipose tissue, and liver
Mice became obese after being fed the HFHS diet for 12 wk (baseline), then were either continued on the HFHS diet with or without FR or switched to an HFHS diet containing 1% of either c9,t11-CLA or t10,c12-CLA for an additional 8 wk (see Supplemental Table 2 for detailed body metrics). Plasma and tissues from mice treated with c9,t11-CLA showed elevated CLA concentrations, although surprisingly, mice supplemented with t10,c12-CLA did not have tissue CLA concentrations greater than those of the HFHS or FR control groups (Figure 1).
FIGURE 1.
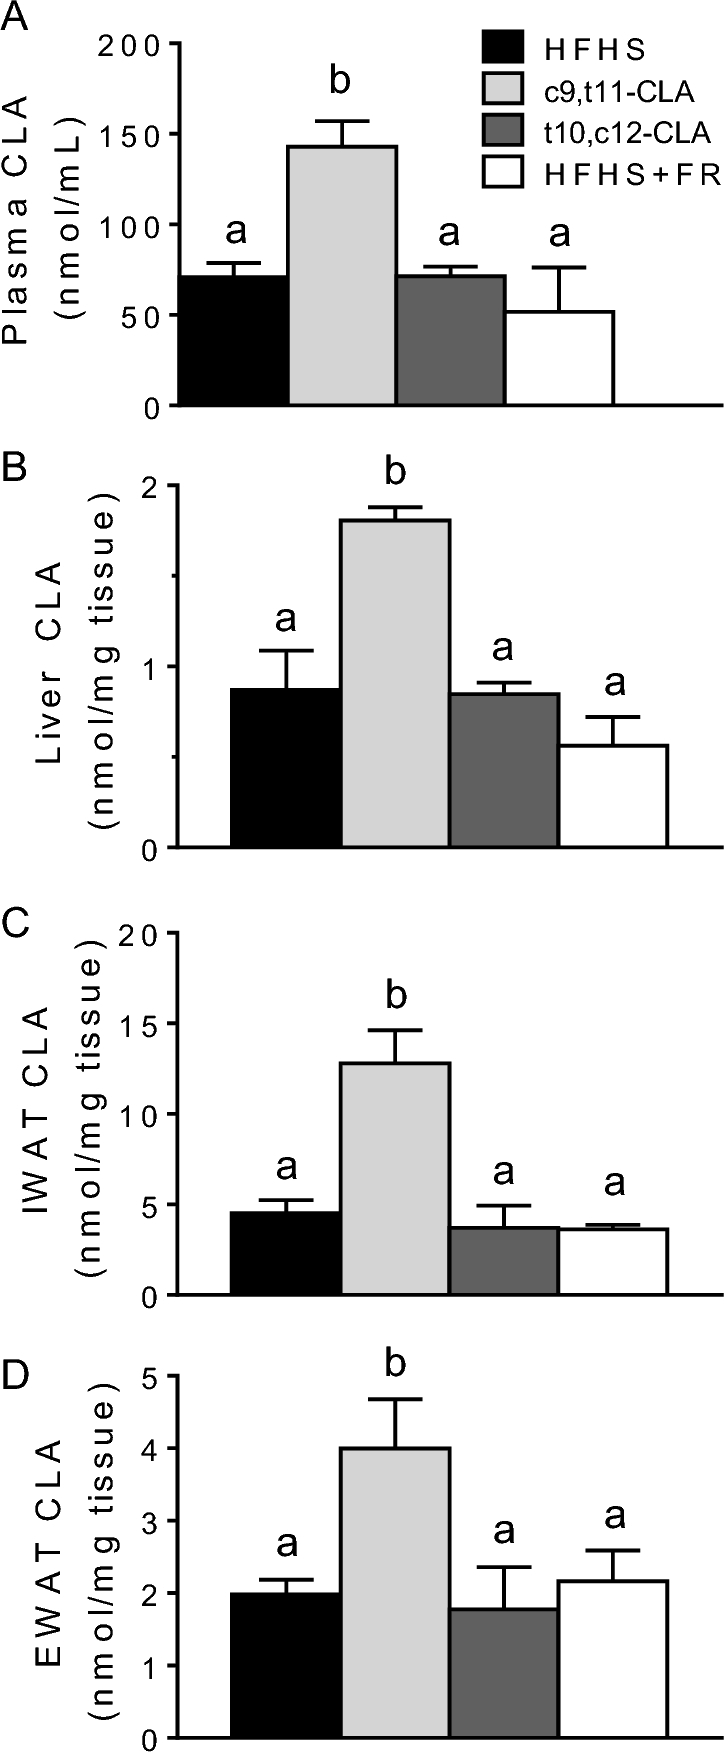
Plasma (A), liver (B), IWAT (C), and EWAT (D) CLA concentrations in obese mice fed an HFHS diet ad libitum alone or including c9,t11-CLA or t10,c12-CLA, or fed 75–85% of the ad libitum HFHS diet intake (FR) for 8 wk. Values are means + SEMs, n = 5–8 mice/group. Labeled means without a common letter differ, P < 0.05. CLA, conjugated linoleic acid; c9,t11-CLA, cis-9,trans-11 conjugated linoleic acid; EWAT, epididymal white adipose tissue; FR, food restriction; HFHS, high-fat, high-sucrose; IWAT, inguinal white adipose tissue; t10,c12-CLA, trans-10,cis-12 conjugated linoleic acid.
t10,c12-CLA supplementation increased expression of Gpr41 in the small intestine and altered fecal butyrate concentration
Next, we asked whether mice fed t10,c12-CLA showed an altered expression of genes essential for small intestinal energy harvest to explain the loss in body weight without a change in food intake, as well as the absence of elevated tissue CLA. The expression of macronutrient transporter genes including the major glucose transporters GLUT1 (Slc2a1) and sodium/glucose cotransporter SGLT1 (Slc5a1), genes encoding tight junctional proteins, such as occludin (Ocel1) or zonula occludens 1 (Tjp1), or inflammatory proteins such as TNF (Tnf) were not significantly different across the treatment groups (Supplemental Figure 1A). Protein concentrations of occludin were similarly unchanged by the dietary treatments (Supplemental Figure 1F, G), suggesting equivalence in small intestinal barrier function. However, G-protein–coupled receptor (GPR) 41, a major small intestinal SCFA receptor, was significantly more highly expressed in mice fed t10,c12-CLA than in those fed either c9,t11-CLA or that received FR (Figure 2A). Another SCFA receptor, GPR43, was not altered by any dietary treatment (Figure 2B). Taken together, these data suggest that the absence of CLA in t10,c12-CLA–supplemented mouse tissues was not likely due to reduced nutrient absorption in the gut.
FIGURE 2.

Gene expression of SCFA receptors Gpr41 (A) and Gpr43 (B) from the small intestine of obese mice fed an HFHS diet ad libitum alone or including c9,t11-CLA or t10,c12-CLA, or fed 75–85% of the ad libitum HFHS diet intake (FR) for 8 wk. SCFA concentrations in feces (C–E) and plasma (F) collected at baseline (12 wk of HFHS feeding) or again after 8 wk of HFHS, c9,t11-CLA, t10,c12-CLA, or FR in obese mice. The black symbols (C–E) represent mean values of treatment groups at each time point. Values are means + SEMs, n = 5–8 mice/group. Labeled means without a common letter differ, P < 0.05. CLA, conjugated linoleic acid; c9,t11-CLA, cis-9,trans-11 conjugated linoleic acid; FR, food restriction; Gpr, G-protein–coupled receptor; HFHS, high-fat, high-sucrose; t10,c12-CLA, trans-10,cis-12 conjugated linoleic acid.
Because Gpr41 expression increased with t10,c12-CLA, we quantified fecal SCFAs after 8 wk on the test diets. The gut microbiota ferments undigested carbohydrates into the SCFAs acetate (C2), propionate (C3), and butyrate (C4), representing 90–95% of all colonic SCFAs (34). These metabolites play an important role in shaping the composition of the gut microbiome as well as nourishing the host colonic epithelium and the microbiota itself (35) and also are reabsorbed, constituting 5–10% of calories absorbed by the host (36). As obesity progressed from baseline (12 wk of HFHS feeding) to 8 wk with the test diets, total SCFAs tended to increase for all groups (Figure 2C, Supplemental Figure 2). In mice fed t10,c12-CLA for 8 wk, butyrate increased significantly and to concentrations that were significantly higher than in mice receiving FR (Figure 2E). Notably, all mice fed t10,c12-CLA showed increased butyrate concentrations (Figure 2E). No changes in other fecal SCFAs were noted, with the exception that the less abundant SCFAs heptanoate and octanoate were significantly reduced by t10,c12-CLA (Supplemental Figure 2). Although butyrate was not a major component of plasma SCFAs, plasma acetate concentrations, representing ≥95% of total plasma SCFAs, significantly increased with t10,c12-CLA supplementation (Figure 2F). Collectively, these differences in fecal and plasma SCFA concentration after t10,c12-CLA supplementation, in particular the enrichment of butyrate and acetate, provide a possible mechanism for the impact of t10,c12-CLA on host metabolism.
t10,c12-CLA does not alter phylogenetic diversity of the intestinal microbiota
The changes in butyrate and acetate in the mice fed t10,c12-CLA suggest an altered gut microbiota, and because CLA can be produced by specific gut bacteria including Bifidobacteria (37, 38), variation in microbiota compositions could explain differences in the CLA concentration in tissues after c9,t11- or t10,c12-CLA–containing diets are consumed. As such, we next examined the fecal α diversity (i.e., the number of unique species per sample) of the gut microbiota from the treatment groups to determine whether microbial community richness was affected by the differing diets. At the final time point (8 wk after baseline), there were no significant differences in fecal α diversity between any of the HFHS-containing diets (Supplemental Figure 3A). However, α diversity, indicated by the trajectory of the slope of the rarefaction measure, significantly decreased over the course of the experiment for all HFHS-based groups, except in the mice that were fed t10,c12-CLA (Supplemental Figure 3B–E). α Diversity significantly decreased over time (baseline to 8 wk) by 12.0%, 10.9%, and 14.0% in the HFHS, c9,t11-CLA, and FR groups, respectively, and decreased by 7.6% (NS) in the group supplemented with t10,c12-CLA (Supplemental Figure 3B–E). These results suggest that t10,c12-CLA supplementation preserves microbial diversity over time to a greater extent than for the other dietary groups examined.
We next determined fecal microbial community structure by using unweighted Unifrac analysis, a distance metric used to compare biological communities (β diversity), in mice fed each of the test diets at the same 3 time points. This approach allows for the comparison of treatment groups with each other. With the use of principal coordinates analysis for visualization (Supplemental Figure 4A), some clustering by dietary groups was apparent after 8 wk with test diets, with noted significant differences (Table 1). In particular, the fecal community structure in the mice fed t10,c12-CLA differ significantly from that in the mice fed c9,t11-CLA or that received FR (Table 1). Examining fecal microbial populations for each test diet showed significant clustering by time point for the HFHS and c9,t11-CLA groups, but not for the t10,c12-CLA group (Supplemental Figure 4B–E, Table 1). For the HFHS+FR group, the time-related shifts were borderline, with the Adonis metric indicating significance whereas the more conservative Anosim did not. On the basis of the Anosim analysis, neither the t10,c12-CLA or HFHS+FR groups changed significantly over time (Table 1), providing evidence that the weight loss per se did not change the microbial population structures. Considering both the α- and β-diversity analyses, these results suggest that fecal microbial communities become progressively less diverse and more dissimilar as HFHS diet–induced obesity progresses, and that weight loss by t10,c12-CLA supplementation disrupts this trajectory.
t10,c12-CLA supplementation promoted an abundance of Allobaculum, Butyrivibrio, and Bifidobacterium over time, which were not enriched after FR-mediated weight loss
We next determined whether individual fecal microbial taxa differed between treatment groups, as well as over time. We first examined how fecal microbial taxa evolved over time during the course of each test diet (Figure 3). During the development of obesity with the HFHS diet, the gut microbiome became enriched in Bacteroides and Lactobacillus, with diminished Ruminococcus. Obese mice fed c9,t11-CLA became similarly enriched with Bacteroides as well as Gammaproteobacteria, with reduced Clostridia. Mice undergoing weight loss by FR also showed enrichment in Bacteroides after 8 wk, with a transient increase in Clostridia and Actinobacteria. Mice fed t10,c12-CLA showed the least change over time, which is consistent with our observations of unchanged α and β diversity (Supplemental Figures 3 and 4, Table 1). However, over time, the gut microbiota of the t10,c12-CLA–supplemented mice became enriched in Allobaculum, Bifidobacterium, and Butyrivibrio, with reductions in species from the Prevotella and Clostridium genera. Both the c9,t11- and the t10,c12-CLA diets led to a loss of Prevotella from baseline, and the c9,t11-CLA diet led to loss of Clostridia and other Firmicutes. In contrast, weight loss due to FR led to a loss of baseline Allobaculum, whereas t10,c12-CLA promoted blooming of Allobaculum species. By 8 wk, all of the diet groups showed a blooming of Bacteroides compared with baseline, except for the mice fed t10,c12-CLA.
FIGURE 3.

Linear discriminant analysis effect size comparison of microbiota variations in mice within treatment groups over time. Feces were collected at baseline (after 12 wk of HFHS feeding; blue) and again at 4 (red) or 8 (green) wk from the same mice after continued feeding of the HFHS diet alone (A) or including c9,t11-CLA (B) or t10,c12-CLA (C), or 75–85% of the ad libitum HFHS diet intake (FR) (D). Cladograms indicate the phylogenetic distribution of microbial lineages associated with each treatment group. Differences are represented by the color at the most abundant time point (yellow = NS). Each circle's diameter is proportional to the abundance of that taxon. Circles represent phylogenetic levels from domain to genus (inside to out). A strict strategy of multiclass analysis (1 class significantly different from others) was used (n = 6 mice/group × 3 time points). CLA, conjugated linoleic acid; c9,t11-CLA, cis-9,trans-11 conjugated linoleic acid; FR, food restriction; HFHS, high-fat, high-sucrose; LefSe, linear discriminant analysis effects size; t10,c12-CLA, trans-10,cis-12 conjugated linoleic acid.
Next, we compared the effects of all diets on microbial taxa at each time point (Supplemental Figure 5). As expected, there were no detectable differences in fecal microbial taxa between treatment groups at baseline. Four weeks after the diet switch, each group of mice showed specific taxa that were enriched, but only the enrichment in Bifidobacterium, a genus that was previously reported to produce CLA (39), persisted until 8 wk in the c9,t11-CLA group. t10,c12-CLA promoted a transient enrichment of Allobaculum after 4 wk, relative to the other treatment groups. Weight loss by FR promoted enrichment of Bacteroides, whereas obesogenic HFHS feeding led to a higher abundance of Clostridium and Lactobacillus. In summary, specific obesogenic and weight-loss–mediating diets promoted detectable changes in specific microbial taxa, including an abundance of Allobaculum, Butyrivibrio, and Bifidobacteria with t10,c12-CLA and enrichment of Bacteroides by FR.
Identification of taxonomic changes due to weight loss by t10,c12-CLA or FR
To more clearly define fecal taxonomic changes induced by weight loss, we examined pairwise comparisons between the t10,c12-CLA group and 1) HFHS alone (comparing weight loss with maintained obesity), 2) c9,t11-CLA (comparing weight loss with maintained obesity + CLA supplementation), and 3) HFHS + FR over time (comparing weight loss by 2 distinct mechanisms) (Supplemental Figure 6). In general, the t10,c12-CLA–fed mice showed a higher representation of Allobaculum and Butyrivibrio than all of the other groups. Comparing the t10,c12-CLA group with the HFHS-fed obese group showed relatively few taxonomic differences, but t10,c12-CLA treatment let to significantly increased abundance of Roseburia, known to produce butyrate (40) (Supplemental Figure 6B). Direct comparison between both CLA-containing diet groups showed significantly increased abundance of Butyrivibrio, another butyrate-producing species, in t10,c12-CLA–treated mice (Supplemental Figure 6B). The greatest differences in taxa at 8 wk, the end of the experiment, were between the mice that had undergone weight loss by either t10,c12-CLA or FR (Supplemental Figure 6B). Although FR mice showed a transient blooming of Clostridia and Enterococcus after 4 wk (Supplemental Figure 6A), the microbiota of t10,c12-CLA–fed mice was enriched with Lactobacillus, Actinobacteria, and Bifidobacterium by the end of the experiment. These results highlight key taxonomic differences in the microbiota of mice that underwent weight loss by 2 distinct mechanisms.
Comparison of the specific taxa overrepresented in the differing treatment groups encompassing 2 time points (4 and 8 wk) shows few significant differences between the HFHS+FR group and the HFHS group when compared with all other groups (Figure 4). The t10,c12-CLA–treated mice had the highest representation of Lactobacillus, Allobaculum, and Butyrivibrio when all time points are combined, and the c9,t11-CLA–fed mice showed the highest abundance of Bifidobacterium. Collectively, these data provide a linkage between the phenotypic changes observed with different modalities of weight loss with potential microbiota intermediaries.
FIGURE 4.

Linear discriminant analysis effect size comparison of microbiota variations in fecal samples from mice fed different diets. Feces were collected at baseline (after 12 wk of HFHS feeding; blue) and again at 4 (red) or 8 (green) wk from the same mice after continued feeding of the HFHS diet alone or including c9,t11-CLA or t10,c12-CLA, or 75–85% of the ad libitum HFHS diet intake (FR). The cladogram indicates the phylogenetic distribution of microbial lineages associated with each treatment group, with time points pooled. Taxonomic differences between treatment groups are represented by color, with the highest representation of particular taxa assigned the color of the corresponding treatment group (yellow = NS). Each circle's diameter is proportional to the abundance of that taxon. Circles represent phylogenetic levels from domain to genus (inside to out). A nonstrict strategy of multiclass analysis (≥1 class differential) was used (n = 6 mice/group × 3 time points). CLA, conjugated linoleic acid; c9,t11-CLA, cis-9,trans-11 conjugated linoleic acid; FR, food restriction; HFHS, high-fat, high-sucrose; t10,c12-CLA, trans-10,cis-12 conjugated linoleic acid.
Of particular interest, within the sequences annotated as Allobaculum, 2 new species representing the most prevalent sequences have been identified, and now have been named as Ileibacterium valens and Dubosiella newyorkensis (41). Both were associated with protection from adiposity in germ-free mice conventionalized with cecal contents from donors that had received subtherapeutic doses of penicillin or not (controls) (41). We now find that I. valens represents >58% of all Allobaculum sequences in this study, and levels were significantly higher at 4 and 8 wk in the mice in this study that received t10,c12-CLA compared with FR (Figure 5). Much of this difference is due to the reduction in I. valens in the FR mice over the course of the study.
FIGURE 5.
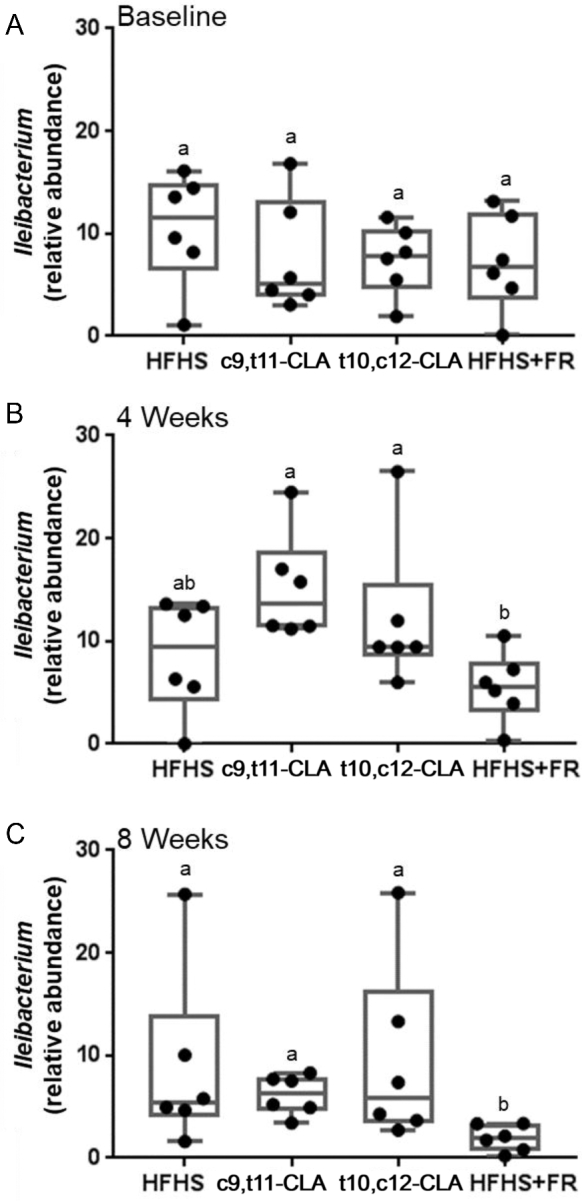
Comparisons of Ileibacterium valens relative abundance across 4 dietary groups at each of 3 time points. Feces were collected at baseline (after 12 wk of HFHS feeding), and again at 4 or 8 wk from the same mice after continued feeding of the HFHS diet alone or including c9,t11-CLA or t10,c12-CLA, or 75–85% of the ad libitum HFHS diet intake (FR). The horizontal lines represent the medians (IQRs) of Ileibacterium abundance in each treatment group at baseline (A), 4 wk (B), and 8 wk (C); whiskers represent the range of all samples. n = 6 mice/group. Labeled means without a common letter differ, P < 0.05. CLA, conjugated linoleic acid; c9,t11-CLA, cis-9,trans-11 conjugated linoleic acid; FR, food restriction; HFHS, high-fat, high-sucrose; t10,c12-CLA, trans-10,cis-12 conjugated linoleic acid.
Discussion
Dietary supplementation with t10,c12-CLA is known to promote weight loss by such mechanisms as the browning of white adipose tissue, with increased adipose tissue FA oxidation and energy expenditure (6, 7). As an extension of our previously published investigation, our current data show an altered gut microbiome in t10,c12-CLA–supplemented mice compared with mice that were fed an HFHS diet with or without c9,t11-CLA or FR. These differences suggest that the altered gut microbial composition might contribute to the observed weight loss by t10,c12-CLA supplementation. Importantly, these changes differ markedly from changes in the gut microbiota that result from an equivalent degree of weight loss as a result of FR.
Changes in host diet can substantially shape the gut microbiota (18, 42), raising the possibility that small dietary changes such as those implemented in the current study could have metabolic impact. The gut microbiota plays a role in host energy homeostasis by altering dietary energy harvest (43), intestinal permeability and subsequent systemic inflammation (44), and the intestinal hormonal milieu that regulates feeding and energy storage (17, 45). Metabolic phenotypes, including obesity, insulin resistance, and hepatic steatosis, have been associated with an altered microbiota (33, 46) as well as with particular gut microbial species (47, 48). Taken together, we now show that the metabolic phenotypes evoked through weight loss by 2 distinct dietary methods (t10,c12-CLA or FR) are associated with different gut microbial populations. Although we showed previously that the metabolic phenotype of mice undergoing FR was significantly improved (6), alterations in the gut microbiota of these mice could be due to the restriction of essential vitamins, minerals, or protein. Protein restriction has been shown to modulate gut barrier morphology and function (49, 50) and to reduce gut bacterial abundance (51); however, we found no evidence that the FR regimen we used had a negative impact on small intestinal barrier function. We speculate that the modest level of FR in these mice was not sufficient to negatively modulate gut morphology.
Our observation of a lack of CLA enrichment in plasma and tissues after t10,c12-CLA supplementation was somewhat surprising, but may be explained by 1) the inability to detect t10,c12-CLA with sufficient sensitivity, 2), rapid metabolism of t10,c12-CLA once absorbed, or 3) that dietary t10,c12-CLA promotes striking effects on body fat and energy expenditure without absorption by the host. t10,c12-CLA is known to enhance FA oxidation in adipose tissue (6, 52), where it could itself become oxidized and escape detection, but this does not explain its absence in plasma. We previously showed that t10,c12-CLA can be distinguished from c9,t11-CLA with the use of a highly sensitive NMR-based method that we developed (6). Therefore, it seems likely that t10,c12-CLA promotes its effects on energy balance in the gut. Our findings are supported by the observation that in human subjects taking commercial CLA supplements, which contain equal proportions of c9,t11- and t10,c12-CLA, only c9,t11-CLA is detected in plasma (53). Moreover, bacterial taxa including Bifidobacteria have linoleic acid isomerase activity, allowing local production of CLA in the gut (37–39, 54). Bifidobacteria also are commonly used as probiotics, due to reported inverse associations with obesity and type 2 diabetes (55, 56). We now show that mice fed c9,t11-CLA were the most enriched in Bifidobacteria, providing a further potential source of plasma and tissue CLA.
The known involvement of SCFAs in host energy and lipid metabolism has attracted recent attention. SCFAs are elevated in human obesity and contribute ≤10% of total ingested host calories (57, 58), yet SCFA supplementation has been shown to ameliorate diet-induced obesity (59–61). Butyrate supplementation of obese mice reduced diet-induced obesity and insulin resistance by promoting oxidation of fat and adaptive thermogenesis (62). Notably, t10,c12-CLA increases fecal butyrate and plasma acetate concentration and the expression of small intestinal Gpr41, a major SCFA receptor, with concurrent adipose tissue FA oxidation and increased energy expenditure (6), suggesting a possible role for butyrate or acetate in these effects. Consistent with this, Butyrivibrio fibrisolvens, the primary butyrate-producing bacterial species, was enriched in mice supplemented with t10,c12-CLA. However, that weight loss by FR did not lead to increased SCFAs suggests a specific t10,c12-CLA effect. Weight loss in humans reportedly does not affect total SCFA concentrations (63), but alters SCFA distribution, notably by increasing butyrate or propionate (64), suggesting that the ratio of particular SCFAs rather than their sum may be most important. Butyrate and propionate may induce the production of anorexigenic gut hormones, thus reducing food intake (60), and acetate may reduce appetite through direct central nervous system effects (65). Because t10,c12-CLA did not alter food intake in these mice (6), it is possible that SCFAs such as butyrate could play a role in t10,c12-CLA–induced weight loss by mechanisms unrelated to central regulation of food intake. Although butyrate is not a major systemic SCFA but instead exerts local effects in the gut (66), the observed increase in fecal butyrate and plasma acetate could reflect changes in the balance between butyrate- and acetate-producing bacteria or increased acetate uptake in the intestine. That we did not detect abnormalities in major macronutrient transporters in the small intestine suggests that t10,c12 CLA does not induce a malabsorptive phenotype. More direct studies are needed to determine if altered nutrient absorption or SCFAs in the gut of t10,c12-CLA–supplemented mice play a role in the observed weight-loss effects.
Mice supplemented with t10,c12-CLA also showed enrichment with Allobaculum. In previous studies, Allobaculum correlated negatively with adiposity and, in particular, with subcutaneous fat mass (33, 67), consistent with our observed association with reduced body weight and subcutaneous fat seen with t10,c12 CLA supplementation (6). Although Allobaculum has been reported to be associated with metabolically healthy weight loss in mice, characterized by improved insulin sensitivity and systemic inflammation (68), this taxon was not enriched by metabolically healthy FR in this model. Nevertheless, these studies indicate potential microbial intermediaries that could explain the effects of the t10,c12-CLA supplementation on weight loss and subcutaneous-specific fat loss.
Several previous studies found that CLA alters the gut microbiota by using substantially different supplementation models than we report. Chaplin et al. (69) reported that mice fed a high-fat diet (HFD) with CLA supplementation by oral gavage (equimolar c9,t11- and t10,c12-CLA) did not lose body weight but lost body fat compared with an HFD alone, with concurrent increases in Akkermansia muciniphila; in contrast, Bifidobacterium was not affected, despite exposure to c9,t11-CLA. Similarly, Marques et al. (70) supplemented lean feed pellet–fed mice with 0.5% t10,c12-CLA, finding significant reductions in visceral fat mass and increased cecal SCFAs including propionate and isobutyrate, with a higher proportion of Bacteroides, but no changes in body weight. Although both previous studies (69, 70) found that t10,c12-CLA increases fecal SCFAs, ours included an obese, more humanoid model of CLA-mediated weight loss with the use of a diet with a different macronutrient profile (6). We now identify additional microbial communities enriched by t10,c12-CLA and have clearly distinguished t10,c12-CLA–specific effects from those resulting from weight loss by FR.
We previously highlighted the metabolically distinct results of weight loss by using t10,c12-CLA supplementation compared with FR in obese mice (6). Notably, the weight loss induced by t10,c12-CLA resulted in a greater loss of subcutaneous white adipose tissue with high levels of FA oxidation, white adipose tissue browning, and increased energy expenditure, features that were unchanged or decreased with FR. However, weight loss by FR conferred beneficial effects on glucose metabolism by improving glucose and insulin tolerance, which were absent with t10,c12-CLA–mediated weight loss, suggesting that weight loss by FR is more metabolically beneficial than t10,c12-CLA supplementation (6). By directly comparing the gut microbiota in mice subjected to these 2 distinct weight-loss modalities, we found that t10,c12-CLA–treated mice had a higher representation of Bifidobacterium, Allobaculum, SCFA-producing Butyrivibrio, and Lactobacillus. Conversely, weight loss by FR promoted a higher representation of Clostridia and Enterococcus. It is notable that we could detect such substantial changes in microbial communities in both HFHS diet–based weight-loss models, despite the very small differences in dietary composition between t10,c12-CLA and FR. In comparisons with all 4 treatment groups, FR mice were enriched in Clostridia as well as Bacteroides, the latter of which has previously been shown in humans undergoing FR (9). FR has been shown to improve metabolic health (71, 72) and to extend life span (73). Furthermore, the HFD-fed mice undergoing FR exhibit particular gut microbiota changes (74), potentially linking FR effects to the microbiota. Our finding that the newly identified anaerobic species I. valens (41) was significantly reduced in FR compared with t10,c12-CLA–treated mice provides one potential direction to explain the differences in phenotype. Future studies will focus on these enriched microbial populations to differentiate the metabolic pathways involved in these 2 weight-loss modalities, which could shed light on current understanding with regard to “metabolically healthy” compared with “metabolically unhealthy” obesity and weight loss (75, 76).
In summary, we have shown that weight loss in obese mice by 2 distinct methods, t10,c12-CLA supplementation and FR, promotes notable differences in gut microbial communities. Moreover, weight loss induced by these 2 dietary approaches results in significantly different phenotypes (6), which were associated with our observed microbiota differences. Whether and how such alterations in gut microbiota mediate the different metabolic phenotypes evoked by each weight-loss method remain to be determined. Nevertheless, we provide potential pathways by which t10,c12-CLA supplementation may induce weight loss, which can be applied to future studies.
Supplementary Material
Acknowledgments
The authors’ responsibilities were as follows—LJdH, AKD, CFB, AC, and MJB: designed the experiments; LJdH, ZG, LG, SW, and AKD: conducted the experiments; LJdH, ZG, and AKD: data presentation and statistical analyses; LJdH and MJB: wrote the manuscript; LJdH: had responsibility for the final content; and all authors: read and approved the final manuscript.
Notes
Supported by funding from the NIH National Center for Complimentary and Integrative Health (K01 AT007177), the NIH National Institute of Diabetes and Digestive and Kidney Diseases (University of Washington Diabetes Research Center Pilot and Feasibility Award P30 DK017047, University of Michigan Pilot and Feasibility Award U24 DK097153, Nutrition Obesity Research Center Award P30 DK089503, and R01 DK090989), the Knapp Family, the Ziff Family, and C&D funds provided by anonymous donors to the New York University Medical Center.
Supplemental Tables 1–3 and Supplemental Figures 1–6 are available from the “Supplementary data” link in the online posting of the article and from the same link in the online table of contents at https://academic.oup.com/jn/.
Abbreviations used: CLA, conjugated linoleic acid; c9,t11-CLA, cis-9,trans-11 conjugated linoleic acid; FR, food restriction; GPR, G-protein–coupled receptor; HFD, high-fat diet; HFHS, high-fat, high-sucrose; Ldlr−/−, LDL receptor–deficient; OTU, operational taxonomic unit; t10,c12-CLA, trans-10,cis-12 conjugated linoleic acid.
References
- 1. Flegal KM, Carroll MD, Kit BK, Ogden CL. Prevalence of obesity and trends in the distribution of body mass index among US adults, 1999–2010. JAMA 2012;307:491–7. [DOI] [PubMed] [Google Scholar]
- 2. Hursting SD, Lavigne JA, Berrigan D, Perkins SN, Barrett JC. Calorie restriction, aging, and cancer prevention: mechanisms of action and applicability to humans. Annu Rev Med 2003;54:131–52. [DOI] [PubMed] [Google Scholar]
- 3. Silveira MB, Carraro R, Monereo S, Tébar J. Conjugated linoleic acid (CLA) and obesity. Public Health Nutr 2007;10:1181–6. [DOI] [PubMed] [Google Scholar]
- 4. Park Y, Storkson JM, Albright KJ, Liu W, Pariza MW. Evidence that the trans-10,cis-12 isomer of conjugated linoleic acid induces body composition changes in mice. Lipids 1999;34:235–41. [DOI] [PubMed] [Google Scholar]
- 5. Subramanian S, Han C, Chiba T, McMillen T, Wang S, Haw Ar, Kirk E, O'Brien K, Chait A. Dietary cholesterol worsens adipose tissue macrophage accumulation and atherosclerosis in obese LDL receptor-deficient mice. Arterioscler Thromb Vasc Biol 2008;28:685–91. [DOI] [PMC free article] [PubMed] [Google Scholar]
- 6. den Hartigh LJ, Wang S, Goodspeed L, Wietecha T, Houston B, Omer M, Ogimoto K, Subramanian S, Gowda GA, O'Brien KD, et al. Metabolically distinct weight loss by 10,12 CLA and caloric restriction highlight the importance of subcutaneous white adipose tissue for glucose homeostasis in mice. PLoS One 2017;12:e0172912. [DOI] [PMC free article] [PubMed] [Google Scholar]
- 7. Shen W, Baldwin J, Collins B, Hixson L, Lee KT, Herberg T, Starnes J, Cooney P, Chuang CC, Hopkins R, et al. Low level of trans-10, cis-12 conjugated linoleic acid decreases adiposity and increases browning independent of inflammatory signaling in overweight Sv129 mice. J Nutr Biochem 2015;26:616–25. [DOI] [PMC free article] [PubMed] [Google Scholar]
- 8. Turnbaugh PJ, Bäckhed F, Fulton L, Gordon JI. Diet-induced obesity is linked to marked but reversible alterations in the mouse distal gut microbiome. Cell Host Microbe 2008;3:213–23. [DOI] [PMC free article] [PubMed] [Google Scholar]
- 9. Ley RE, Turnbaugh PJ, Klein S, Gordon JI. Microbial ecology: human gut microbes associated with obesity. Nature 2006;444:1022–3. [DOI] [PubMed] [Google Scholar]
- 10. Drissi F, Raoult D, Merhej V. Metabolic role of lactobacilli in weight modification in humans and animals. Microb Pathog 2017;106:182–94. [DOI] [PubMed] [Google Scholar]
- 11. Bäckhed F, Ding H, Wang T, Hooper LV, Koh GY, Nagy A, Semenkovich CF, Gordon JI. The gut microbiota as an environmental factor that regulates fat storage. Proc Natl Acad Sci USA 2004;101:15718–23. [DOI] [PMC free article] [PubMed] [Google Scholar]
- 12. Krajmalnik-Brown R, Ilhan ZE, Kang DW, DiBaise JK. Effects of gut microbes on nutrient absorption and energy regulation. Nutr Clin Pract 2012;27:201–14. [DOI] [PMC free article] [PubMed] [Google Scholar]
- 13. Ridaura VK, Faith JJ, Rey FE, Cheng J, Duncan AE, Kau AL, Griffin NW, Lombard V, Henrissat B, Bain JR, et al. Gut microbiota from twins discordant for obesity modulate metabolism in mice. Science 2013;341:1241214. [DOI] [PMC free article] [PubMed] [Google Scholar]
- 14. Turnbaugh PJ, Ley RE, Mahowald MA, Magrini V, Mardis ER, Gordon JI. An obesity-associated gut microbiome with increased capacity for energy harvest. Nature 2006;444:1027–31. [DOI] [PubMed] [Google Scholar]
- 15. Cani PD, Possemiers S, Van de Wiele T, Guiot Y, Everard A, Rottier O, Geurts L, Naslain D, Neyrinck A, Lambert DM, et al. Changes in gut microbiota control inflammation in obese mice through a mechanism involving GLP-2-driven improvement of gut permeability. Gut 2009;58:1091–103. [DOI] [PMC free article] [PubMed] [Google Scholar]
- 16. Khan MJ, Gerasimidis K, Edwards CA, Shaikh MG. Role of gut microbiota in the aetiology of obesity: proposed mechanisms and review of the literature. J Obes 2016;2016:7353642. [DOI] [PMC free article] [PubMed] [Google Scholar]
- 17. Zhou J, Martin RJ, Tulley RT, Raggio AM, McCutcheon KL, Shen L, Danna SC, Tripathy S, Hegsted M, Keenan MJ. Dietary resistant starch upregulates total GLP-1 and PYY in a sustained day-long manner through fermentation in rodents. Am J Physiol Endocrinol Metab 2008;295:E1160–6. [DOI] [PMC free article] [PubMed] [Google Scholar]
- 18. Ravussin Y, Koren O, Spor A, LeDuc C, Gutman R, Stombaugh J, Knight R, Ley RE, Leibel RL. Responses of gut microbiota to diet composition and weight loss in lean and obese mice. Obesity (Silver Spring) 2012;20:738–47. [DOI] [PMC free article] [PubMed] [Google Scholar]
- 19. Butteiger DN, Hibberd AA, McGraw NJ, Napawan N, Hall-Porter JM, Krul ES. Soy protein compared with milk protein in a western diet increases gut microbial diversity and reduces serum lipids in Golden Syrian hamsters. J Nutr 2016;146:697–705. [DOI] [PubMed] [Google Scholar]
- 20. Bligh EG, Dyer WJ. A rapid method of total lipid extraction and purification. Can J Biochem Physiol 1959;37:911–7. [DOI] [PubMed] [Google Scholar]
- 21. Morrison WR, Smith LM. Preparation of fatty acid methyl esters and dimethylacetals from lipids with boron fluoride-methanol. J Lipid Res 1964;5:600–8. [PubMed] [Google Scholar]
- 22. den Hartigh LJ, Altman R, Norman JE, Rutledge JC. Postprandial VLDL lipolysis products increase monocyte adhesion and lipid droplet formation via activation of ERK2 and NFκB. Am J Physiol Heart Circ Physiol 2014;306:H109–20. [DOI] [PMC free article] [PubMed] [Google Scholar]
- 23. Caporaso JG, Lauber CL, Walters WA, Berg-Lyons D, Huntley J, Fierer N, Owens SM, Betley J, Fraser L, Bauer M, et al. Ultra-high-throughput microbial community analysis on the Illumina HiSeq and MiSeq platforms. ISME J 2012;6:1621–4. [DOI] [PMC free article] [PubMed] [Google Scholar]
- 24. Walters WA, Caporaso JG, Lauber CL, Berg-Lyons D, Fierer N, Knight R. PrimerProspector: de novo design and taxonomic analysis of barcoded polymerase chain reaction primers. Bioinformatics 2011;27:1159–61. [DOI] [PMC free article] [PubMed] [Google Scholar]
- 25. Nobel YR, Cox LM, Kirigin FF, Bokulich NA, Yamanishi S, Teitler I, Chung J, Sohn J, Barber CM, Goldfarb DS, et al. Metabolic and metagenomic outcomes from early-life pulsed antibiotic treatment. Nat Commun 2015;6:7486. [DOI] [PMC free article] [PubMed] [Google Scholar]
- 26. Caporaso JG, Kuczynski J, Stombaugh J, Bittinger K, Bushman FD, Costello EK, Fierer N, Peña AG, Goodrich JK, Gordon JI, et al. QIIME allows analysis of high-throughput community sequencing data. Nat Methods 2010;7:335–6. [DOI] [PMC free article] [PubMed] [Google Scholar]
- 27. Yatsunenko T, Rey FE, Manary MJ, Trehan I, Dominguez-Bello MG, Contreras M, Magris M, Hidalgo G, Baldassano RN, Anokhin AP, et al. Human gut microbiome viewed across age and geography. Nature 2012;486:222–7. [DOI] [PMC free article] [PubMed] [Google Scholar]
- 28. Edgar RC. Search and clustering orders of magnitude faster than BLAST. Bioinformatics 2010;26:2460–1. [DOI] [PubMed] [Google Scholar]
- 29. DeSantis TZ, Hugenholtz P, Larsen N, Rojas M, Brodie EL, Keller K, Huber T, Dalevi D, Hu P, Andersen GL. Greengenes, a chimera-checked 16S rRNA gene database and workbench compatible with ARB. Appl Environ Microbiol 2006;72:5069–72. [DOI] [PMC free article] [PubMed] [Google Scholar]
- 30. McDonald D, Price MN, Goodrich J, Nawrocki EP, DeSantis TZ, Probst A, Andersen GL, Knight R, Hugenholtz P. An improved Greengenes taxonomy with explicit ranks for ecological and evolutionary analyses of bacteria and archaea. ISME J 2012;6:610–8. [DOI] [PMC free article] [PubMed] [Google Scholar]
- 31. Lozupone CA, Hamady M, Kelley ST, Knight R. Quantitative and qualitative beta diversity measures lead to different insights into factors that structure microbial communities. Appl Environ Microbiol 2007;73:1576–85. [DOI] [PMC free article] [PubMed] [Google Scholar]
- 32. Segata N, Izard J, Waldron L, Gevers D, Miropolsky L, Garrett WS, Huttenhower C. Metagenomic biomarker discovery and explanation. Genome Biol 2011;12:R60. [DOI] [PMC free article] [PubMed] [Google Scholar]
- 33. Cox LM, Yamanishi S, Sohn J, Alekseyenko AV, Leung JM, Cho I, Kim SG, Li H, Gao Z, Mahana D, et al. Altering the intestinal microbiota during a critical developmental window has lasting metabolic consequences. Cell 2014;158:705–21. [DOI] [PMC free article] [PubMed] [Google Scholar]
- 34. Cook SI, Sellin JH. Review article: short chain fatty acids in health and disease. Aliment Pharmacol Ther 1998;12:499–507. [DOI] [PubMed] [Google Scholar]
- 35. Ríos-Covián D, Ruas-Madiedo P, Margolles A, Gueimonde M, de Los Reyes-Gavilán CG, Salazar N. Intestinal short chain fatty acids and their link with diet and human health. Front Microbiol 2016;7:185. [DOI] [PMC free article] [PubMed] [Google Scholar]
- 36. Bergman EN. Energy contributions of volatile fatty acids from the gastrointestinal tract in various species. Physiol Rev 1990;70:567–90. [DOI] [PubMed] [Google Scholar]
- 37. Russell DA, Ross RP, Fitzgerald GF, Stanton C. Metabolic activities and probiotic potential of bifidobacteria. Int J Food Microbiol 2011;149:88–105. [DOI] [PubMed] [Google Scholar]
- 38. Coakley M, Banni S, Johnson MC, Mills S, Devery R, Fitzgerald G, Paul Ross R, Stanton C. Inhibitory effect of conjugated alpha-linolenic acid from bifidobacteria of intestinal origin on SW480 cancer cells. Lipids 2009;44:249–56. [DOI] [PubMed] [Google Scholar]
- 39. Raimondi S, Amaretti A, Leonardi A, Quartieri A, Gozzoli C, Rossi M. Conjugated linoleic acid production by bifidobacteria: screening, kinetic, and composition. Biomed Res Int 2016;2016:8654317. [DOI] [PMC free article] [PubMed] [Google Scholar]
- 40. Van den Abbeele P, Belzer C, Goossens M, Kleerebezem M, De Vos WM, Thas O, De Weirdt R, Kerckhof FM, Van de Wiele T. Butyrate-producing Clostridium cluster XIVa species specifically colonize mucins in an in vitro gut model. ISME J 2013;7:949–61. [DOI] [PMC free article] [PubMed] [Google Scholar]
- 41. Cox LM, Sohn J, Tyrrell KL, Citron DM, Lawson PA, Patel NB, Iizumi T, Perez-Perez GI, Goldstein EJC, Blaser MJ. Description of two novel members of the family Erysipelotrichaceae: Ileibacteriumvalens gen. nov., sp. nov. and Dubosiella newyorkensis, gen. nov., sp. nov., from the murine intestine, and emendation to the description of Faecalibacterium rodentium. Int J Syst Evol Microbiol 2017;67:1247–54. [DOI] [PMC free article] [PubMed] [Google Scholar]
- 42. Serino M, Luche E, Chabo C, Amar J, Burcelin R. Intestinal microflora and metabolic diseases. Diabetes Metab 2009;35:262–72. [DOI] [PubMed] [Google Scholar]
- 43. Bäckhed F, Ley RE, Sonnenburg JL, Peterson DA, Gordon JI. Host-bacterial mutualism in the human intestine. Science 2005;307:1915–20. [DOI] [PubMed] [Google Scholar]
- 44. Cani PD, Amar J, Iglesias MA, Poggi M, Knauf C, Bastelica D, Neyrinck AM, Fava F, Tuohy KM, Chabo C, et al. Metabolic endotoxemia initiates obesity and insulin resistance. Diabetes 2007;56:1761–72. [DOI] [PubMed] [Google Scholar]
- 45. Wichmann A, Allahyar A, Greiner TU, Plovier H, Lundén G, Larsson T, Drucker DJ, Delzenne NM, Cani PD, Bäckhed F. Microbial modulation of energy availability in the colon regulates intestinal transit. Cell Host Microbe 2013;14:582–90. [DOI] [PubMed] [Google Scholar]
- 46. Mahana D, Trent CM, Kurtz ZD, Bokulich NA, Battaglia T, Chung J, Müller CL, Li H, Bonneau RA, Blaser MJ. Antibiotic perturbation of the murine gut microbiome enhances the adiposity, insulin resistance, and liver disease associated with high-fat diet. Genome Med 2016;8:48. [DOI] [PMC free article] [PubMed] [Google Scholar]
- 47. Murphy EF, Cotter PD, Healy S, Marques TM, O'Sullivan O, Fouhy F, Clarke SF, O'Toole PW, Quigley EM, Stanton C, et al. Composition and energy harvesting capacity of the gut microbiota: relationship to diet, obesity and time in mouse models. Gut 2010;59:1635–42. [DOI] [PubMed] [Google Scholar]
- 48. Schwiertz A, Taras D, Schäfer K, Beijer S, Bos NA, Donus C, Hardt PD. Microbiota and SCFA in lean and overweight healthy subjects. Obesity (Silver Spring) 2010;18:190–5. [DOI] [PubMed] [Google Scholar]
- 49. Belmonte L, Coëffier M, Le Pessot F, Miralles-Barrachina O, Hiron M, Leplingard A, Lemeland JF, Hecketsweiler B, Daveau M, Ducrotté P, et al. Effects of glutamine supplementation on gut barrier, glutathione content and acute phase response in malnourished rats during inflammatory shock. World J Gastroenterol 2007;13:2833–40. [DOI] [PMC free article] [PubMed] [Google Scholar]
- 50. Welsh FK, Farmery SM, MacLennan K, Sheridan MB, Barclay GR, Guillou PJ, Reynolds JV. Gut barrier function in malnourished patients. Gut 1998;42:396–401. [DOI] [PMC free article] [PubMed] [Google Scholar]
- 51. Katayama M, Xu D, Specian RD, Deitch EA. Role of bacterial adherence and the mucus barrier on bacterial translocation: effects of protein malnutrition and endotoxin in rats. Ann Surg 1997;225:317–26. [DOI] [PMC free article] [PubMed] [Google Scholar]
- 52. den Hartigh LJ, Han CY, Wang S, Omer M, Chait A. 10E,12Z-conjugated linoleic acid impairs adipocyte triglyceride storage by enhancing fatty acid oxidation, lipolysis, and mitochondrial reactive oxygen species. J Lipid Res 2013;54:2964–78. [DOI] [PMC free article] [PubMed] [Google Scholar]
- 53. Zlatanos SN, Laskaridis K, Sagredos A. Conjugated linoleic acid content of human plasma. Lipids Health Dis 2008;7:34. [DOI] [PMC free article] [PubMed] [Google Scholar]
- 54. Ewaschuk JB, Walker JW, Diaz H, Madsen KL. Bioproduction of conjugated linoleic acid by probiotic bacteria occurs in vitro and in vivo in mice. J Nutr 2006;136:1483–7. [DOI] [PubMed] [Google Scholar]
- 55. Kalliomäki M, Collado MC, Salminen S, Isolauri E. Early differences in fecal microbiota composition in children may predict overweight. Am J Clin Nutr 2008;87:534–8. [DOI] [PubMed] [Google Scholar]
- 56. Wu X, Ma C, Han L, Nawaz M, Gao F, Zhang X, Yu P, Zhao C, Li L, Zhou A, et al. Molecular characterisation of the faecal microbiota in patients with type II diabetes. Curr Microbiol 2010;61:69–78. [DOI] [PubMed] [Google Scholar]
- 57. Rahat-Rozenbloom S, Fernandes J, Gloor GB, Wolever TM. Evidence for greater production of colonic short-chain fatty acids in overweight than lean humans. Int J Obes (Lond) 2014;38:1525–31. [DOI] [PMC free article] [PubMed] [Google Scholar]
- 58. Payne AN, Chassard C, Zimmermann M, Müller P, Stinca S, Lacroix C. The metabolic activity of gut microbiota in obese children is increased compared with normal-weight children and exhibits more exhaustive substrate utilization. Nutr Diabetes 2011;1:e12. [DOI] [PMC free article] [PubMed] [Google Scholar]
- 59. den Besten G, Bleeker A, Gerding A, van Eunen K, Havinga R, van Dijk TH, Oosterveer MH, Jonker JW, Groen AK, Reijngoud DJ, et al. Short-chain fatty acids protect against high-fat diet-induced obesity via a PPARγ-dependent switch from lipogenesis to fat oxidation. Diabetes 2015;64:2398–408. [DOI] [PubMed] [Google Scholar]
- 60. Lin HV, Frassetto A, Kowalik EJ, Nawrocki AR, Lu MM, Kosinski JR, Hubert JA, Szeto D, Yao X, Forrest G, et al. Butyrate and propionate protect against diet-induced obesity and regulate gut hormones via free fatty acid receptor 3-independent mechanisms. PLoS One 2012;7:e35240. [DOI] [PMC free article] [PubMed] [Google Scholar]
- 61. Lu Y, Fan C, Li P, Chang X, Qi K. Short chain fatty acids prevent high-fat-diet-induced obesity in mice by regulating G protein-coupled receptors and gut microbiota. Sci Rep 2016;6:37589. [DOI] [PMC free article] [PubMed] [Google Scholar]
- 62. Gao Z, Yin J, Zhang J, Ward RE, Martin RJ, Lefevre M, Cefalu WT, Ye J. Butyrate improves insulin sensitivity and increases energy expenditure in mice. Diabetes 2009;58:1509–17. [DOI] [PMC free article] [PubMed] [Google Scholar]
- 63. Brinkworth GD, Noakes M, Clifton PM, Bird AR. Comparative effects of very low-carbohydrate, high-fat and high-carbohydrate, low-fat weight-loss diets on bowel habit and faecal short-chain fatty acids and bacterial populations. Br J Nutr 2009;101:1493–502. [DOI] [PubMed] [Google Scholar]
- 64. Damms-Machado A, Mitra S, Schollenberger AE, Kramer KM, Meile T, Königsrainer A, Huson DH, Bischoff SC. Effects of surgical and dietary weight loss therapy for obesity on gut microbiota composition and nutrient absorption. Biomed Res Int 2015;2015:806248. [DOI] [PMC free article] [PubMed] [Google Scholar]
- 65. Frost G, Sleeth ML, Sahuri-Arisoylu M, Lizarbe B, Cerdan S, Brody L, Anastasovska J, Ghourab S, Hankir M, Zhang S, et al. The short-chain fatty acid acetate reduces appetite via a central homeostatic mechanism. Nat Commun 2014;5:3611. [DOI] [PMC free article] [PubMed] [Google Scholar]
- 66. Cummings JH, Pomare EW, Branch WJ, Naylor CP, Macfarlane GT. Short chain fatty acids in human large intestine, portal, hepatic and venous blood. Gut 1987;28:1221–7. [DOI] [PMC free article] [PubMed] [Google Scholar]
- 67. Baldwin J, Collins B, Wolf PG, Martinez K, Shen W, Chuang CC, Zhong W, Cooney P, Cockrell C, Chang E, et al. Table grape consumption reduces adiposity and markers of hepatic lipogenesis and alters gut microbiota in butter fat-fed mice. J Nutr Biochem 2016;27:123–35. [DOI] [PMC free article] [PubMed] [Google Scholar]
- 68. Zhang X, Zhao Y, Zhang M, Pang X, Xu J, Kang C, Li M, Zhang C, Zhang Z, Zhang Y, et al. Structural changes of gut microbiota during berberine-mediated prevention of obesity and insulin resistance in high-fat diet-fed rats. PLoS One 2012;7:e42529. [DOI] [PMC free article] [PubMed] [Google Scholar]
- 69. Chaplin A, Parra P, Serra F, Palou A. Conjugated linoleic acid supplementation under a high-fat diet modulates stomach protein expression and intestinal microbiota in adult mice. PLoS One 2015;10:e0125091. [DOI] [PMC free article] [PubMed] [Google Scholar]
- 70. Marques TM, Wall R, O'Sullivan O, Fitzgerald GF, Shanahan F, Quigley EM, Cotter PD, Cryan JF, Dinan TG, Ross RP, et al. Dietary trans-10, cis-12-conjugated linoleic acid alters fatty acid metabolism and microbiota composition in mice. Br J Nutr 2015:1–11. [DOI] [PubMed] [Google Scholar]
- 71. Redman LM, Ravussin E. Caloric restriction in humans: impact on physiological, psychological, and behavioral outcomes. Antioxid Redox Signal 2011;14:275–87. [DOI] [PMC free article] [PubMed] [Google Scholar]
- 72. Bales CW, Kraus WE. Caloric restriction: implications for human cardiometabolic health. J Cardiopulm Rehabil Prev 2013 2013;33:201–8. [DOI] [PMC free article] [PubMed] [Google Scholar]
- 73. Heilbronn LK, Ravussin E. Calorie restriction and aging: review of the literature and implications for studies in humans. Am J Clin Nutr 2003;78:361–9. [DOI] [PubMed] [Google Scholar]
- 74. Zhang C, Li S, Yang L, Huang P, Li W, Wang S, Zhao G, Zhang M, Pang X, Yan Z, et al. Structural modulation of gut microbiota in life-long calorie-restricted mice. Nat Commun 2013;4:2163. [DOI] [PMC free article] [PubMed] [Google Scholar]
- 75. Alam I, Ng TP, Larbi A. Does inflammation determine whether obesity is metabolically healthy or unhealthy? The aging perspective. Mediators Inflamm 2012;2012:456456. [DOI] [PMC free article] [PubMed] [Google Scholar]
- 76. Denis GV, Obin MS “Metabolically healthy obesity”: origins and implications. Mol Aspects Med 2013;34:59–70. [DOI] [PMC free article] [PubMed] [Google Scholar]
Associated Data
This section collects any data citations, data availability statements, or supplementary materials included in this article.