

Abstract
The low-cost Open qPCR instrument can be used for three different tasks in the aptamer selection process: quantification of DNA, cyclecourse optimization, and final binding characterization. We have selected aptamers against whole Drosophila C virus (DCV) particles and recombinant Epidermal Growth Factor Receptor (EGFR). We performed systematic evolution of ligands by exponential enrichment (SELEX) using qPCR to optimize each amplification step. The Open qPCR instrument identified the best aptamer candidate. The Open qPCR has the capacity to perform melt curves, and we used this function to perform thermofluorimetric analysis (TFA) to quantify target-aptamer binding. We confirmed the validity of the binding of DCV-aptamer using flow cytometry. A sandwich type luminescence bioassay based on our aptamer was sensitive to DCV and did not respond to a related virus, demonstrating that our selected aptamer can be used to specifically detect DCV.
Keywords: SELEX, aptamers, Drosophila C virus, EGFR, high throughput sequencing, thermofluorimetric analysis, binding curve

INTRODUCTION
We set out to show that a qPCR technique could be used to simplify and reduce the expense and improve the efficiency of aptamer selection and characterization (e.g. relative to P-32 detection). The Open qPCR is a qPCR instrument for performing quantitative PCR with real time monitoring of fluorescence. Chai Biotechnologies used “open source” principles to design the instrument (as in open source software). Examples of open source scientific software include Python, R, and ImageJ. Applying the open source approach to hardware has benefits relative to fully proprietary hardware. Open source scientific hardware (OSSH) design provides complete information to reconstruct an instrument1. This disclosure makes instruments cheaper and more customizable and reproducible. Open hardware is an emerging field with examples in 3D printing (RepRap) and single board computers (Raspberry Pi)2. The Open qPCR instrument operates with closed PCR tube strips (2 strips of 8 samples each). The tubes contain the sample and reagents. A Blue LED illuminates the top of each tube through a heated lid. Fluorescence is measured from the side of the bottom of the tube.
Aptamers are single-stranded (ss) DNA or RNA molecules that bind to a target with high affinity and specificity3. In the past two decades, researchers have generated aptamers for the detection of proteins4, small molecules5, whole cells6, and whole viruses7, among other targets. The specific binding ability of aptamers to diverse targets make them important reagents for clinical detection, bio-imaging, and therapeutics8,9. We performed aptamer selections against Drosophila C virus (DCV) and Epidermal Growth Factor Receptor (EGFR). DCV is a positive-sense RNA viral pathogen affecting the widely-studied model organism Drosophila melanogaster. The study of this virus is important to the investigation of antiviral host defense in fruit flies10–12. An aptamer against DCV can be used for rapid and cost-effective detection of infected flies to help researchers study the effects of DCV on its host; this is the first instance of an anti-DCV aptamer. EGFR is overexpressed in many cancer cells and is a biomarker for early cancer detection and a target for cancer therapeutics13. An RNA aptamer against EGFR was selected in 201114.
SELEX (Systematic Evolution of Ligands by Exponential Enrichment) is the method for generating aptamers. Ellington11 and Tuerck15,16 first introduced SELEX in 1990. In brief, the process starts with a ssDNA library consisting of a 30-80bp random sequence region flanked by primer binding sites. Some members of this randomized DNA library bind to a target. A target immobilized on a solid support separates bound DNA from unbound DNA. After elution and amplificaiton with PCR, the pool contains a higher proportion of binding DNA. After multiple rounds of binding and amplificaiton, the pool converges on high-affinity aptamers. The overall SELEX process is time-consuming with classical SELEX experiments taking months to move from a pool to the identification of a highly specific and high-affinity binding aptamer3.
Since 1990, many groups have built upon SELEX. Cell-SELEX is a technique that generates aptamers against cell surface biomarkers6,17,18. This technique uses whole living cells as targets to select aptamers. Whole-virus SELEX is the analogous technique that generates virus-specific aptamers19. Next-generation sequencing improved the speed and success rate of aptamer selections3,20. Integration of SELEX on microfluidic chips also made SELEX faster21,22. Rapid-SELEX23 used multiple rounds of selection without amplification. CE-SELEX24 used the rapid mode of capillary electrophoresis to separate binding DNA. All of these methods can benefit from a method to optimize the number of PCR cycles and quantify the DNA pool at each step.
In the present study, we performed eight rounds of classical selection using whole virus immobilized on magnetic microparticles for virus DCV. We performed four rounds of classical selection with recombinant EGFR immobilized on magnetic particles. We characterized the pool with high throughput sequencing (HTS)25. Each round required only two days of effort. We chose to select DNA aptamers because they are more stable than RNA aptamers, which have a 2’-OH group that can attack the phosphodiester linkage leading to hydrolysis of RNA aptamers3,26. DNA aptamers also have the advantage of being more easily synthesized with modifications for various immobilization and detection schemes.
We have demonstrated the use of the low cost Open qPCR in many aspects of in vitro aptamer selection including quantification of ssDNA after each round of selection, optimization, screening and characterization. Optimization with Open qPCR will make aptamer generation more efficient and reduce failure due to over- or under-amplification (traditionally, PCR and gel electrophoresis must be run at a range of cycles to optimize amplification for each round of selection). The use of the Open qPCR will bring SELEX to more laboratories including undergraduate serving institutions where high cost capital equipment may be a limiting factor. We also present three novel findings: 1) Thermofluorimetry analysis can build a binding curve and determine binding constant even in the presence of interference from endogenous fluorescence; 2) We selected the first anti-DCV aptamer with micromolar range dissociation constant (Kd of 0.3 ± 0.1 μM); and 3) we selected a new DNA aptamer against EGFR with a Kd of 9 ± 3 nM which is stronger than previously published DNA aptamers against EGFR by a significant margin27.
RESULTS AND DISCUSSION
Aptamer Selection Procedure with Open qPCR
We generated aptamers, using our in vitro selection technique with Open qPCR, as molecular recognition elements to detect the presence of target (DCV or EGFR). Figure 1 shows an outline of the SELEX procedure. We used magnetic microspheres coated with target for positive selection (denoted “positive selection microspheres”). We coated magnetic microspheres with non-target (a related virus, DXV, or a related recombinant protein, IgG1-FC) for negative selection (denoted “negative selection microspheres”).
Figure 1:
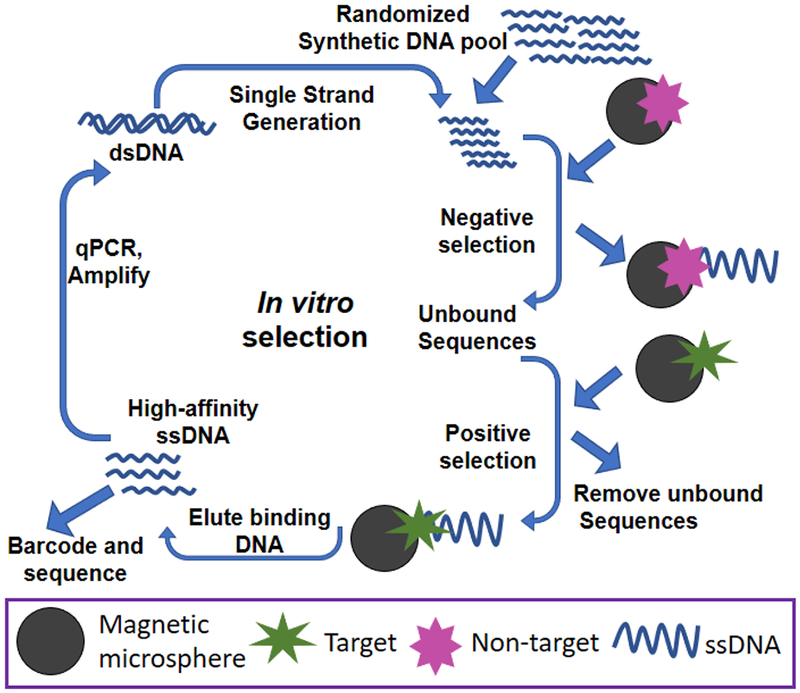
Schematic illustration of SELEX
We used the Open qPCR to optimize the number of cycles for PCR amplification. If PCR is not optimized, the yield will be prohibitively low (too few cycles) or contaminated with unwanted product (too many cycles). Very small amounts of parasitic amplicons (especially primer dimers) carried through from round to round can poison a selection. These amplicons can amplify much more efficiently and consume primer and NTP, reducing the yield of desired product. After several rounds of contaminated selection, the whole laboratory can become contaminated with these efficient replicators, rendering a pool useless. Reducing parasitic amplicon formation in the first place is a very valuable practice. We used the number of cycles that produced 50-75% of maximal fluorescence by the Open qPCR. Although contamination is a significant concern for any qPCR application, it can be minimized by careful handling of samples and immediate disposal of qPCR samples. We take the additional precaution of never opening qPCR samples. Samples carried through for further use are amplified by conventional PCR with an optimal number of cycles. After amplification, we carried out single-strand generation using copolymerization and electrophoresis27 to regenerate the pool. We amplified bound DNA at larger scale using a standard thermocycler and the number of cycles determined with the Open qPCR.
Choice of aptamer candidates from HTS data with k-mer analysis
Following the SELEX process, we identified aptamer candidates by k-mer analysis. HTS returned approximately 300,000 reads. We identified aptamer sequences in the HTS data based on overrepresentation of short 12-mer sequences for DCV and 15-mer sequences for EGFR (k-mer analysis25). A program written in Python determined the frequency with which each unique k-mer sequence appeared in the data. Sequence data in FASTA format was acquired and provided by the Institute for Bioinformatics and Evolutionary Studies (IBEST) sequencing core. This data was filtered according to three quality requirements: 1) each sequence must begin with a primer binding site (as identified by Illumina software); 2) the next 30 nucleotides must not contain more than 9 bases of homology with either primer sequence (to exclude primer dimers); 3) the final 22 nucleotides must contain the second primer binding site sequence with no more than 4 mismatched bases. Sequences that met these criteria were then parsed into all possible k-mer sub-sequences (where k=12 for DCV and k=15 for EGFR). Those sequences were filtered to remove all duplicates. For each item in the list of unique k-mers, the total number of occurrences in each round of the data were then counted. The most abundant k-mers were selected for experimental characterization. Python source code used to process the DCV data has been provided as Supporting Information Online; EGFR was processed similarly.
In case of DCV, the two most highly represented 12-mer sequences appeared six and four times in the data. We chose four aptamer candidates for further study (aptamer candidates include the randomized region plus primer binding sites). We chose two from the set of six that contained the first over-represented 12-mer. We chose two more from the set of four containing the second over-represented 12-mer. We named these aptamer candidates DCVKM1 through DCVKM4 (for sequence information see Table SI1, Supporting Information Online). We found two k-mers (LINN and FINNI) represented 4 times each in the data from round 4 of the selection against EGFR. FINNI was also represented in round 3. We chose 9 candidates (with random and conserved regions). We named these candidates LINN1 through LINN4 and FINNI1 through FINNI5. We ordered synthetic oligonucleotides for these sequences and tested the affinity of the aptamer candidates using the Open qPCR instrument and fluorescence microscopy.
Determination of Affinity and Specificity for DCV
We screened DCV aptamer candidates for their affinity for DCV by incubating them with positive selection microspheres. We used the Open qPCR to quantify each aptamer candidate that bound the positive selection microspheres. We found that the aptamer candidate DCVKM3 required the fewest number of cycles to produce significant fluorescence (above a threshold of 10% maximal fluorescence, as calculated by the Open qPCR software). The Open qPCR instrument reported the lowest Cq value (8.8) for DCVKM3. This suggested that DCVKM3 had the highest binding affinity for the target (see Figure 2(A)). Therefore, we chose aptamer DCVKM3 for further study.
Figure 2:
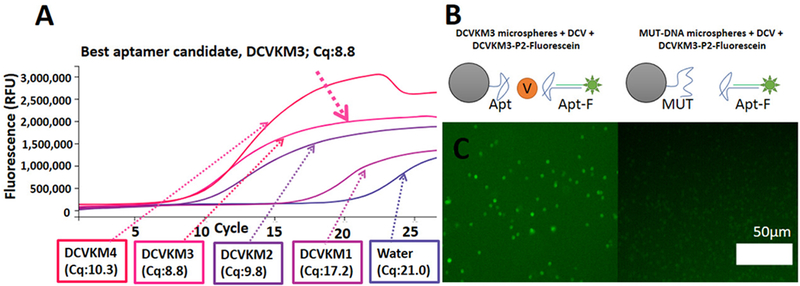
Affinity and specificity test of aptamer DCVKM3. (A) Affinity test of aptamer candidates via Open qPCR. (B) Schematic of the design of the experimental conditions with DCVKM3 (Apt) and control nonspecific DNA (MUT). Orange circle labeled ‘V’ represents DCV. (C) Fluorescence micrographs show the difference in fluorescence capture by aptamer-coated microspheres as compared to MUT-coated microspheres.
We next tested the specificity of aptamer-target binding with a capture assay. We coated microspheres with DCVKM3 and MUT (a scrambled mutant version of DCVKM3). We incubated these microspheres with DCV and then incubated with fluorescein-labeled aptamer Apt-F (annealed complex of DCVKM3 and a short, fluorescein-conjugated, complementary oligonucleotide, P2-F; see Supporting Information Online for sequence information). The particles coated with DCVKM3 showed strong fluorescence (Figure 2(C)). The particles coated with MUT did not show significant fluorescence. This indicated that the binding of DCV to DCVKM3 was specific to the aptamer sequence.
Determination of Affinity and Specificity for EGFR
We screened EGFR aptamer candidates for their affinity for EGFR by incubating them along with control (P2-F) with positive selection microparticles. We then observed the microparticles in a fluorescence microscope and measured mean particle fluorescence using Image J. The mean particle fluorescence (calculated using 10 particles) was high for LINN2 indicating that LINN2 has more binding affinity towards target as shown in Figure 3(B). To identify specificity of LINN2, we incubated the LINN2 aptamer with positive selection microparticles and negative selection microparticles and observed in the fluorescence microscope. The LINN2 aptamer incubated with positive selection microparticles showed strong fluorescence while the negative control showed significantly less fluorescence as shown in Figure 3(A). We took this to indicate that the LINN2 aptamer is specific.
Figure 3:

Affinity and specificity test of aptamer LINN2. (A) Fluorescence micrographs show specificity test of aptamer LINN2 with positive (left) and negative (right) selection microparticles. (B) Affinity test of EGFR aptamer candidates by observing in Fluorescence microscope and measuring mean particle fluorescence using Image J.
Thermofluorimetric Analysis (TFA) using Open qPCR
The Open qPCR instrument can be used to obtain a binding isotherm and quantify the aptamer-target dissociation coefficient (Kd) by thermofluorimetric analysis (TFA)4. This low-cost technique can be used in place of more expensive techniques like surface plasmon resonance or flow cytometry. Thermofluorimetry measures the fluorescence of a mixture of DNA and intercalating dye as a function of temperature. Intercalating dyes are only highly fluorescent when bound to double-stranded DNA. At high temperatures, double-stranded DNA melts and the fluorescence decreases. The melting temperature of an oligonucleotide is the temperature of the maximum rate of change of fluorescence as a function of temperature (dF/dT). The same principle can report aptamer binding. The Easley research group at Auburn University has reported the use of TFA for aptamer binding assays4,28 with a more expensive qPCR instrument (Bio-Rad CFX96). We confirmed that this technique can validate aptamers and that it can be performed with the Open qPCR.
TFA can detect aptamer binding because binding changes the stability of the aptamer. Aptamers are typically structured and have dsDNA regions. These regions bind to intercalating dye and show fluorescence. The bound aptamer-protein complex will melt at a different (usually higher) temperature relative to the unbound aptamer. As such, it will display a unique feature in the thermofluorimetric curve. By measuring this unique feature as a function of protein concentration, we can establish a binding isotherm.
TFA on aptamer LINN2-EGFR complex
We performed TFA on samples of the LINN2 aptamer with variable concentrations of EGFR. TFA allowed us to measure a signal specific to the EGFR-LINN2 complex. We held the aptamer concentration constant at 50 nM. The most dilute EGFR samples are nearly equivalent to an aptamer-only control. The aptamer-only controls are provided as Figure SI3. For pure proteins like EGFR, the change in the background as a function of target concentration can be neglected (see Figure SI5 Supporting Information Online). We found a strong and specific signal for the EGFR-LINN2 complex in the dF/dT data when we added 500nM of the target. This indicates that a high concentration of the target increases the thermal stability of the target-bound aptamer complex. We averaged the dF/dT signal over a range of 3 °C (from 35-37 °C) to generate a binding curve. We described the binding equilibrium of the aptamer and target with a simple equilibrium model assuming that the number of aptamer binding sites is one. This reduces to Equation 1:
| (1) |
We solved Equation 1 in Excel to generate a predicted value for the concentration of aptamer-target complex, [AT], as a function of the experimental value of the total aptamer ([A]t) and total target ([T]t) for a given value of Kd. We then applied a linear relationship (signal, S = m[AT] +b) to generate a predicted signal. We used Excel’s nonlinear solver to minimize the deviation between the predicted signal values of S and experimental data. We allowed Excel to adjust the parameters Kd, slope (m), intercept (b). We applied this non-linear regression analysis to the aptamer-EGFR complex data and found Kd was 9 ± 3 nM.
TFA on aptamer DCVKM3-DCV complex
To perform TFA on the aptamer-DCV complex, we had to perform background subtraction. The fluorescence of DNA intercalating dyes does not usually increase in the presence of protein. The change in the background as a function of target concentration can be neglected for most pure protein targets. For whole-virus selections, the situation is more complicated. Because of the structure and accessibility of its nucleic acid content, the virus contributed significant background in the dF/dT data. This background must be subtracted.
To specifically measure the aptamer-virus complex signal, we took the dF/dT data from the DCV-only sample (see Figure SI1 Supporting Information Online) and subtracted it from the equivalent aptamer+DCV data (Figure 4(C)). The most dilute cases are nearly equivalent to an aptamer-only control. The aptamer only controls are provided as Figure SI4 for comparison. The temperature of 25-30 °C was chosen as it gives the largest difference between DCV-only and DCV-plus-DCVKM3 as a function of virus concentration (see Supporting Information Online, Figure SI1). As an example of the calculation: at 0.055 mg/ml of DCV and 50 nM of DCVKM3 (Figure 4C, green trace), the average -dF/dT signal at 25-30 °C was 13 RFU; the average -dF/dT of the virus only sample at the same temperature range was 21 RFU; the difference of −8 RFU was taken as the virus-specific signal and plotted in Figure 4D at 0.055 mg/ml. Full experimental and background data for specific and nonspecific analysis are shown in Supporting Information Online, Figure SI2. We applied a nonlinear regression analysis to fit a binding isotherm to the data. We determined Kd of virus. We also calculated the equivalent values for nonspecific DNA, NS-DNA (Figure SI2) and plotted them for comparison. NS-DNA did not show binding. Error bars are the standard deviation of the 9 fluorescence readings used to measure the aptamer-complex signal in the thermofluorimetry curve. The average and standard deviation of the four replicates of the binding assay Kd was 0.18 ± 0.06 mg/ml. For EGFR, the Kd was 9.4 ± 2.7 nM.
Figure 4:
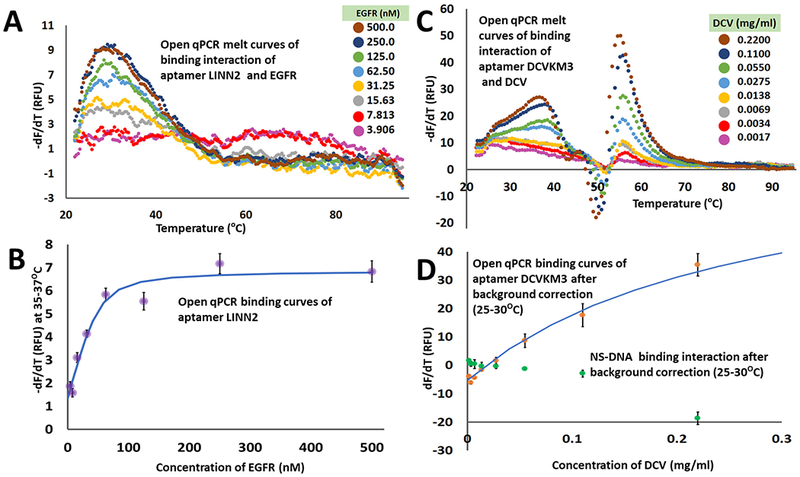
Aptamer-target binding studies via TFA using Open qPCR. (A) TFA melt curves of aptamer LINN2 with target EGFR. (B) Graph shows background-subtracted dF/dT data (aptamer only) as a function of EGFR concentration. The blue line is the best fit binding isotherm used to determine dissociation constant (Kd) between LINN2 and EGFR. (C) TFA melt curves of aptamer DCVKM3 with target DCV. (D) Graph shows background-subtracted dF/dT data as a function of DCV concentration for DCVKM3 (orange dots) and nonspecific DNA (NS-DNA, green dots). The blue line is the best fit binding isotherm used to determine dissociation constant (Kd) between DCVKM3 and DCV.
Flow Cytometric Analysis of Binding Isotherm
We verified the Open qPCR binding assay results using flow cytometry. Flow cytometry uses laser scattering and fluorescence to characterize microspheres or cells in a fluid29. To measure the dissociation constant, we labeled target-coated clear microspheres with a fluorescein-modified aptamer at a range of concentrations. We used forward scattering (FS) and side scattering (SS) to threshold for high scattering events (which appeared only when we added microspheres). This high scattering population is denoted P1 in Figure 5(A) and Figure 5(D). This population was chosen as being the single microparticle events (as opposed to higher scattering aggregates). We then measured the fluorescence intensity of the selected microspheres (Figure 5(B) and Figure 5(E)). Figure 5(C) and Figure 5(F) shows the median fluorescence intensity of the high-scattering microspheres as a function of aptamer concentration. We applied a nonlinear regression as in the TFA analysis with the exception that we also used excel to fit the total protein parameter, [T]t (we did not have a precise value for the coupling efficiency between target and microparticles). Nonlinear fitting revealed that the dissociation constant, Kd, of DCVKM3 binding DCV was 300 ± 100 nM (average and standard deviation of the three replicates). For EGFR, Kd was 10 ± 7 nM (average and standard deviation of the three replicates). This result supports the conclusion that DCKVM3 does bind DCV and LINN2 binds EGFR. This is independent confirmation of the general conclusion obtained by TFA using the Open qPCR.
Figure 5:

Binding assay by flow cytometry. (A) Flow cytometric scatter plot of particles bearing DCV bound to DCVKM3 aptamer. We chose and analyzed the high scattering events (population P1, blue box) for FITC fluorescence. (B) A histogram shows the FITC fluorescence (RFU) of all events (grey) with population P1 highlighted (blue). We used the median of P1 FITC fluorescence to construct the binding curve of aptamer DCVKM3. (C) A binding curve of aptamer DCVKM3 shows median fluorescence (average and standard deviation of triplicates) as a function of aptamer concentration; best fit binding isotherm is shown in blue. (D) Flow cytometric scatter plot of particles bearing EGFR bound to LINN2 aptamer. We chose and analyzed the high scattering events (population P1, blue box) for FITC fluorescence. (E) A histogram shows the FITC fluorescence of all events (grey) with population P1 highlighted (blue). We used the median of P1 FITC fluorescence to construct the binding curve of aptamer LINN2. (F) A binding curve of aptamer LINN2 shows median fluorescence (average and standard deviation of triplicates) as a function of aptamer concentration; best fit binding isotherm is shown in blue.
To show the utility of aptamer-based virus detection, we developed an enzyme linked chemiluminescence sandwich assay30,31. This is a proof-of-concept demonstration of the use of aptamers in the rapid and sensitive detection of DCV. Such an assay could be used for screening infected flies. We used purified whole virus as our analyte in Figure 5. DCV is a ~10 MD complex with many copies of each capsid protein32. The sandwich complex presented in Figure 2B and Figure 5A work for large viral target, but will likely not work for EGFR; we did not attempt the same technique with EGFR. This assay is similar to enzyme linked aptamer sorbent assay (ELASA)20,21. Aptamers replace the antibodies used in traditional ELISA. We conducted the luminescence assay by immobilizing amine-modified aptamer DCVKM3 on the surface of clear carboxylate-coated microspheres (Figure 6(A)). After exposure to sample, the resulting aptamer-DCV microspheres captured biotin-modified DCVKM3 labeled with avidin horseradish peroxidase (HRP) for luminescence detection. We averaged 69 luminescence readings at different locations in the well (Figure 6(B)) to compensate for heterogeneities arising from particle settling. The best test for the specificity of the aptamer-based assay was to measure response to a high concentration of a very similar analyte. We tested the response of the aptamer-based sandwich assay to a sample of a related fly virus, DXV. The luminescence was significantly higher in the case of the DCV sample as compared to a sample containing DXV (the non-target virus). This is a very stringent test of the specificity of this aptamer. We also showed that the scrambled sequence, N30MUT, did not capture the target (we used N30MUT coated microspheres instead of aptamer microspheres). The luminescence of the experimental sample significantly exceeded that of the non-target control (P < 0.0001, t-test). Based on this signal and standard deviation, we calculate a limit of detection (3 standard deviations of the average of 69 measurements) to be 0.7 μg of virus.
Figure 6:

Sandwich assay to detect DCV. (A) Schematic illustrations show the design of the luminescence assay for DCV (V = virus, b = biotin, A = avidin, HRP = horseradish peroxidase). (B) Average (n=69) luminescence values (arbitrary units) are shown for the assay with experimental (DCV) and control samples (null, non-target virus DXV, unrelated DNA sequence N30MUT).
CONCLUSION
We report the use of the Open qPCR instrument in aptamer selection. The resulting aptamers specifically bound our targets. We chose our aptamers from a set of aptamer candidates because they showed adequate affinity and high specificity for our targets as determined with the Open qPCR instrument. The Open qPCR instrument measured the target-aptamer binding using thermofluorimetric analysis (TFA) using the melt curve analysis function (rather than quantitative PCR). Only one other group has performed binding curve analysis with thermofluorimetry4. We have shown that 1) the technique works reliably in a second lab; 2) that the technique can be corroborated with an unrelated technique, flow cytometry; and 3) that thermofluorimetry works with difficult samples like whole virus. The use of thermofluorimetry to measure aptamer-virus binding is a wholly novel result.
Flow cytometry confirmed binding and the DCV-aptamer complex had a dissociation constant (Kd) of 0.3 μM ± 0.1 μM. According to Jousset et. al.32, DCV virus particles have a total molecular weight of 10 MD and (based on the total protein and constituent molecular weights) have tens of each protein per virus particle. If we assume that the aptamer binds to an epitope that occurs 50 times per virus particle, this would suggest that our Kd by TFA (0.18 mg/ml) is equivalent 0.9 μM, which is qualitatively similar to the value recovered with flow cytometry.
Furthermore, we developed a proof-of-concept method for the detection of DCV based on aptamer DCVKM3-coated microspheres. The use of a particle surface may enhance binding by presenting multiple aptamers (i.e., avidity effects). The assay was rapid, taking <2 hours for the detection of DCV. The aptamer was specific and did not cross react with a second fly virus, DXV. This methodology has the potential to contribute to the development of rapid and sensitive detection methods for other viruses. The selected aptamer against DCV is first aptamer against this target. We developed this aptamer for application in research on DCV infected flies. These results stand as a unique contribution to the field. Additionally, the unified use of a single instrument (the open qPCR) to optimize amplification, screen candidates, and characterize binding is a unique result. We did not use qPCR to replace PCR entirely, however; large scale amplification was carried out with conventional PCR.
This work shows that the Open qPCR instrument can be used for multiple tasks during aptamer selection. The instrument is economically priced (~$3,000) and can be used to rapidly optimize a PCR reaction in place of a cyclecourse. It can also quantify DNA obtained after single strand generation, and screen and characterize aptamer candidates. We measured a binding isotherm with the Open qPCR and TFA; we used flow cytometry to validate the results. TFA is new technique for aptamer binding assays and has not yet gained popularity. It could become more common as equipment becomes more widely available. TFA is promising as a relatively simple and low-cost binding assay (as compared to radiolabeled dot blots or surface plasmon resonance). Background issues associated with the DCV made the measurement of the DCV-aptamer binding challenging. Nonetheless, TFA identified and characterized the binding. TFA does not require fluorescently-modified DNA or radioisotopes. As such, we anticipate that it will prove generally useful in aptamer research.
EXPERIMENTAL PROCEDURES
Aptamer Library
A single stranded DNA oligonucleotide pool (N30 pool) was purchased as a gel-purified oligonucleotide from IDT (Integrated DNA Technologies, Coralville, IA, USA) and was used as received. The pool consisted of 30 mer randomized sequence region flanked by two primer-binding sites. The primers used in the selection (P1, P1-f, P2-F and P2-acryd) were also synthesized by IDT. See Supporting Information Online for sequence information in Table S1.
Preparation of Positive and Negative Selection Microspheres for anti-DCV aptamer selection
DCV, Drosophila C virus, (Charolles strain) was originally obtained from Dr. Luis Teixeira, Instituto Gulbenkian de Ciencia, Oeiras, Portugal. DCV was grown in Drosophila S2 cells and purified by density gradient ultracentrifugation as described in detail elsewhere33. Incubation of 40 μl of pre-washed and activated magnetic microspheres (ProMag TM Magnetic Microspheres, 1 HC. COOH, solids 2.53% 0.78 μM, Bangs Laboratories Inc., IN, USA) was carried out with 40 μl of DCV (0.44 mg/ml) for 2 hours at room temperature by vortexing, followed by washing in selection buffer (1X phosphate buffer, pH 8, 50 mM Na2HPO4, 50 mM NaH2PO4, both from EMD Chemicals, Gibbstown, Germany). The microspheres were resuspended in 40 μl of selection buffer. Five μl were then used for each round of aptamer selection (denoted “positive selection microspheres”). Negative selection microspheres were treated as above with the presence of Drosophila X virus (DXV, 0.43 mg/ml, prepared by the same methods as DCV). DXV source material was kindly provided by Dr. Louisa Wu, University of Maryland.
Preparation of Positive and Negative Selection Microspheres for anti-EGFR aptamer selection
EGFR, Human Protein, Recombinant (hIgG1-Fc Tag, Active, Sino Biological Life Technologies, CA, USA) was diluted in 80μl of 2.5X Py modified buffer (pH 6.8, 125mM Na2HPO4, 125mM NaCl, both from EMD Chemicals, Gibbstown, Germany) resulting a concentration 0.625μM. Incubation of 40 μl of pre-washed and activated magnetic microspheres (ProMag TM Magnetic Microspheres, 1 HC. COOH, solids 2.53% 0.78 μM, Bangs Laboratories Inc., IN, USA) was carried out with 40 μl of EGFR solution (0.625μM) for 2 hours at room temperature by vortexing, followed by washing in selection buffer (1X phosphate buffer, pH 8, 50 mM Na2HPO4, 50 mM NaH2PO4, both from EMD Chemicals, Gibbstown, Germany). The microspheres were resuspended in 40 μl of selection buffer. Five μl were then used for each round of aptamer selection (denoted “positive selection microspheres”). Negative selection microspheres were treated as above with the presence of IgG1-FC Recombinant Human Protein (Sino Biological Life Technologies, CA, USA).
Aptamer Selection
Approximately 500 pmol (1014 molecules) of DNA library was annealed in 45 μl of selection buffer. Five μl of negative selection microspheres were then added to the annealed pool and incubated for 30 minutes by rotating at room temperature. This was denoted “negative selection”. Magnets were then used to immobilize magnetic microspheres and the supernatant buffer containing the unbound pool was transferred to another vial containing positive selection microspheres. Aptamers were incubated 30 minutes at room temperature with slow mixing at room temperature. This was denoted “positive selection”. Unbound DNA was then removed and fresh buffer was added to the tube. Washing was done four times in selection buffer. Microspheres were then resuspended in water and bound aptamers were eluted after heat treatment (90 °C) for five minutes. The number of PCR cycles required for amplification was then optimized in Open qPCR and the eluted DNA was amplified by PCR. Single strand generation was carried out in 5% denaturing 7M urea PAGE gel. For EGFR, gel was cast in vertical gel rig. For DCV, the gel was cast with two sets of combs, i.e. loading and extraction combs27. The round one (R1) ssDNA pool was generated by aspirating sample from extraction wells followed by ethanol precipitation. Approximately 50 pmol of R1 ssDNA pool was used as pool for second round. Using the same methodology, selection was carried out up to four rounds (anti-EGFR aptamer selection) and eight rounds (anti-DCV aptamer selection).
Library Preparation for anti-DCV aptamer selection
The eluted DNA from rounds 2, 4, 6 and 8 was amplified first with CS1-P1 and CS2-P2 and then with barcoded primers. The amplified product was finally purified by 4% non-denaturing PAGE gel and submitted to the Institute for Bioinformatics and Evolutionary Studies sequencing core facility at the University of Idaho for MiSeq sequencing (MiSeq, Illumina, San Diego, CA, USA).
Library Preparation for anti-EGFR aptamer selection
The eluted DNA of each round (rounds 1, 2, 3 and 4) was amplified first with CS1. P1 and CS2. P2 and then with barcoded primers. The amplified product was finally purified by 4% non-denaturing PAGE gel and submitted to the Institute for Bioinformatics and Evolutionary Studies sequencing core facility at the University of Idaho for MiSeq sequencing (MiSeq, Illumina, San Diego, CA, USA).
Candidate Screening and Affinity Test of anti-DCV Aptamer Candidates
Affinity testing was carried out with four possible aptamer candidates (DCVKM1, DCVKM2, DCVKM3, and DCVKM4) obtained by k-mer analysis. Each aptamer candidate (50 pmol) was incubated with 5 μl of positive selection microspheres separately for 30 minutes at 37 °C. This process was followed by washing with 100 μl selection buffer five times. Incubation with 100 μl selection buffer was then carried out for one hour at 37 °C. The supernatant buffer was then removed and 50 μl of water was added. The bound DNA was then eluted by heating the sample at 90 °C in a water bath. The qPCR analysis of eluted DNA was carried out to find the best aptamer candidate. For this, reaction mixtures were made by taking 100 μl of 2X Taq master mix (Thermo Scientific, Waltham, MA, USA), 1 μl of P1(100 μM), 1 μl of P2-acryd (100 μM), 10 μl of evagreen (Evagreen Dye, 20X in water, Biotium, CA, USA) and 78 μl of water (for sequence information see Table S1, Supporting Information Online). The reaction mixtures were then aliquoted into five vials of 19 μl each. One μl eluted DNA of each aptamer candidate and 1 μl water were added to vials. Then qPCR was performed with the Open qPCR (CHAI Bio, CA, USA) with the following parameters: denaturation 15 seconds at 95 °C, annealing 15 seconds at 60 °C, and elongation 30 seconds at 68 °C.
Candidate Screening and Affinity Test of anti-EGFR Aptamer Candidates
Affinity testing was carried out with nine possible aptamer candidates (LINN1 through LINN4 and FINNI1 through FINNI5) obtained by k-mer analysis. The positive selection microspheres (EGFR coated magnetic microspheres) were blocked and diluted by five times in superblock for 1 hour. The blocked microspheres were washed one time in selection buffer. Two μl of 200nM of each aptamer candidate (prepared in selection buffer followed by annealed fast and then diluted to 200nM) was incubated with 2 μl of blocked positive selection microspheres separately for 2 hours at 37 °C. This process was followed by washing, resuspending in 10μl selection buffer and then observed on the fluorescent microscope (LumaScope 620, EtaLuma, Carlsbad, CA) in the green channel (λex 490 nM). The control sample was prepared in the same way by incubating P2-F (instead of aptamer candidates) and performed scoping on the fluorescent microscope.
Specificity Test of anti-DCV aptamer with Fluorescence Microscopy
Specificity test was performed with nonspecific DNA (MUT, a scrambled sequence variant of DCVKM3). To do so, aptamer DCVKM3 was labeled by annealing 40 pmol DCVKM3 with 50 pmol P2-F (a short, fluorescein-conjugated, complementary oligonucleotide; for sequence information see Table S1, Supporting Information Online) in 20 μl selection buffer. The labeled aptamer was named DCVKM3-F. The amine-modified aptamer DCVKM3 was conjugated with clear carboxylate-coated microspheres (Uniform Microspheres, 2.19 μM, Bangs Laboratories Inc., IN, USA) to make DCVKM3 microspheres. Ten μl aptamer DCVKM3 microspheres incubated with target DCV were further incubated for 30 minutes with 20 pmol of DCVKM3-F. The incubation was followed by washing six times with selection buffer, resuspending in 100 μl selection buffer and then observed on the fluorescent microscope (LumaScope 620, EtaLuma, Carlsbad, CA) in the green channel (λex 490 nM). The control sample was prepared in the same way by conjugating amine modified nonspecific DNA (MUT instead of aptamer DCVKM3), with the clear carboxylate-coated microspheres to make control microspheres. The resulting control microspheres were incubated initially with target DCV and then further incubated with DCVKM3-F for 30 minutes. This step was followed by washing and resuspending in 100 μl selection buffer and imaging by fluorescence microscopy.
Specificity Test of anti-EGFR aptamer with Fluorescence Microscopy
To do specificity test, 10 μM LINN2 aptamer candidate in selection buffer was annealed fast and then diluted to 200nM. The positive selection microparticles (EGFR coated magnetic microparticles) were blocked and diluted by five times in superblock for 1 hour. The blocked microparticles were washed one time in selection buffer. Two μl of 200nM of LINN2 aptamer candidate was incubated at room temperature for 2 hours with 2μl blocked positive selection microparticles (EGFR coated magnetic microparticles). The incubation was followed by washing, resuspending in 10μl selection buffer and then observed on the fluorescent microscope. Similarly, incubation of LINN2 aptamer candidate with blocked negative selection microparticles (IgG1Fc coated magnetic microparticles) was carried out.
The control of P2-F was prepared in the same way as LINN2 aptamer candidate and incubated with positive and negative selection microparticles separately and observed in Fluorescence microscope respectively.
Binding Assay by Thermofluorimetric Analysis (anti-EGFR Aptamer)
Binding of aptamer to target was tested with melting curve analysis. To do so, protein buffer was made. Protein buffer is a 1:4 mixture of 5X Py buffer (pH 6.8, 250mM Na2HPO4, 250mM NaCl, both from EMD Chemicals, Gibbstown, Germany) and 1X phosphate buffer (pH 8, 50 mM Na2HPO4, 50 mM NaH2PO4, both from EMD Chemicals, Gibbstown, Germany). Then master solution containing 1X EvaGreen, and 1X LINN2 (50 nM) was made in protein buffer. Then stock sample containing 1X EvaGreen, 1X LINN2 and 500nM EGFR was made. This was serially diluted eight times with 2-fold dilutions in master solution. All samples were placed in the Open qPCR and melt curve data was acquired at 1.2 °C per min with data collection at 30 seconds intervals. A unique feature in the dF/dT curve at in the aptamer+EGFR samples was noted. This signal increased in magnitude as a function of EGFR concentration.
Binding Assay by Thermofluorimetric Analysis (anti-DCV Aptamer)
Binding of aptamer to target was tested with melting curve analysis. To do so, master solution containing 1X EvaGreen, and 1X DCVKM3 (50 nM) was made in selection buffer. Then stock sample containing 1X EvaGreen, 1X DCVKM3 and 0.22mg/ml DCV was made. This was serially diluted eight times with 2-fold dilutions in master solution. The control experiment was carried out similarly without aptamer DCVKM3 for background correction contributed by virus, DCV itself. One more control experiment was performed by taking non-specific DNA “NS-DNA” instead of aptamer DCVKM3 in a similar way as with aptamer DCVKM3 as shown in Figure SI2 in Supporting Information Online. All three sets of samples were placed in the Open qPCR and melt curve data was acquired at 1.2 °C per min with data collection at 30 seconds intervals. A unique feature in the dF/dT curve at in the aptamer+DCV samples relative to the DCV-only samples was noted. This feature appeared as a decrease in the melting rate for the aptamer-DCV complex at 25-30 °C (for a direct comparison of the controls and experimental, see Figure SI1 in Supporting Information Online). The difference in melting rate between DCV only and aptamer+DCV at 25-30 °C was taken as a signal. This signal increased in magnitude as a function of DCV concentration.
Binding Assay by Flow Cytometric Analysis
To do flow cytometric analysis of DCVM3 aptamer, target DCV-coated clear microspheres were made by conjugating DCV with clear carboxylate-coated microspheres by the same procedure as above. DCVKM3-am, an amine modified aptamer, was conjugated with FITC (Sigma-Aldrich, MO, USA) to yield DCVKM3-FITC (~ 12 μM, analyzed by Quick drop, Molecular Devices, CA, USA). DCVKM3-FITC (25 μl) was added to the first PCR tube containing 25 μl of selection buffer and then 5-fold serial dilution was carried out across eight tubes in selection buffer. Five μl of DCV-coated clear microspheres were added to each tube and incubated for 30 minutes. Ten μl incubated sample was taken in a vial and 200 μl selection buffer was added to wash. After removing supernatant, particles were finally resuspended in 200 μl of the selection buffer to perform flow cytometric analysis using a Beckman Coulter CytoFLEX S.
In case of LINN2 aptamer, we carried out whole experiments in similar way as DCVKM3 aptamer, by taking EGFR coated clear microspheres and 5’-Fluorescein modified LINN2 aptamer (LINN2-F, ~10 μM). LINN2-F (50 μl) was added to the first PCR tube and then 5-fold serial dilution was carried out across eight tubes in selection buffer. Five μl of EGFR-coated clear microspheres were added to each tube and incubated for 30 minutes. Ten μl incubated sample was taken in a vial and 200 μl selection buffer was added to wash. After removing supernatant, particles were finally resuspended in 200 μl of the selection buffer to perform flow cytometric analysis using a Beckman Coulter CytoFLEX S.
Aptamer Sandwich Assay to Detect Virus
To perform the aptamer-based detection assay for DCV, DCVKM3 microspheres were made by conjugating amine modified aptamer DCVKM3 with clear carboxylate-coated microspheres. Ten μl of DCVKM3 microspheres were incubated with 4 μl of DCV (2 ug) for 1 hour at room temperature. The resulting microspheres (obtained by incubating DCVKM3 microspheres with DCV) were blocked by washing (centrifugation, supernatant removal and resuspension with 100 μl of blocking buffer) three times in commercial, protein-based blocking buffer (1% Superblock, Thermo Scientific, IL, USA in selection buffer). One hundred μl of 200 nM complex of biotinylated aptamer DCVKM3 conjugated with avidin HRP (Thermo Fisher Scientific, CA, USA) was added followed by incubation for 30 minutes at room temperature by shaking. Washing was then carried out two times with 100 μl of the selection buffer and finally resuspended in 20 μl of the selection buffer. Five μl of the resuspended sample was loaded in a well of 384-well plates (Microplate, 384 well, PS, F-Bottom, Black, Non-Binding, Germany) followed by addition of 45 μl of 1:1 mixture of supersignal (Enhancer solution and stable peroxide solution, Thermo Scientific, USA). The absorbance value was measured at 450 nM and 25 °C in multi-mode microplate reader (SpectraMax iD3, Molecular Devices, CA, USA). The experiment was carried out in triplicate. Three control experiments were carried out in a similar way. The negative control was carried out without adding target DCV whereas the non-target control was carried out by adding DXV instead of DCV. A third control (MUT) was carried out using MUT microspheres instead of DCVKM3 microspheres.
Supplementary Material
ACKNOWLEDGMENTS
This publication was made possible by an Institutional Development Award (IDeA) from the National Institute of General Medical Sciences of the National Institutes of Health under Grant P20GM103408. Research reported in this publication was supported by the National Institute of General Medical Sciences of the National Institutes of Health under Award Number P20GM104420. This published work was supported by an Institutional Development Award (IDeA) from the National Institute of General Medical Sciences of the National Institutes of Health under grant number P30 GM103324.The content is solely the responsibility of the authors and does not necessarily represent the official views of the National Institutes of Health.
ASSOCIATED CONTENT
Supporting Information
The supporting information (Name of Sequences, Details on background subtraction to generate binding curve of aptamer-DCVM3 and DCV interaction, Supplemental Figures, Triplicate binding assay by TFA for both EGFR and DCV aptamers, python source code for K-mer analysis) is available free of charge on the ACS publication website.
The authors declare no competing financial interest.
REFERENCES
- (1).Zhang C; Wijnen B; Pearce JM Open-Source 3-D Platform for Low-Cost Scientific Instrument Ecosystem. J. Lab. Autom 2016, 2211068215624406. [DOI] [PubMed] [Google Scholar]
- (2).Pearce JM Emerging Business Models for Open Source Hardware. J. Open Hardw 2017, 1 (1). [Google Scholar]
- (3).Darmostuk M; Rimpelova S; Gbelcova H; Ruml T Current Approaches in SELEX: An Update to Aptamer Selection Technology. Biotechnol. Adv 2015, 33 (6, Part 2), 1141–1161. [DOI] [PubMed] [Google Scholar]
- (4).Hu J; Kim J; Easley CJ Quantifying Aptamer-Protein Binding via Thermofluorimetric Analysis. Anal. Methods Adv. Methods Appl 2015, 7 (17), 7358–7362. [DOI] [PMC free article] [PubMed] [Google Scholar]
- (5).Nguyen V-T; Kwon YS; Gu MB Aptamer-Based Environmental Biosensors for Small Molecule Contaminants. Curr. Opin. Biotechnol 2017, 45, 15–23. [DOI] [PubMed] [Google Scholar]
- (6).Tang Z; Shangguan D; Wang K; Shi H; Sefah K; Mallikratchy P; Chen HW; Li Y; Tan W Selection of Aptamers for Molecular Recognition and Characterization of Cancer Cells. Anal. Chem 2007, 79 (13), 4900–4907. [DOI] [PubMed] [Google Scholar]
- (7).Woo H-M; Kim K-S; Lee J-M; Shim H-S; Cho S-J; Lee W-K; Ko HW; Keum Y-S; Kim S-Y; Pathinayake P; Kim C-J; Jeong Y-J Single-Stranded DNA Aptamer That Specifically Binds to the Influenza Virus NS1 Protein Suppresses Interferon Antagonism. Antiviral Res 2013, 100 (2), 337–345. [DOI] [PubMed] [Google Scholar]
- (8).Ashrafuzzaman M Aptamers as Both Drugs and Drug-Carriers. BioMed Res. Int 2014, 2014, e697923. [DOI] [PMC free article] [PubMed] [Google Scholar]
- (9).Meng H-M; Liu H; Kuai H; Peng R; Mo L; Zhang X-B Aptamer-Integrated DNA Nanostructures for Biosensing, Bioimaging and Cancer Therapy. Chem. Soc. Rev 2016, 45 (9), 2583–2602. [DOI] [PubMed] [Google Scholar]
- (10).Chtarbanova S; Lamiable O; Lee K-Z; Galiana D; Troxler L; Meignin C; Hetru C; Hoffmann JA; Daeffler L; Imler J-L Drosophila C Virus Systemic Infection Leads to Intestinal Obstruction. J. Virol 2014, 88 (24), 14057–14069. [DOI] [PMC free article] [PubMed] [Google Scholar]
- (11).Kapun M; Nolte V; Flatt T; Schlötterer C Host Range and Specificity of the Drosophila C Virus. PLOS ONE 2010, 5 (8), e12421. [DOI] [PMC free article] [PubMed] [Google Scholar]
- (12).Unckless RL A DNA Virus of Drosophila. PLOS ONE 2011, 6 (10), e26564. [DOI] [PMC free article] [PubMed] [Google Scholar]
- (13).Baselga J The EGFR as a Target for Anticancer Therapy--Focus on Cetuximab. Eur. J. Cancer 2001, 37 (Supplement 4), 16–22. [DOI] [PubMed] [Google Scholar]
- (14).Li N; Nguyen HH; Byrom M; Ellington AD Inhibition of Cell Proliferation by an Anti-EGFR Aptamer. PLoS ONE 2011, 6 (6), e20299. [DOI] [PMC free article] [PubMed] [Google Scholar]
- (15).Ellington AD; Szostak JW In Vitro Selection of RNA Molecules That Bind Specific Ligands. Nature 1990, 346 (6287), 818–822. [DOI] [PubMed] [Google Scholar]
- (16).Tuerk C; Gold L Systematic Evolution of Ligands by Exponential Enrichment: RNA Ligands to Bacteriophage T4 DNA Polymerase. Science 1990, 249 (4968), 505–510. [DOI] [PubMed] [Google Scholar]
- (17).Kim E; Dua P; Kim S Cell-Based Aptamer Selection for Diagnosing Cancer and Predicting Cancer Progression. Toxicol. Environ. Health Sci 2009, 1 (2), 140–143. [Google Scholar]
- (18).Cao B; Hu Y; Duan J; Ma J; Xu D; Yang X-D Selection of a Novel DNA Aptamer for Assay of Intracellular Interferon-Gamma. PLOS ONE 2014, 9 (5), e98214. [DOI] [PMC free article] [PubMed] [Google Scholar]
- (19).Nitsche A; Kurth A; Dunkhorst A; Pänke O; Sielaff H; Junge W; Muth D; Scheller F; Stöcklein W; Dahmen C; Pauli G; Kage A One-Step Selection of Vaccinia Virus-Binding DNA Aptamers by MonoLEX. BMC Biotechnol 2007, 7, 48. [DOI] [PMC free article] [PubMed] [Google Scholar]
- (20).Schütze T; Wilhelm B; Greiner N; Braun H; Peter F; Mörl M; Erdmann VA; Lehrach H; Konthur Z; Menger M; Arndt PF; Glökler J Probing the SELEX Process with Next-Generation Sequencing. PLOS ONE 2011, 6 (12), e29604. [DOI] [PMC free article] [PubMed] [Google Scholar]
- (21).Blind M; Blank M Aptamer Selection Technology and Recent Advances. Mol. Ther. — Nucleic Acids 2015, 4 (1), e223. [DOI] [PMC free article] [PubMed] [Google Scholar]
- (22).Cho M; Soo Oh S; Nie J; Stewart R; Eisenstein M; Chambers J; Marth JD; Walker F; Thomson JA; Soh HT Quantitative Selection and Parallel Characterization of Aptamers. Proc. Natl. Acad. Sci. U. S. A 2013, 110 (46), 18460–18465. [DOI] [PMC free article] [PubMed] [Google Scholar]
- (23).Szeto K; Latulippe DR; Ozer A; Pagano JM; White BS; Shalloway D; Lis JT; Craighead HG RAPID-SELEX for RNA Aptamers. PLOS ONE 2013, 8 (12), e82667. [DOI] [PMC free article] [PubMed] [Google Scholar]
- (24).Mosing RK; Mendonsa SD; Bowser MT Capillary Electrophoresis-SELEX Selection of Aptamers with Affinity for HIV-1 Reverse Transcriptase. Anal. Chem 2005, 77 (19), 6107–6112. [DOI] [PubMed] [Google Scholar]
- (25).Hoon S; Zhou B; Janda KD; Brenner S; Scolnick J Aptamer Selection by High-Throughput Sequencing and Informatic Analysis. BioTechniques 2011, 51 (6), 413–416. [DOI] [PubMed] [Google Scholar]
- (26).Keefe AD; Pai S; Ellington A Aptamers as Therapeutics. Nat. Rev. Drug Discov 2010, 9 (7), 537–550. [DOI] [PMC free article] [PubMed] [Google Scholar]
- (27).Damase TR; Ellington AD; Allen PB Purification of Single-Stranded DNA by Co-Polymerization with Acrylamide and Electrophoresis. BioTechniques 2017, 62 (6), 275–282. [DOI] [PMC free article] [PubMed] [Google Scholar]
- (28).Kim J; Hu J; Bezerra AB; Holtan MD; Brooks JC; Easley CJ Protein Quantification Using Controlled DNA Melting Transitions in Bivalent Probe Assemblies. Anal. Chem 2015, 87 (19), 9576–9579. [DOI] [PMC free article] [PubMed] [Google Scholar]
- (29).Meyer M; Scheper T; Walter J-G Aptamers: Versatile Probes for Flow Cytometry. Appl. Microbiol. Biotechnol 2013, 97 (16), 7097–7109. [DOI] [PubMed] [Google Scholar]
- (30).Moore MD; Escudero-Abarca BI; Jaykus L-A An Enzyme-Linked Aptamer Sorbent Assay to Evaluate Aptamer Binding. Methods Mol. Biol. Clifton NJ 2017, 1575, 291–302. [DOI] [PubMed] [Google Scholar]
- (31).Toh SY; Citartan M; Gopinath SCB; Tang T-H Aptamers as a Replacement for Antibodies in Enzyme-Linked Immunosorbent Assay. Biosens. Bioelectron 2015, 64, 392–403. [DOI] [PubMed] [Google Scholar]
- (32).Jousset F-X; Bergoin M; Revet B Characterization of the Drosophila C Virus. J. Gen. Virol 1977, 34 (2), 269–283. [DOI] [PubMed] [Google Scholar]
- (33).Osborne SE; Leong YS; O’Neill SL; Johnson KN Variation in Antiviral Protection Mediated by Different Wolbachia Strains in Drosophila Simulans. PLOS Pathog 2009, 5 (11), e1000656. [DOI] [PMC free article] [PubMed] [Google Scholar]
Associated Data
This section collects any data citations, data availability statements, or supplementary materials included in this article.