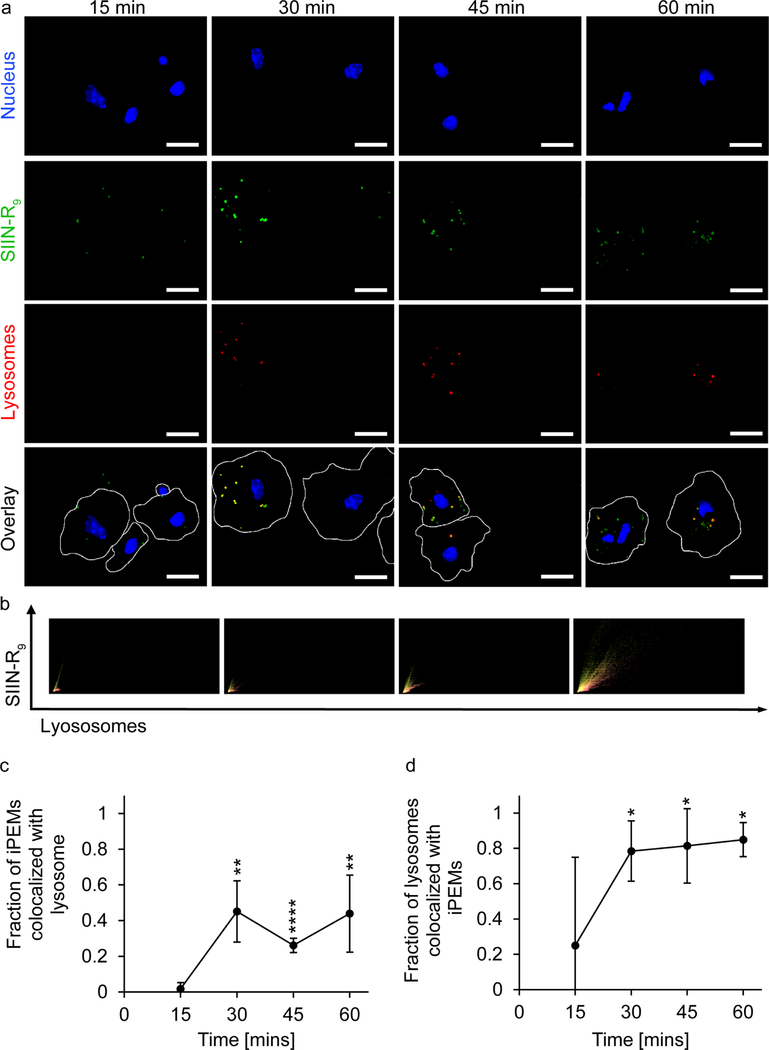
Figure 6.
Trafficking of iPEMs through primary DCs. A) Fluorescent microscopy images of primary DCs incubated with iPEMs shows iPEMs co-localizing with lysosomes over time. B) Image analysis of fluorescent microscopy images of iPEM uptake shows an increase in pixels positive for iPEM signal FITC and lysosomes over time. Each pixel is plotted by the fluorescent intensity of both the FITC signal resulting from antigen and Texas-red signal from lysotracker red with the highest intensity of both signals in the top right corner. C and D) quantifying the fraction of iPEMs and lysosomes colocalized from the image analysis plots in B, shows an increase in colocalization after 30 minutes that was sustained over 60 minutes. Error bars are standard deviation. Statistical analysis performed with a T test comparing each time point to the 15 min time point. * = P≤0.05, ** = P≤0.01, **** = P≤0.0001.

