

Abstract
Introduction
The Global Financing Facility (GFF) was launched to accelerate progress towards the Sustainable Development Goals (SDGs) through scaled and sustainable financing for Reproductive, Maternal, Newborn, Child and Adolescent Health and Nutrition (RMNCAH-N) outcomes. Our objective was to estimate the potential impact of increased resources available to improve RMNCAH-N outcomes, from expanding and scaling up GFF support in 50 high-burden countries.
Methods
The potential impact of GFF was estimated for the period 2017–2030. First, two scenarios were constructed to reflect conservative and ambitious assumptions around resources that could be mobilised by the GFF model, based on GFF Trust Fund resources of US$2.6 billion. Next, GFF impact was estimated by scaling up coverage of prioritised RMNCAH-N interventions under these resource scenarios. Resource availability was projected using an Excel-based model and health impacts and costs were estimated using the Lives Saved Tool (V.5.69 b9).
Results
We estimate that the GFF partnership could collectively mobilise US$50–75 billion of additional funds for expanding delivery of life-saving health and nutrition interventions to reach coverage of at least 70% for most interventions by 2030. This could avert 34.7 million deaths—including preventable deaths of mothers, newborns, children and stillbirths—compared with flatlined coverage, or 12.4 million deaths compared with continuation of historic trends. Under-five and neonatal mortality rates are estimated to decrease by 35% and 34%, respectively, and stillbirths by 33%.
Conclusion
The GFF partnership through country- contextualised prioritisation and innovative financing could go a long way in increasing spending on RMNCAH-N and closing the existing resource gap. Although not all countries will reach the SDGs by relying on gains from the GFF platform alone, the GFF provides countries with an opportunity to significantly improve RMNCAH-N outcomes through achievable, well-directed changes in resource allocation.
Keywords: child health, health systems, maternal health, nutrition, public health, health financing, low- and middle-income countries, global health
Key questions.
What is already known?
The Global Financing Facility (GFF) was launched in July 2015 as a multistakeholder partnership to catalyse investments in Reproductive, Maternal, Newborn, Child and Adolescent Health and Nutrition (RMNCAH-N) through a country-led process.
Previous studies have focused on costing a set of coverage targets without defining a credible resource envelope.
What are the new findings?
The GFF partnership, by mobilising domestic resources, aligning complementary financing, linking grants to concessional financing and drawing in private sector financing, could mobilise an additional US$50–75 billion of resources globally towards scaling up coverage of priority RMNCAH-N interventions.
From 12.4 to 34.7 million lives could be saved by 2030 if GFF succeeds in mobilising US$75 billion additional resources for health and the GFF-supported country-led efforts successfully increase RMNCAH-N coverage by at least 70% in 50 high-burden countries.
What do the new findings imply?
Collective action is needed to support GFF as a coordinated platform focused on country-specific needs to not only push the envelope and contribute to closing the current financing gap but also promote sustained country-led progress towards the Sustainable Development Goals.
Introduction
Considerable progress has been made in the past two decades to improve maternal and child health. However, most countries fell short of reaching the Millennium Development Goal 4 and 5 targets, which called for a reduction of two-thirds of the under-five mortality rate and three-quarters of the maternal mortality ratio, respectively.1 The Global Financing Facility i (GFF) in support of Every Woman Every Child 2 was launched by the United Nations (UN) in 2015 to drive progress towards the 2030 Sustainable Development Goals (SDGs) for Reproductive, Maternal, Newborn, Child and Adolescent Health and Nutrition (RMNCAH-N).
The GFF Investors Group, which includes bilateral and multilateral donors, such as Gavi, the Global Fund to Fight AIDS, Tuberculosis and Malaria, the H6 partnership (UNFPA, UNICEF, UN Women, WHO, UNAIDS and the World Bank Group), civil societies, governments and the private sector, plays a critical role by engaging important stakeholders in low-income and middle-income countries (LMICs) and providing financial and technical assistance with a mandate that extends beyond a single disease-based or intervention-centred focus. The GFF focuses on strengthening health systems, increasing the effective coverage of RMNCAH-N interventions and providing financial protection, to support countries as they work towards Universal Health Coverage (UHC). To date, 27 ii countries are participating in the GFF and 23 more will join as part of GFF’s next phase for the period 2018–2023.
The GFF model offers technical support to countries to identify options for increasing health and nutrition resources, and one strength of the GFF partnership is the emphasis on long-term sustainability. The GFF is hosted at the World Bank, which supports Ministries of Finance on macroeconomic and fiscal, and public financial management issues. Therefore, the GFF can serve as a bridge to ensure an effective dialogue between ministries of health and finance, and also play a key coordinating role in support of a coherent and coordinated vision for financing of the health system.
GFF engagement in countries aims to bring together the collective funding and action of key partners to promote timely, efficient and coordinated in-country prioritisation and resource planning. Therefore, the foundation of the GFF model2 centres on a country-led investment case, as a process to identify—and build consensus around—priority interventions to improve RMNCAH-N outcomes and coordinate the financing of these priorities. Based on the investment case and a sharpened strategic plan, the GFF supports countries to increase efficiency and sustainability, addressing the largest and most pressing needs. The investment case is funded through public domestic resources, private sector investment and alignment of bilateral and other external financing, including GFF funds linked with International Development Association (IDA) and International Bank for Reconstruction and Development (IBRD) financing. In Liberia, for example, the country-led investment case prioritised six core areas iii with >10 financiers coming together to fund these priorities (including domestic resources, multilateral and bilateral partners joining as co-financiers). Additionally, resource mapping highlighted a funding gap for these priorities, which was then used to mobilise additional funding.3
Domestic resource mobilisation (DRM) is central to the GFF agenda, and in some cases, support for DRM has been done by linking disbursements of GFF/IDA-supported credits to government protection or allocation of more of their domestic budget to health (eg, Mozambique and Kenya). Another example is the buy-down of IBRD interest payments linked to increased domestic resources to social sectors in Guatemala v . Going forward, the GFF ambition is to widen the set of innovative financing instruments and ensure that they are aligned with incentive structures used by other financiers to further increase impact. These efforts contribute to the work of others, such as the Joint Learning Network, UHC2030, IHP+ and others focusing on a collaborative approach to financing of the health system.
The GFF also supports governments’ efforts to align other complementary sources of financing around the national priorities of the investment case. For example, the Contrat Unique in DRC align all multilateral and bilateral financiers in support of a single, integrated provincial health action plan, reducing the fragmentation of financing. In the Democratic Republic of the Congo (DRC), the GFF also supports strategic purchasing, paying health facilities based on their performance and providing financial incentives to increase the quantity and quality of the essential RMNCAH-N services. In many countries, including DRC, Mozambique and Cameroon, the GFF has also supported an increase in the allocation of budgetary resources to front-line providers to strengthen primary healthcare services at community level.3 The GFF also supports efficiency gains through strategic use of private sector capacity and expertise focused on increasing private financing for RMNCAH-N, improving the enabling environment (regulatory and policy) for private actors in national health systems and building government capacity to manage private sector engagement to benefit low-income women, children and adolescents. In several countries (eg, Cameroon, DRC and Uganda vi ) that have included private providers in results-based financing projects, the GFF supports capacity building for the Ministry of Health (MoH) on how to establish and manage private sector contracts. In addition, GFF finances private sector assessments and other analytics to support governments in identifying and designing private sector-related initiatives.
Results monitoring is vital to the success of this approach. Having access to routine data is critical to guide the planning, coordination and implementation by all stakeholders, and specifically to assess the effectiveness of the programme and identify areas needing improvement during implementation. Therefore, the GFF supports in-country investments in health and financial information systems, logistics management information systems and human resource capacity, strengthening existing national systems.
The GFF model described above combines the resources of the GFF Trust Fund and the multiple sources that it leverages, in support of and in response to RMNCAH-N needs. Assuming that the GFF Trust Fund will be able to disburse US$2.6 billion vii linked to IDA/IBRD across 50 countries, the goal of this paper is to estimate the impact of the GFF partnership. We examine the additional resources that could be mobilised, the prioritisation of interventions and alignment of resources leading to greater coverage of RMNCAH-N interventions that those resources could buy, and the improved health and nutrition outcomes as a result.
Methods
For these analyses, estimates were produced for scenarios based on a range of assumptions. The impact of the GFF model can be derived by comparing the difference in outcomes between a counterfactual scenario (either ‘historic trends’ with intervention coverage changing at historic rates or a ‘flat baseline’ which assumes no coverage changes from 2016 onwards) versus a scenario assuming concerted efforts catalysed by the GFF model. We present both historic and flatlined scenarios as counterfactuals given that the true baseline would be located in between the range of flatlined and historic trends. A best-case scenario was also developed to examine the goal of UHC with 90% coverage of most interventions by 2030. No attempt was made to attribute impact to any individual partner; rather, impact was attributed to the collective contributions that could be aligned around the combined GFF model (including the contributions of partners such as Gavi, UNAIDS and others).
Resource modelling
Availability of resources for the funding of high-priority RMNCAH-N interventions was modelled by year and by country for three scenarios: historic trend, GFF conservative and GFF ambitious. Resource availability in the first year of the period was set equal to the cost of achieving actual coverage rates for that year, derived from the LiST Costing4 tool. Expenditure on RMNCAH-N priority interventions was grouped by four sources according to shares estimated in the literature5—public domestic, development assistance for health, out-of-pocket (OOP) payments and private prepaid (ie, private health insurance) plus efficiency gains which are treated as an extra source of resources. After 2017, each source of funding was projected forward to 2030 by applying assumptions that reflect how the GFF model can achieve change by influencing:
The share of domestic government expenditure which is allocated to health.
The share of health budgets allocated to priority RMNCAH-N interventions.
The scale of external resources aligned around country investment cases (of which a proportion is assumed to be incremental).
Allocative and technical efficiency gains, including those from strategic leveraging of private sector.
Private sector financial flows are explicitly included in the resource model as part of the funds aligned around the investment case, in addition to those other financial flows enabled by the GFF’s private sector engagement (eg, investor capital raised through bonds and channelled through IBRD, private health investment to deliver publicly funded services included as domestic resources, etc). The efficiency gains linked to private sector engagement in the model reflect the GFF’s support to enabling environment reforms, strategic purchasing and capacity building for governments to leverage private sector in key health system areas.
A separate potential GFF-driven effect on private prepaid health expenditure was not modelled. A summary of underlying assumptions (table 1a) and their sources (table 1b) is provided for each resource mobilisation scenario. Further description about the resource modelling exercise is provided in the technical annex for this paper.
Table 1a.
Assumptions applied in resource mobilisation modelling (see table 1b for source references)
| Unit | Constant | Historic trends | GFF conservative | GFF ambitious | Assumptions and comments | Source | |
| 2017 baseline assumptions | |||||||
| 2017 resource envelope | $ | 21 784 338 900 | The expenditure in this baseline year on the priority set of RMNCAH-N interventions is equal to the cost of providing current levels of coverage (estimated using List Costing module). | 8 | |||
| Adjustment to % OOP in expenditure | % | 50.5 | The proportion of OOP was adapted from a source4 which estimates the relevant splits for general health expenditure. Given that these particular interventions are more likely to be publicly or donor-funded than general health expenditure, OOP payments were scaled downwards. The c.50% adjustment was derived from evidence for a subset of GFF countries which suggests that about half of OOP payments are used to buy medicines/medical supplies. | 7 | |||
| Split of 2017 expenditure—LMIC (post-OOP adjustment) | The split across different sources of financing (without the OOP adjustment) was based on work from Global Burden of Disease Health Financing Collaborator Network. | 4 | |||||
| Domestic | % | 53.1 | |||||
| Private prepaid | % | 12.4 | |||||
| OOP | % | 29.2 | |||||
| DAH | % | 5.3 | |||||
| Split of 2017 expenditure—LIC (post-OOP adjustment) | 4 | ||||||
| Domestic | % | 29.3 | |||||
| Private prepaid | % | 9.8 | |||||
| OOP | % | 20.1 | |||||
| DAH | % | 40.9 | |||||
| Domestic resource growth assumptions | |||||||
| GDP growth forecast | The model uses IMF forecasts out to 2022, then follows the approach used in Stenberg et al to forecast GDP trajectories for each country: assuming that real growth rates will converge from their 2017–2022 averages to 2% in 2070. The model is sensitive to GDP growth but, since the GFF does not aim to directly influence GDP, it is treated as exogenous for the purposes of this model. Similarly, the share of government expenditure in GDP is held constant across all scenarios. | 1 | |||||
| Convergence year | Year | 2070 | |||||
| Convergence growth rate | % | 2.0 | |||||
| % GGE/GDP | text | Constant | Constant: The model considers that this share does not change. This may be an underestimation if recent trends continue. For instance, total tax revenue rose from 11% to 14% of GDP in LICs and from 13% to 19% of GDP in LMICs between 1990 and 2012, while revenue growth was generally static in HICs. (Junquera-Varela et al) | 1 | |||
| % GGHE/GGE | Text | Constant | Upwards convergence to median for income-region group; during IC only | Upwards convergence to median for income-region group; tapering off after IC (halving each year) | The share of government budgets spent on health is held constant under the trend scenario (based on analysis of historic trends), and to rise under the conservative and ambitious scenarios. In the ambitious scenario, countries below the median for their income level/regional grouping are assumed to increase that share such that they would catch up by 2030, though progress tails away after their investment case period ends. In the conservative scenario, progress finishes completely at the end of the investment period. | 2 | |
| ↑% priority interventions / GGHE, 2017–2030 | pp | 1 | 2 | The share of health budgets spent on the priority RMNCAH-N interventions is held constant under the trend scenario and increases by 1 and 2 percentage points (pp) by 2030 under the conservative and ambitious scenarios respectively. The levels of improvement were chosen to give a range of results which were in reasonable proportion to baseline levels (c. 8%). | 7 | ||
| DAH/external resource aligned with the investment case (IC) growth assumptions | |||||||
| Summary DAH growth assumptions | |||||||
| DAH | Text | Constant | Constant +incremental external IC resources, tapering off after IC | Constant +incremental external IC resources, tapering off after IC | External resources aligned with the investment case (IC) are modelled assuming that a proportion of those resources would be additional relative to the counterfactual (in the sense that they would not otherwise have been allocated to this set of interventions). After the investment case period finishes, the model assumes that additional resources taper away quickly, though with some degree of sustainability. | 3 | |
| Investment case period funding | |||||||
| GFF Trust Fund resources available | $ | 2 600 000 000 | 6 | ||||
| GFF Trust Fund disbursement timing | Text | Uniform distribution | 6 | ||||
| Ratio of GFF Trust Fund resources to other resources during investment case phase | 6 | ||||||
| IDA/IBRD | Ratio | n/a | 4.0 | 6.0 | |||
| External | Ratio | n/a | 6.0 | 8.0 | |||
| Private | Ratio | n/a | 1.0 | 1.5 | |||
| Adjustment to domestic expenditure for infrastructure costs which may not be included in investment case | % | 102 | 8 | ||||
| Post-investment case period funding | |||||||
| Growth rate (‘−’ implies declining sustainability after IC ends) | 7 | ||||||
| IDA/IBRD | % | n/a | −75 | −50 | |||
| External | % | n/a | −75 | −50 | |||
| Private | % | n/a | −75 | −50 | |||
| Proportion of investment case resources assumed to be incremental (relative to trend) | |||||||
| GFF Trust Fund resources | % | 100 | 8 | ||||
| Other external resources | % | n/a | 22 | 28 | 8 | ||
| OOP payment growth assumptions | |||||||
| OOP growth rate assumption | Text | Forecast from literature, by income group | OOP sources of health expenditure are assumed to follow trend growth rates estimated in the wider literature, but are also assumed to reduce in proportion to increases in other sources of health funding. That is, a fraction of every dollar of additional funding mobilised is assumed to replace OOP spending rather than being available to scale-up coverage rates. The coefficient used to characterise the relationship between OOP spending and other funding sources is based on CEPA analysis of estimates from the literature and could benefit from further research. | 4 | |||
| OOP average annualised growth rate, 2015–20 30 | 4 | ||||||
| LMIC | % | 4.0 | |||||
| LIC | % | 1.5 | |||||
| Elasticity of OOP w.r.t. other resources | % | −8.4 | 5 | ||||
| Private pre-paid (insurance) growth assumptions | |||||||
| PPP growth rate assumption | Text | Forecast from literature, by income group | Private prepaid sources of health expenditure are assumed to follow trend growth rates estimated in the wider literature, and are otherwise treated as exogenous. Although the GFF may perform some activities encouraging uptake of private health insurance, they are not incorporated in this model. | 4 | |||
| PPP average annualised growth rate, 2015–20 30 | 4 | ||||||
| LMIC | % | 4.6 | |||||
| LIC | % | 3.8 | |||||
| Efficiency gain assumptions | |||||||
| Efficiency gains (achieved by 2030) | Efficiency gain includes any intervention that reduces the cost of achieving a given coverage rate (efficiency) or which increases the health impact that can be achieved with a given set of resources (effectiveness). For instance, improved alignment around investment cases or better prioritisation of essential interventions could both be represented as efficiency gains. The model expressed these gains as an expansion of the overall resource envelope above and beyond each individual source. Efficiency gains are modelled at different rates of progress over distinct parts of the resource envelope which the GFF could claim to influence. For instance, the GFF Partnership may have large opportunities to improve alignment around investment case resources, but less around non-investment case resources and none around OOP payments. |
9 | |||||
| Domestic | % | 0.0 | 2.5 | 5.0 | |||
| Private prepaid | % | 0.0 | 2.5 | 5.0 | |||
| OOP | % | 0.0 | 0.0 | 0.0 | |||
| DAH | % | 0.0 | 2.5 | 5.0% | |||
| Investment case resources (not additive) | % | n/a | 6.0 | 12.0 | |||
DAH, development assistance for health; GDP, gross domestic product; GFF, Global Financing Facility; GGE, General Government Expenditure; GGHE, General Government Health Expenditure; HIC, high-income countries; IBRD, International Bank for Reconstruction and Development; IDA, International Development Association; IMF, International Monetary Fund; LMIC, low-income and middle-income countries; OOP, out-of-pocket; RMNCAH-N, Reproductive, Maternal, Newborn, Child and Adolescent Health and Nutrition; CEPA, Cambridge Economic Policy Associates; PPP, Private pre-paid.
Table 1b.
Sources used in resource mobilisation modelling
| # | Source | Input | Period | Unit |
| 1 | IMF Economic Outlook* | GDP, forecast, by country | 2017–2018 | 2017 US$ |
| GDP real growth rates, forecast, by country | 2017–2022 | % | ||
| GGE as % of GDP, by country | 2000–2022 | % | ||
| GDP, forecast, by country | 2017–2018 | 2017 US$ | ||
| 2 | WHO NHA database† | GGHE as % of GGE, by country | 2000–2015 | % |
| 3 | IHME DAH database‡ | DAH, by country | 2000–2016 | 2017 US$ |
| Est. % of DAH allocated to maternal health, by country | 2000–2016 | % | ||
| Est. % of DAH allocated to child health, by country | 2000–2016 | % | ||
| 4 | Global Burden of Disease Health Financing Collaborator Network§ | Split of current health expenditure by source, LIC/LMIC | 2015 | % |
| Out-of-pocket/private prepaid growth forecasts, LIC/LMIC | 2015–2030 | % p.a. | ||
| 5 | Results for Development Institute¶ | Elasticity of out-of-pocket payments with respect to other funding sources (above trend) | – | % |
| 6 | GFF Secretariat forecasts (for modelling purposes only) | Assumed allocation of GFF Trust Fund resources, by country | 2017–2030 | 2017 US$ |
| Assumed investment case start/end years, by country | 2017–2030 | 2017 US$ | ||
| Ratio of GFF Trust Fund resources to other resources during investment case phase | – | Ratio | ||
| 7 | CEPA assumption based on discussion with GFF Secretariat | Annual decline in investment case funding post-investment case | – | % p.a. |
| Adjustment to split of expenditure on priority RMNCAH-N interventions by source, reducing out-of-pocket share relative to general health expenditure | – | % | ||
| 8 | CEPA analysis of Avenir Health cost modelling | Adjustment to domestic expenditure for infrastructure costs which may not be included in investment case | – | % |
| Proportion of investment case resources assumed to be incremental (ie, available to fund scale-up) | – | % | ||
| 9 | CEPA analysis of WHO World Health Report 2010** | Efficiency gains achievable by end of period | – | % |
IMF, International Monetary Fund; National Health Accounts; DAH, development assistance for health; GDP, gross domestic product; GFF, Global Financing Facility; GGHE, General Government Health Expenditure; GGE, General Government Expenditure; LIC, low-income countries; LMIC, low-income and middle-income countries; RMNCAH-N, Reproductive, Maternal, Newborn, Child and Adolescent Health and Nutrition.
Impact modelling
The Lives Saved Tool (LiST) is a linear, deterministic model6 that has been used to estimate the impact of changes in intervention coverage on primary causes of maternal, neonatal7 and child death8 as well as stillbirths and other health-related outcomes (eg, disease incidence,9 prevalence of stunting and wasting as risk factors). LiST has been used for country-led analyses10 and to estimate costs and health impact to support investment frameworks.11 The LiST model includes about 80 interventions that either directly affect mortality of children under five or indirectly affect mortality through intermediate factors such as stunting and wasting (table 2). The evidence-based module is a robust, integrated platform with linkages to demography, family planning (FP) and HIV/AIDS.12
Table 2*.
Coverage of modelled interventions at baseline and endline by scenario (weighted by total population)*
| Category | Intervention | Baseline in 2016 (%) | Endline in 2030 (%) | |||
| Historic trends | GFF Conservative | GFF Ambitious | Best case | |||
| Antenatal period | Balanced energy supplementation | 0 | – | 0 | 30 | 90 |
| Diabetes case management | 21 | 38 | 70 | 70 | 90 | |
| Hypertensive disorder case management | 49 | 61 | 71 | 71 | 90 | |
| Intermittent preventive treatment of malaria during pregnancy | 41 | 94 | 94 | 94 | 94 | |
| MgSO4 management of pre-eclampsia | 32 | 50 | 70 | 70 | 90 | |
| Multiple micronutrient supplementation in pregnancy | 0 | – | 82 | 82 | 90 | |
| Syphilis detection and treatment | 19 | 25 | 70 | 70 | 90 | |
| Tetanus toxoid vaccination | 86 | 91 | 91 | 91 | 91 | |
| Childbirth period | Induction of labour for pregnancies lasting 41+weeks (tertiary care) | 33 | 47 | 81 | 81 | 90 |
| Interventions associated with health facility delivery: antibiotics for pPRoM, MgSO4 management of eclampsia, active management of the third stage of labour | 42 | 78 | 81 | 81 | 90 | |
| Interventions associated with skilled birth attendance: clean birth practices, labour and delivery management, immediate assessment and stimulation of neonate | 67 | 82 | 85 | 85 | 90 | |
| Neonatal resuscitation (facility-based) | 59 | 78 | 81 | 81 | 90 | |
| Postnatal period | Breastfeeding promotion | 45 | 45 | 70 | 70 | 90 |
| Immunisation *Projected trends from Gavi |
Measles vaccine* | 81 | 89 | 89 | 89 | 90 |
| Meningococcal vaccine | 0 | – | 70 | 70 | 90 | |
| Pentavalent vaccine* (diphtheria, tetanus, pertussis, hepatitis B and Haemophilus influenzae type b) | 82 | 85 | 85 | 85 | 90 | |
| Pneumococcal vaccine* | 32 | 84 | 84 | 84 | 90 | |
| Rotavirus vaccine* | 16 | 84 | 84 | 84 | 90 | |
| Preventive services | Chlorhexidine | 0 | – | 70 | 70 | 90 |
| Clean postnatal practices | 34 | 51 | 76 | 76 | 90 | |
| Hand washing with soap | 57 | 55 | 72 | 72 | 90 | |
| ITN/IRS: households protected from malaria | 27 | 49 | 82 | 82 | 90 | |
| Infant and young child feeding promotion:education only about appropriate complementary feeding | 25 | 21 | 70 | 70 | 90 | |
| Supplemental food and education for children ages 6–23 months from food-insecure households | 25 | 21 | 25 | 55 | 55 | |
| Vitamin A supplementation | 79 | 92 | 93 | 93 | 93 | |
| Curative | Antibiotics for treatment of dysentery | 18 | 23 | 70 | 70 | 90 |
| Case management of neonatal prematurity including kangaroo mother care | 0 | – | 70 | 70 | 90 | |
| Case management of neonatal sepsis/pneumonia with injectable antibiotics | 0 | 78 | 81 | 81 | 90 | |
| Maternal sepsis case management | 0 | – | 70 | 70 | 90 | |
| Oral antibiotics for pneumonia | 62 | 67 | 74 | 74 | 90 | |
| Oral rehydration solution | 42 | 53 | 71 | 71 | 90 | |
| Treatment for severe acute malnutrition with food supplementation | 3 | 13 | 3 | 34 | 34 | |
| Treatment of malaria with artemisinin compounds | 5 | 23 | 73 | 73 | 90 | |
| Vitamin A for treatment of measles | 79 | 92 | 93 | 93 | 93 | |
| Zinc for treatment of diarrhoea | 14 | 18 | 70 | 70 | 90 | |
| HIV/AIDS interventions (eg, Prevention of mother-to-child transmission (PMTCT), cotrimoxazole, antiretroviral therapy (ART)) |
Projected trends from UNAIDS Reference Group on Estimates, Models and Projections (UNAIDS) | |||||
| Family planning | Projected trends from UN Population Division 2017 Revision of World Population Prospects | Projected trends from UN Population Division 2017 Revision of World Population Prospects OR 75% of current demand satisfied with modern methods by 2030 | ||||
Intervention coverage follows a pattern of historic change if this projected coverage in 2030 is greater than the preset or designated target (eg, 70%). Interventions with current baseline coverage exceeding the target were held constant through 2030.
IRS, Indoor residual spraying; ITN, Insecticide-treated bednet.
For each country, a LiST model was created with mortality at baseline based on UN and WHO rates estimated for 2016 and coverage levels ascertained for each intervention based on validated indicators or related proxies reported in the most recent nationally-representative survey or similar data source. A set of modelled scenarios were created for each country to reflect: baseline (flat), historic trends, GFF conservative, GFF ambitious and best case (90%) coverage assumptions.
Trends over time were set either to reach an end-line target with a linear increase or to account for expected roll-out for certain interventions where projections have been developed (eg, Gavi’s vaccine demand forecasts, country-specific profiles from UNAIDS for HIV/AIDS-related interventions). If changes in coverage based on past performance patterns were greater than targeted increases, intervention expansion was assumed to continue along this same higher trajectory following historic trends (table 2). Coverage for any intervention already above the designated target was held constant over the period. All health impacts were estimated using the LiST V.5.69 b9.
Costing approach
Costs associated with the delivery of interventions spanning across the continuum of care were calculated and compared using the LiST Costing4 module, the OneHealth Tool (OHT), and Excel analysis. Service delivery costs were estimated based on volume of clients and include cost categories for drugs and consumables, labour and the costs of inpatient days and outpatient visits. Costs for inpatient days and outpatient visits were drawn from WHO CHOICE estimates. CHOICE costs represent the whole service delivery cost; LiST costing disaggregates labour, other recurrent and capital costs within the visit/day cost.4 13
Target populations and those in need of services were estimated based on demographic projections, LiST estimates for incidence and aetiology, and literature on incidence and prevalence of various conditions. The cost per case was estimated using an ingredients approach which incorporated quantities and cost of drugs and supplies, provider time and numbers of inpatient and outpatient visits from the OHT databases developed with WHO. RMNCAH-N programme costs such as supervision, training and monitoring and evaluation were calculated as an additional percentage of intervention costs while logistics and wastage costs were estimated as a percentage of commodity costs. The estimates of the additional programme costs were drawn from work completed by R4D to estimate above service delivery costs and represented an additional 15% over and above service delivery costs, applied equally to all interventions.14
Above service delivery costs such as infrastructure investments to support service expansion and other health system costs were estimated based on the ratio of infrastructure investments needed to increase health service coverage, and other health system costs to the commodity, labour and service delivery costs associated with interventions. These ratios and percentages vary by country income level and build on previous efforts5 11 to estimate the cost and impact of packages of health services, which rely on a WHO model to estimate programme area and health system requirements and costs. This work used secondary analysis of the outputs of the WHO model reported in a 2014 global investment case11 to estimate these costs as a percentage over and above intervention costs. Inefficiencies of 17.5% were added on to labour, service delivery, infrastructure and other health system costs based on 2010 World Health Report5 estimates of inefficient spending.
Coverage scale-up in the GFF conservative and ambitious scenarios was constrained by the estimated resources available. Comparisons between modelled scenarios with or without GFF-funded resources were used to quantify health outcomes and estimate incremental costs required to achieve these relative gains.
Results
Resources
With US$2.6 billion of GFF Trust Fund resources, the GFF model could collectively mobilise US$50–75 billion of additional funds for scaling-up priority RMNCAH-N interventions in 50 high-burden countries between 2017 and 2030. Figure 1 presents estimated resource availability under each scenario and figure 2 presents resource availability by source, demonstrating that the greatest share of additional funds would come from domestic sources (approximately 70% of total gains or US$36.1–51.1 billion). Increases in public and external funding for RMNCAH-N service provision could also be expected to reduce the burden of OOP payments by up to US$6 billion (figure 2).
Figure 1.
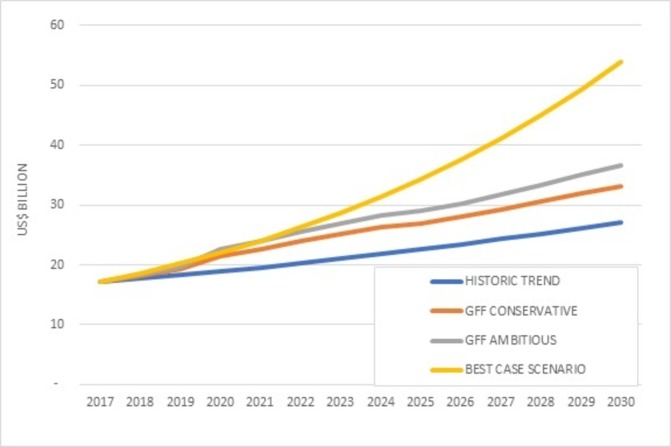
Closing the gap in resource needs for RMNCAH-N
Figure 2.
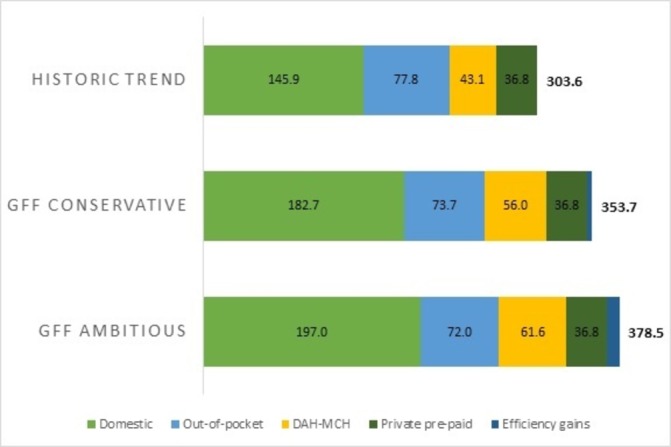
Forecasts of resource availability for priority RMNCAH-N interventions in 50 target countries, 2017-2030 by source
Mortality and nutrition impact
Aligned with these available resources, scale-up of interventions on a conservative or more ambitious scale would yield a total of 34.2–34.7 million deaths averted by 2030 relative to flat baseline coverage and 11.9–12.4 million deaths averted relative to a continuation of historic trends (figure 3). A total of 269.3–275.7 million cases of stunting would be averted by 2030 compared with baseline coverage and 97.7–104.1 million cases averted if compared with continued historic trends (figure 3). Under-five and neonatal mortality and stillbirth rates would decline by 34%–35%, 34% and 32%–33%, respectively, by 2030 compared with baseline (table 3). The relatively small difference in impact between the conservative and ambitious funding scenarios is due to the assumption that the most cost-effective interventions will be scaled up first in the conservative scenario, leaving less cost-effective interventions focused mainly on nutrition gains (ie, balanced energy supplementation, supplemental food and education for children ages 6–23 months from food-insecure households, treatment for severe acute malnutrition (SAM) with food supplementation) to be scaled-up with the additional resources under the ambitious scenario (table 2).
Figure 3.

Cumulative impact of GFF on a.) mortality and b.) stunting in 50 target countries, 2017-2030, relative to historic trends (dotted) and baseline (solid)
Table 3.
Mortality rates and prevalence of stunting in 2030 by scenario
| Under-five mortality rate (deaths per 1000 live births) | Neonatal mortality rate (deaths per 1000 live births) | Maternal mortality ratio (deaths per 100 000 live births) | Stillbirth rate (stillbirths per 1000 total births) | Stunting (<–2 SD) prevalence | ||||||
| Rate | Per cent difference | Rate | Per cent difference | Rate | Per cent difference | Rate | Per cent difference | Rate | Per cent difference | |
| Baseline | 61.1 | – | 27.0 | – | 372.1 | – | 26.4 | – | 37.2 | – |
| Historic trends | 48.7 | 20 ↓ | 21.9 | 19 ↓ | 316.7 | 15 ↓ | 22.8 | 13 ↓ | 36.9 | 1 ↓ |
| Global Financing Facility model (conservative-ambitious) | 40.5–40.0 | 34–35 ↓ | 17.8–17.7 | 34 ↓ | 252.9 | 32 ↓ | 18.0–17.6 | 32–33 ↓ | 34.9–34.7 | 6–7 ↓ |
| Best case (90%) | 34.7 | 43 ↓ | 15.1 | 44 ↓ | 225.3 | 39 ↓ | 15.7 | 41 ↓ | 33.7 | 9 ↓ |
SD, standard deviations.
Table 4 shows that increasing coverage of interventions to 90% by 2030 would produce an estimated 43% reduction in the under-five mortality rate, 44% drop in neonatal mortality rate, 39% decline in maternal mortality ratio, 41% decrease in stillbirth rate and 9% drop in the prevalence of stunting among children under five. However, reaching 90% coverage in a best case scenario still leaves many countries falling short of achieving the SDG3 targets (table 4).
Table 4.
Number of countries that reach Sustainable Development Goals (SDG) or global targets under different scenarios
| Neonatal mortality rate | Uinder-five mortality rate | Maternal mortality ratio | Stillbirth rate | |||||
| Baseline | 1 | 2% | 1 | 2% | 1 | 2% | 4 | 8% |
| Historic trends | 4 | 8% | 4 | 8% | 2 | 4% | 4 | 8% |
| Global Financing Facility model (conservative-ambitious) | 8 | 16% | 7 | 14% | 2 | 4% | 8 | 18% |
| Best case (90%) | 11 | 22% | 7 | 14% | 3 | 6% | 12 | 24% |
SDG: 3.1 By 2030, reduce the global maternal mortality ratio to less than 70 per 100 000 live births.
SDG: 3.2 By 2030, end preventable deaths of newborns and children under 5 years of age, with all countries aiming to reduce neonatal mortality to at least as low as 12 per 1000 live births and under-ive mortality to at least as low as 25 per 1000 live births.
Every Newborn Action Plan has set stillbirth target of 12 per 1000 births or less by 2030.
In all coverage scenarios, the contribution of FP was examined by comparing scenarios with and without scale-up of contraception. Impact was estimated as ‘deaths averted’ or a reduction in the number of deaths due to a lower number of births. Scale-up of FP accounted for approximately 33% of the overall drop in mortality when decreasing fertility was modelled in conjunction with expanded delivery of life-saving health interventions.
Costs
Approximately half of the costs associated with expanding delivery of RMNACH-N interventions in this sample of 50 LMICs would be attributable to intervention or programme costs and the remaining half would be associated with health system costs and inefficient spending. The coverage scale-up in conservative and ambitious scenarios would imply additional costs of US$43.7–70.8 billion above the historic trend between 2017 and 2030, with average cost per death averted ranging between US$1452 and US$5716 depending on the scale-up scenario and counterfactual (table 5). Cost per death averted by intervention ranged from negative (representing a preventive care intervention which reduces total costs) to US$16 000 per intervention, depending on the cost for delivering the care, epidemiology and the effectiveness of the intervention.
Table 5.
Cost per death averted by scale-up and comparison scenario (US$)
| Scale-up scenario | Historic trends | GFF Conservative | GFF Ambitious | ||
| Counterfactual | Baseline | Baseline | Historic trends | Baseline | Historic trends |
| Deaths averted | 22 326 300 | 34 194 600 | 11 868 300 | 34 720 000 | 12 393 700 |
| Incremental intervention cost (US$ billion) | 16.25 | 30.84 | 14.60 | 46.97 | 30.72 |
| Intervention cost per death averted | 728 | 902 | 1230 | 1353 | 2479 |
| Incremental total cost (US$ billion) | 32.4 | 76.1 | 43.7 | 103.3 | 70.8 |
| Total cost per death averted | 1452 | 2225 | 3678 | 2974 | 5716 |
Discussion
In this analysis, we estimate the contribution of the GFF partnership which seeks to push financing reforms further, improve prioritisation and delivery of key RMNCAH-N interventions, catalyse multiple sources of financing and improve lives with better health and nutrition outcomes by 2030. We estimated that with US$2.6 billion GFF Trust Fund resources, the GFF model could collectively mobilise US$50–75 billion of additional resources (compared with historic trends), based on an increase in domestic resources, alignment of bilateral resources and other external funds for health and nutrition, reduction of OOP payments, private sector investment and gains from both technical and allocative efficiencies. By directing these much-needed additional funds to RMNCAH-N programming, 12.4–34.7 million additional maternal, child and newborn lives could be saved, and stillbirths prevented compared with historic trends or a flatlined scenario, respectively. This range depends on the counterfactuals applied for comparison as it cannot be assumed that trends in coverage will continue as they have for the next 12 years, nor can we assume a scenario in which resources are stagnant and intervention coverage does not increase at all.
Costs from this modelling exercise are comparable to estimates from Stenberg11 and the 2015 GFF business plan,8 with cost per death averted of around $3350. The ratio of health system costs to direct costs was also consistent with earlier work, with infrastructure investments frontloaded in the time period to facilitate rapid scale-up of intervention coverage. Estimates for infrastructure investment were apportioned to the first five years of the analysis. This lays the initial groundwork needed in health systems strengthening to enable an increase in service utilisation.
If the GFF Trust Fund (TF)s replenishment exceeds or falls short of expectations, then the estimated impact would be greater or less, though the relationship may not be one-for-one. The GFF TF flexible grant financing is critical to the mobilisation of resources, but concerted efforts of all partners under the leadership of government are needed to ensure that additional resources are allocated to health and nutrition, particularly from domestic resources because of the expected income growth over the reference time period, and from crowding in of private sector financing.
Many low-income countries will struggle to reach the global targets set forth by the UN SDGs for maternal, newborn and child survival. In our most ambitious scenario, we have assumed that the historic growth in spending continues with support from multilateral and bilaterals for RMNCAH-N programming. Even when applying the most optimistic assumptions about the effects of GFF resource mobilisation, from these models, still many low-income countries would not have sufficient financial resources to efficiently implement full coverage of interventions that would be required to set the SDG targets within reach. In part, the uphill challenge to reach global targets even given large increases in available financing for RMNCAH interventions is due to the increased complexity and greater costs for interventions needed to address the remaining causes of maternal and child deaths, as mortality declines. Perhaps some of the unmet financial need can be reduced with the development and introduction of lower-cost and more effective interventions.
As low-income and lower-middle-income countries experience economic growth, they are likely to experience a transition in health financing away from dependency on development assistance for health and OOP payments and towards more public and private prepaid and pooled expenditures.15 Economic development has been positively correlated with increases in per capita health expenditure and reductions in OOP and development assistance.16 Among countries that have carried out fiscal space analyses, some (including Bangladesh17 and Cote d’Ivoire18) show sufficient fiscal space created through GDP growth and prioritisation of health in the budget. Though there will be variations over time and across countries, overall it is likely that there will be sufficient fiscal space for the additional resources that we have assumed, with the exception of some countries, such as Malawi, where there is limited fiscal space in the short term.19
The development of an evidence-based, high-quality and prioritised investment case informs budget decisions and strengthens the health sector’s case for increased government resources. The GFF also supports governments to draw on private sector resources and expertise to complement public delivery for key interventions. For instance, the GFF has been supporting several countries (including fragile and conflict-affected areas of Northeast Nigeria and DRC) to contract with private for-profit and not-for-profit service providers to deliver essential services through performance-based financing and contracting, often at multistate and national scale. It is also providing significant capacity building support to ministries of health to manage these contracts with private sector and supporting improvements in licensing and regulation of private providers in countries like Kenya and Uganda, which helps ensure quality standards in the care delivered.
The importance of seeking sustainable funding sources now is paramount because health system costs and infrastructure investments were frontloaded in our cost modelling to facilitate rapid scale-up of intervention coverage. This aligns with the GFF approach which supports health systems strengthening to ensure the sustainability of investments and increase the system’s capacity to absorb new funds. In several countries, the GFF partnership supports public financial management reforms aimed at improving budget preparation, execution and monitoring (eg, in Cameroon, Guinea, DRC, Mozambique); building capacity and strengthening different health system functions such as human resources investments (eg, in Cameroon, DRC, Liberia, Senegal, Tanzania); and health and financial information systems and supply chain (eg, in Cameroon, Guinea, Tanzania and others).
Limitations
We acknowledge the limitations of modelling to quantify and project future health and nutrition impacts.20 21 To reflect the inherent uncertainty, we reported our estimates as ranges to encompass various ‘what if’ conditions with greater confidence. The approach of the LiST model relies on cause-specific efficacy and applying the impact of each intervention to the residual deaths remaining after the set of previous interventions ensures that these estimates have avoided double counting. We also recognise that such global estimates—although generated, where possible, from bottom-up analysis of actual country-level data—have value first and foremost at the global level.
Country-specific contextual factors based on disease burden, current intervention coverage and mortality were incorporated in the impact and cost models, but health system contributors or sociocultural influences may not have been fully modelled. The impact of the GFF investment on adolescent health, for example, was not explicitly examined in this analysis although some specific interventions (eg, family planning and HIV/AIDS interventions) targeting adolescents were included in our modelling scenarios. GFF relies on a multisectoral approach and broader infrastructure improvements which may be needed and are an integral part of several country investment cases may not have been fully captured in these models. The focus of interventions related to nutrition centred on health although much of what needs to be done for undernutrition may rely on interventions outside of the health sector (eg, agriculture)22 which were not included in either our impact or costing estimates.
The analyses presented here include interventions and costs currently available, although this landscape may change between now and 2030. There may be reductions in costs for drugs and vaccines as well as successes in areas such as polio eradication and reduction in HIV incidence that will result in savings that could then be shifted to expand the financing available for higher levels of coverage for other RMNCAH-N interventions. The analyses presented here should be a reminder that the GFF is a pathfinder for sustainable innovative financing and that current GFF-supported health finance reforms and implementations plans will benefit from continued financial and technical assessment and innovation, support for financially sustainable investments and drawing in significant amounts of private capital in parallel to GFF expansion during the SDG era.
As mentioned, the GFF model centres on individual country-specific investment cases and a limitation of this analysis was that we were not able to capture some of the variations in focus of each GFF-supported country but used one core intervention package across the financing scenarios. The level of data abstraction needed from in-country sources to forecast for each country individually was not yet possible as presently only 16 countries have completed their GFF investment cases and mapped their resources to it. As more information on GFF countries becomes available, additional analyses will be done to track progress.
Lastly, evidence on programme and health system costs is less precisely estimated than intervention costs where clear service delivery guidance and norms are in place. In our costing approach, the cost elements for service delivery are calculated based on service delivery volume and costs, derived from ratios of health system, infrastructure investment and programme costs calculated from the 2014 RMCH Investment case. Estimates for parameters which cannot be feasibly measured in each country for each intervention may be misspecified and the degree and contribution of this potential bias is not fully known. Due diligence was consistently applied to align our analysis with similar exercises completed previously in a concerted effort to minimise inaccuracies or false assumptions.
Conclusion
Innovative and sustainable development financing spearheaded by the GFF aimed to transform how countries prioritise and finance the health and nutrition of women, children and adolescents is critical to advance beyond the current trajectory towards universal coverage. Progress to close the financing gap can be achieved through increased domestic resources, aligned complementary financing, crowding in private financing and reducing inefficiencies, to mobilise an additional US$50–75 billion. By frontloading greater resources and strengthening health systems to increase coverage of essential life-saving RMNCAH-N interventions, the potential of GFF is to avert between 11.9 and 34.7 million deaths by 2030. The reported impact in these analyses can only be realised through the combined contributions of the GFF model and broad partnership, with governments in the lead, coordinating with local and international private sector and development partners in health and nutrition.
Acknowledgments
The authors thank Ties Boerma, Mickey Chopra, and Toby Kasper for reviewing and providing strategic guidance and input during the development of the analysis framework. They also thank Sneha Kanneganti for her review and valuable comments for the manuscript.
Handling editor: Seye Abimbola
Contributors: KRB and MEBC conceptualised the study. The resource modelling was done by OBH, CVD and TC. The Lives Saved Tool analysis was done by VBC, AS and NW. RS and JS analysed the costing outputs. KRB, MEBC, DGW and SM contributed to inputs and assumptions for the modelling as well as interpretation of the data. All authors contributed to drafting the manuscript and all authors reviewed and approved the final version before submission.
Funding: This work was supported by the Global Financing Facility.
Competing interests: MEBC and KRB are employees of the Global Financing Facility, and DGW and SM work for the Bill & Melinda Gates Foundation, an investor in the GFF.
Patient consent: Not required.
Provenance and peer review: Not commissioned; externally peer reviewed.
Data sharing statement: No additional data are available.
www.globalfinancingfacility.org
Afghanistan, Bangladesh, Cambodia, Cameroon, Central Africa Republic, Cote, D’Ivoire, Congo, Democratic Republic of, Ethiopia, Guatemala, Guinea, Haiti, Indonesia, Kenya, Liberia, Madagascar, Malawi, Mali, Mozambique, Myanmar, Nigeria, Rwanda, Senegal, Sierra Leone, Tanzania, Uganda, Vietnam; the additional 23 countries have not yet been selected.
The Liberian IC focused on 6 priorities: providing emergency obstetric and new born care, ii) strengthening civilregistration and vital statistics (CRVS) systems, iii) improving adolescent health interventions, iv) establishingemergency preparedness surveillance and response, v) promoting sustainable community engagement and vi)reinforcing RMNCAH leadership, governance and management.
Mozambique: Incentives are provided to ensure that the percentage of total domestic health expenditure out ofthe total domestic government expenditure is at least 8.5% in the first years of the program, in later yearsincentives are provided if the share is increased. Kenya: Through the IDA/GFF co-financed project, countygovernments are encouraged to allocate at least 20% of their budget to health on an increasing scale. Through theproject, each county receives an annual allocation based on improved performance on a composite of keyRMNCAH-N indicators. One of the eligibility criteria is that the county allocates at least 20% of budget tohealth. Guatemala (buy-down): The GFF resources buy-down interest payment of an IBRD loan. The governmentof Guatemala has committed to using the resources that are freed up from debt payments and matching themwith domestic resources towards financing the conditional cash transfer (CCT) program.
More information on GFF’s country level private sector work is available here: https://www.globalfinancingfacility.org/sites/gff_new/files/images/GFF-IG7-6-Private-Sector-Update.pdf.
600 million USD presently contributed by the Governments of Canada, Denmark, Norway and the United Kingdom, the Bill & Melinda Gates Foundation, and MSD for Mothers. The GFF is currently in replenishment for 2 billion additional dollars.
References
- 1. United Nations The millennium development goals report. New York: United Nations, 2015. [Google Scholar]
- 2. Claeson M. The global financing facility-towards a new way of financing for development. Lancet 2017;389:1588–92. 10.1016/S0140-6736(17)31000-0 [DOI] [PubMed] [Google Scholar]
- 3. Global Financing Facility Annual report: the global financing facility: the world bank group. 2018, 2017-2018. [Google Scholar]
- 4. Bollinger LA, Sanders R, Winfrey W, et al. Lives Saved Tool (LiST) costing: a module to examine costs and prioritize interventions. BMC Public Health 2017;17(Suppl 4):782 10.1186/s12889-017-4738-1 [DOI] [PMC free article] [PubMed] [Google Scholar]
- 5. Stenberg K, Hanssen O, Edejer TT, et al. Financing transformative health systems towards achievement of the health sustainable development goals: a model for projected resource needs in 67 low-income and middle-income countries. Lancet Glob Health 2017;5:e875–e887. 10.1016/S2214-109X(17)30263-2 [DOI] [PMC free article] [PubMed] [Google Scholar]
- 6. Walker N, Tam Y, Friberg IK. Overview of the Lives Saved Tool (LiST). BMC Public Health 2013;13 Suppl 3(Suppl 3):S1 10.1186/1471-2458-13-S3-S1 [DOI] [PMC free article] [PubMed] [Google Scholar]
- 7. Bhutta ZA, Das JK, Bahl R, et al. Can available interventions end preventable deaths in mothers, newborn babies, and stillbirths, and at what cost? Lancet 2014;384:347–70. 10.1016/S0140-6736(14)60792-3 [DOI] [PubMed] [Google Scholar]
- 8. Black RE, Levin C, Walker N, et al. Reproductive, maternal, newborn, and child health: key messages from Disease Control Priorities 3rd Edition. Lancet 2016;388:2811–24. 10.1016/S0140-6736(16)00738-8 [DOI] [PubMed] [Google Scholar]
- 9. Bhutta ZA, Das JK, Walker N, et al. Interventions to address deaths from childhood pneumonia and diarrhoea equitably: what works and at what cost? Lancet 2013;381:1417–29. 10.1016/S0140-6736(13)60648-0 [DOI] [PubMed] [Google Scholar]
- 10. Kanyuka M, Ndawala J, Mleme T, et al. Malawi and millennium development goal 4: a countdown to 2015 country case study. Lancet Glob Health 2016;4:e201–14. 10.1016/S2214-109X(15)00294-6 [DOI] [PubMed] [Google Scholar]
- 11. Stenberg K, Axelson H, Sheehan P, et al. Advancing social and economic development by investing in women's and children's health: a new global investment framework. Lancet 2014;383:1333–54. 10.1016/S0140-6736(13)62231-X [DOI] [PubMed] [Google Scholar]
- 12. Stover J, Brown T, Puckett R, et al. Updates to the spectrum/estimations and projections package model for estimating trends and current values for key HIV indicators. AIDS 2017;31(Suppl 1):S5–11. 10.1097/QAD.0000000000001322 [DOI] [PubMed] [Google Scholar]
- 13. Gkountouras G, Lauer JA, Stanciole A. Estimation of unit costs for general health services: Updated WHO-CHOICE estimates. Geneva, Switzerland: World Health Organization, 2011. [Google Scholar]
- 14. Clift J, Arias D, Chaitkin M. Landscape study of the cost, impact, and efficiency of above service delivery activities in hiv and other global health programs. Washington, DC: Results for Development Institute, 2016. [Google Scholar]
- 15. Fan VY, Savedoff WD. The health financing transition: a conceptual framework and empirical evidence. Soc Sci Med 2014;105:112–21. 10.1016/j.socscimed.2014.01.014 [DOI] [PubMed] [Google Scholar]
- 16. Global Burden of Disease Health Financing Collaborator Network Evolution and patterns of global health financing 1995-2014: development assistance for health, and government, prepaid private, and out-of-pocket health spending in 184 countries. Lancet 2017;389:1981–2004. 10.1016/S0140-6736(17)30874-7 [DOI] [PMC free article] [PubMed] [Google Scholar]
- 17. Vargas V, Begum T, Ahmed S. Fiscal space for health in Bangladesh, 2016. [Google Scholar]
- 18. Gouali D, Djédjé H, Guébo A. Étude sur l’espace budgétaire et l’efficience dans les dépenses publiques de santé en Côte d’Ivoire. Abijan: OMS (Bureau de la Représentation en Côte d’Ivoire), 2017. [Google Scholar]
- 19. World Bank Fiscal space for health in Malawi and revenue potential of innovative financing. Washington, D.C: World Bank Group, 2017. [Google Scholar]
- 20. Boerma T, Victora C, Abouzahr C. Monitoring country progress and achievements by making global predictions: is the tail wagging the dog? Lancet 2018;392:607–9. 10.1016/S0140-6736(18)30586-5 [DOI] [PubMed] [Google Scholar]
- 21. McCoy D, Jensen N, Kranzer K, et al. Methodological and policy limitations of quantifying the saving of lives: a case study of the global fund's approach. PLoS Med 2013;10:e1001522 10.1371/journal.pmed.1001522 [DOI] [PMC free article] [PubMed] [Google Scholar]
- 22. Bhutta ZA, Das JK, Rizvi A, et al. Evidence-based interventions for improvement of maternal and child nutrition: what can be done and at what cost? Lancet 2013;382:452–77. 10.1016/S0140-6736(13)60996-4 [DOI] [PubMed] [Google Scholar]