
Figure 5.
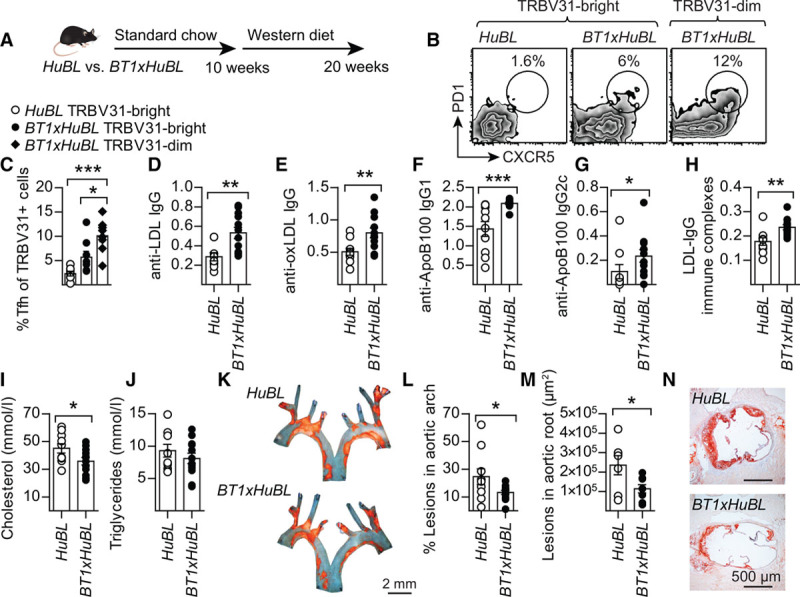
Induction of anti-LDL antibodies and protection against atherosclerosis in the BT1xHuBL cross. A, Design of diet experiment with compound mutant mice. B, Representative flow cytometry plots of Tfh cell staining in the TRBV31bright and TRBV31dim populations. C, PD1+CXCR5+ Tfh cells in the CD44+CD62L−TRBV31+ Th population (HuBL n=7, BT1xHuBL n=8; 1-way ANOVA with Bonferroni’s posttest). D, Plasma anti-LDL IgG (HuBL n=9, BT1xHuBL n=12; 1:15 dilution, Student’s t test). D–H, Optical density at 450 nm is shown on the y axis. E, Anti-oxLDL IgG (HuBL n=10, BT1xHuBL n=12; 1:15 dilution, Student’s t test). F and G, Anti-ApoB100 IgG1 and IgG2c (HuBL n=10, BT1xHuBL n=12; 1:15 dilution, Mann-Whitney test). H, Circulating immune complexes with LDL and anti-LDL IgG (HuBL n=10, BT1xHuBL n=12; 1:100 dilution, Student’s t test). I and J, Plasma cholesterol and triglycerides at 20 weeks of age (HuBL n=10, BT1xHuBL n=12; Student’s t test). K, En face preparations of aortic arches with lipid-laden plaques stained with Sudan IV (orange). L, Atherosclerotic burden in aortic arch (HuBL n=10, BT1xHuBL n=12; Student’s t test). M, Mean lesion area in the aortic root (HuBL n=7, BT1xHuBL n=8; Student’s t test). N, Micrographs show Oil Red O staining of neutral lipids (red) in cross-sections of the aortic root. Dots represent individual mice, bars show mean±SEM; *P≤0.05, **P≤0.01, ***P≤0.001. See also Figures V and VI in the online-only Data Supplement. IgG indicates immunoglobulin G; and LDL, low-density lipoprotein.