. 2018 Nov 26;7:e43326. doi: 10.7554/eLife.43326

Figure 5. Sleep promotes endocytosis at the surface glia.

Brains (n = 20, per condition in experiment) from 9-137 GAL4, UAS-CD8::GFP flies were dissected, dissociated, and the samples incubated with Alexa647-conjugated 10kd dextran in the presence or absence of the dynamin inhibitor, dynasore hydrate. Endocytosis measured from surface glial cells by AF647-Dextran signal, expressed as normalized median fluorescence intensity (MFI) (left) and percentage of cells with high endocytosis signal (right). Dextran MFI is normalized to the average MFI of the DH-treated samples. Paired Student’s T-test with *p<0.05 and **p<0.01. Percentage of GFP+ cells displaying high signal with vehicle conditions was normalized to inhibitor for each respective timepoint to compare between experiments. One-way ANOVA with correlated measures with post-hoc Tukey’s test with *p<0.05 and **p<0.01. (A) Endocytosis at ZT2, ZT2 following sleep deprivation (12 hr, mechanical stimulation) and ZT14 (n = 4 per time point, pooled from four experiments). (B) Endocytosis at night time points ZT14, ZT18, and ZT22 along with ZT2 (n = 4, pooled from four experiments). (C) Endocytosis at ZT2 after feeding of 0.1 mg/mL Gaboxadol or vehicle (n = 3, pooled from two experiments).

Figure 5.

Figure 5—figure supplement 1. Blood-brain barrier restricts passage of 3kD dextran into the brain.

Figure 5—figure supplement 1.

Live dissected brains were incubated with 3kD FITC-conjugated dextran for up to 10 mins (A) or (B) washed off after 5 min of incubation. (A) shows representative images of brains 3, 5, and 10 min following start of incubation. (B) After wash off, no fluorescence of dextran above background was seen. (C) Live dissected brains were incubated with Rhodamine B. Brains were imaged continuously by confocal microscopy. Representative images are shown of 3, 5, and/or 10 min following start of incubation.
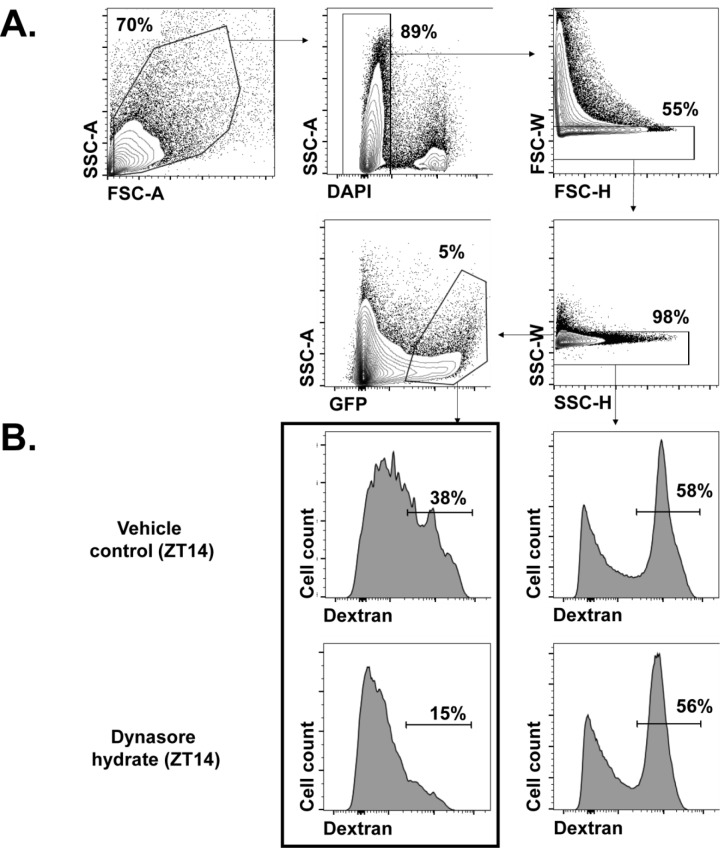
Figure 5—figure supplement 2. Analysis of endocytosis using flow cytometry.

Figure 5—figure supplement 2.

(A) Gating strategy for FACS analysis. Events were gated on cell size, live cells, and forward scatter (FSC) and side scatter (SSC) singlets. GFP+ gates were determined with a GFP- sample. (B) Endocytosis of Drosophila BBB cells. Total dissociated brain cells from 9-137-GAL4 > UASCD8 GFP flies were treated with vehicle or dynasore hydrate and analyzed by flow cytometry. Gates for dextran-high cells were determined using the bimodal distribution of dextran in live singlets (right panels) and applied to GFP+ BBB cells (left panels). Mean fluorescent intensity (MFI) and percentages used for the analysis of endocytosis were derived from outlined panels. All primary data analyses were performed using FlowJo software.
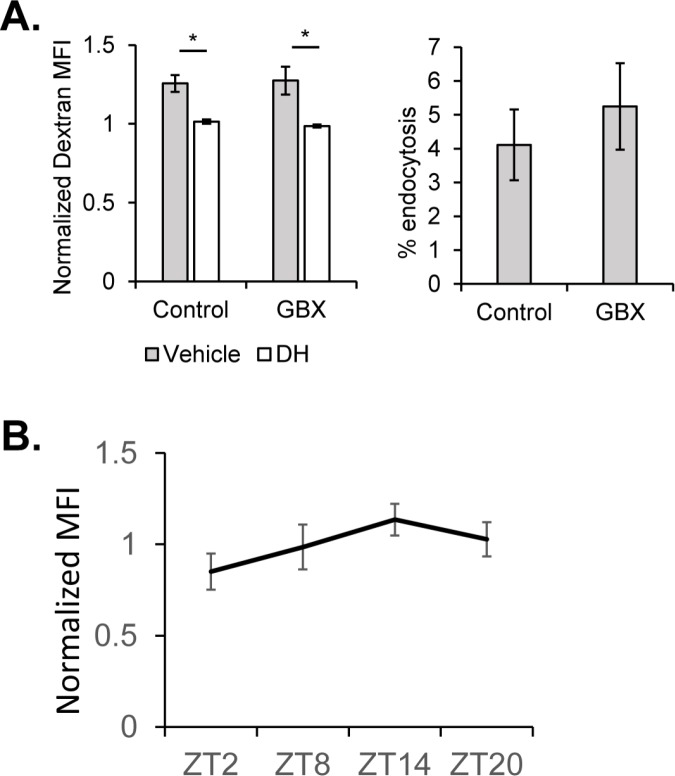
Figure 5—figure supplement 3. Endocytosis at the BBB across circadian timepoints and upon Gaboxadol feeding at night (ZT14).

Figure 5—figure supplement 3.

(A) Endocytosis measured from surface glial cells by AF647-Dextran signal at ZT14 after feeding of 0.1 mg/mL Gaboxadol or control (n = 3, pooled from two experiments). Expressed as normalized median fluorescence intensity (MFI) (left) and percentage of cells with high endocytosis signal (right). Dextran MFI is normalized to the average MFI of the DH-treated samples. Paired Student’s T-test with *p<0.05 and **p<0.01. Percentage of GFP+ cells displaying high signal with vehicle conditions normalized to inhibitor for each respective timepoint to compare between experiments. One-way ANOVA with correlated measures with post-hoc Tukey’s test with *p<0.05 and **p<0.01. (B) Mean endocytosis amount represented by normalized median fluorescence intensity (normalized to average MFI per experiment, as inhibitor was not used in these experiments) for ZT2, ZT8, ZT14 and ZT20 (n = 5 experiments). Not significant by JTK_CYCLE (p=0.13).
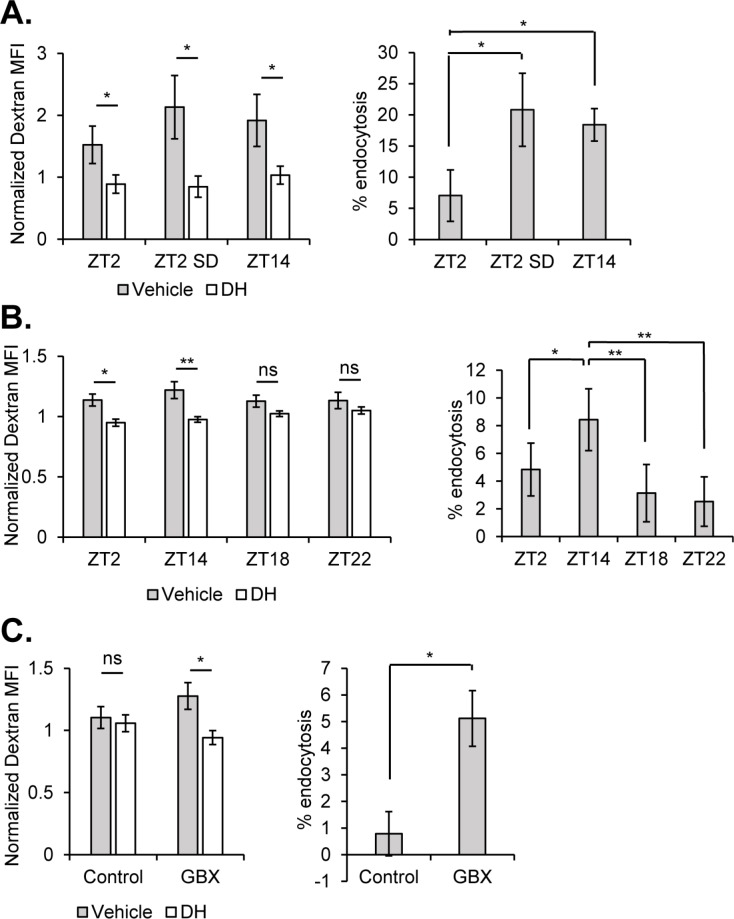
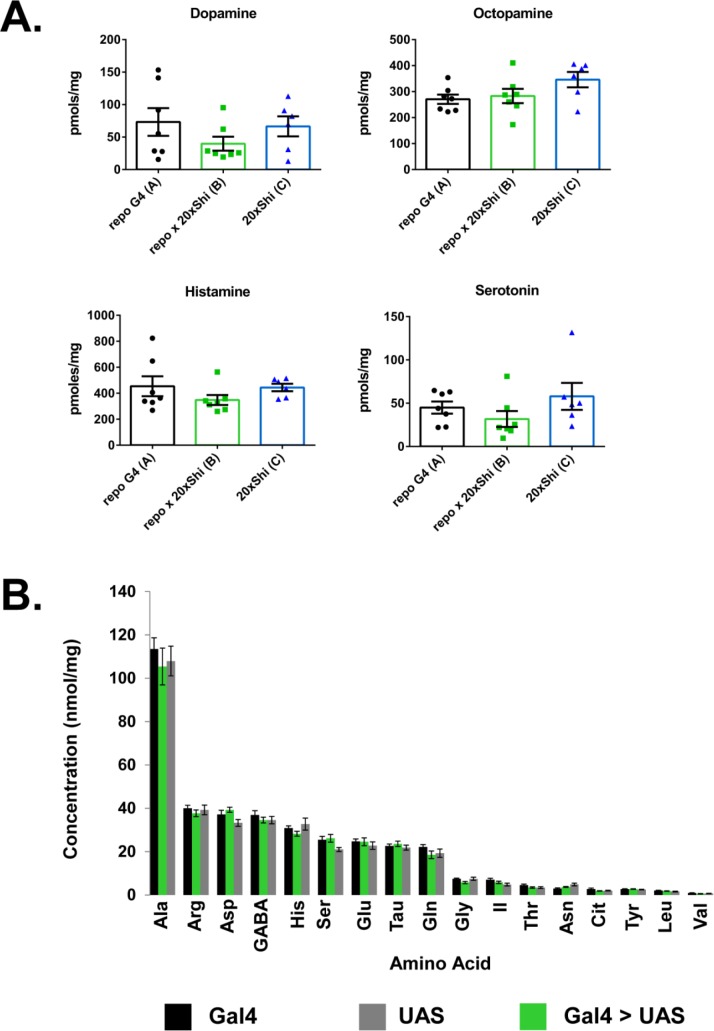
Figure 5—figure supplement 4. Whole-brain biogenic amines and amino acids are unaltered in Repo > Shi flies.

Figure 5—figure supplement 4.

(A) Dopamine, octopamine, histamine and serotonin measured by LC-MS. n = 20 brains per sample, seven replicates. (B) Amino acids measured by HPLC. n = 20 brains per sample, six replicates.