

Abstract
Background: Responses to endocrine therapies vary among patients with estrogen receptor (ER+) breast cancer. We studied whether in utero exposure to endocrine-disrupting compounds might explain these variations.
Methods: We describe a novel ER+ breast cancer model to study de novo and acquired tamoxifen (TAM) resistance. Pregnant Sprague Dawley rats were exposed to 0 or 0.1 ppm ethinyl estradiol (EE2), and the response of 9,12-dimethylbenz[a]anthracene (DMBA)-induced mammary tumors to 15 mg/kg TAM, with (n = 17 tumors in the controls and n = 20 tumors in EE2 offspring) or without 1.2 g/kg valproic acid and 5 mg/kg hydralazine (n = 24 tumors in the controls and n = 32 tumors in EE2 offspring) in the female offspring, was assessed. One-sided Chi2 tests were used to calculate P values. Comparisons of differentially expressed genes between mammary tumors in in utero EE2-exposed and control rats, and between anti-estrogen-resistant LCC9 and -sensitive LCC1 human breast cancer cells, were also performed.
Results: In our preclinical model, 54.2% of mammary tumors in the control rats exhibited a complete response to TAM, of which 23.1% acquired resistance with continued anti-estrogen treatment and recurred. Mammary tumors in the EE2 offspring were statistically significantly less likely to respond to TAM (P = .047) and recur (P = .007). In the EE2 offspring, but not in controls, adding valproic acid and hydralazine to TAM prevented recurrence (P < .001). Three downregulated and hypermethylated genes (KLF4, LGALS3, MICB) and one upregulated gene (ETV4) were identified in EE2 tumors and LCC9 breast cancer cells, and valproic acid and hydralazine normalized the altered expression of all four genes.
Conclusions: Resistance to TAM may be preprogrammed by in utero exposure to high estrogen levels and mediated through reversible epigenetic alterations in genes associated with epithelial-mesenchymal transition and tumor immune responses.
Emerging evidence suggests that elevated estrogenicity in utero, induced, for example, by a maternal exposure to a synthetic estrogen diethylstilbestrol (DES) or high-fat diet, increases later breast cancer risk in women (1,2) and in animal models (3,4). This effect may not be limited to first-generation offspring because dietary exposure to a synthetic estradiol (ethinyl estradiol [EE2]) during pregnancy increased mammary cancer risk in daughters, granddaughters, and great granddaughters in a rodent breast cancer model (5). Increased transgenerational mammary cancer risk was accompanied by persistent changes in the DNA methylation patterns of the normal mammary glands (5). Others reported that in utero exposure to synthetic estrogens increased expression of the polycomb gene EZH2 (6). Thus, an elevated estrogenic environment during pregnancy induces epigenetic changes in the offspring’s mammary glands that persist across several subsequent generations.
Epigenetic changes play an important role in determining the clonal landscape of primary tumors, affect how tumors respond to treatment, and define their metastatic potential (7). They might also contribute to pre-existing differences in transcription factor expression in estrogen receptor–positive (ER + ) breast tumors that predict the risk of recurrence (8). How or why these patterns emerge remains largely unknown. Some may already have been present in the normal breast (9), perhaps programmed by substantial presence of estrogenic compounds (10,11) in the in utero environment (5). In an earlier study, high in utero estrogenicity induced recurrence of ER + mammary tumors in an animal model (12). In humans, women who had high birth weight, and thus were exposed to an elevated estrogenic environment in utero (13), are at increased risk to develop breast cancer (14) and experience an increased breast cancer mortality (15).
In support of the importance of epigenetic changes in affecting response to cancer therapies, findings in breast cancer cells in vitro indicate that histone deacetylase (HDAC) inhibitors (MHY218, SAHA, valproic acid) and DNA methyltransferase (DNMT) inhibitor 5-aza-2’deoxycytidine (5-Aza) can reverse tamoxifen (TAM) resistance (16–18). Munster et al. showed clinical benefit for breast cancer patients who had endocrine-resistant metastatic disease when subsequently treated with a combination of TAM and the HDAC inhibitor vorinostat (19). Combined treatment with valproic acid and the DNMT inhibitor hydralazine is more effective in improving clinical efficacy of radiation and chemotherapy in some solid tumors, including breast cancer, than is either drug alone (20–22).
We studied here if maternal exposure to EE2 during pregnancy affects both the response of female offspring’s primary mammary tumors to TAM and tumors’ subsequent recurrence patterns, and if the effects can be reversed by HDAC and DNMT inhibitors. We used valproic acid and hydralazine because these are taken chronically by humans suffering from migraines, epilepsy, or hypertension and are better tolerated than more specific HDAC and DNMT inhibitors. A modified preclinical model was used to generate ER+ mammary tumors, where rats were treated with the carcinogen 9,12-dimethylbenz[a]anthracene (DMBA). This widely validated animal model supported the preclinical development of TAM (23,24).
Methods
In Utero Ethinyl Estradiol (EE2) Exposure
Pregnant Sprague-Dawley dams were fed an AIN93G control diet containing either 0 or 0.1 ppm ethinyl estradiol (EE2) between gestation days 10 and 19. Subsequently, all dams and offspring were fed control diet. All animal procedures were approved by the Georgetown University Animal Care and Use Committee. Experiments were performed following the National Institutes of Health guidelines for the proper and humane use of animals in biomedical research.
Mammary Tumorigenesis and Drug Treatments
Mammary tumors were induced in the female offspring on postnatal day 50 by oral gavage of 10 mg of DMBA (Sigma). Treatments were started when rats had palpable mammary tumors 11–15 mm in diameter. The study had three treatment arms: 1) 338 ppm tamoxifen citrate (TAM, first-line treatment, administered via diet, resulting in approximately 15 mg/kg body weight daily tamoxifen dose; C: n = 24 tumors; EE2: n = 32 tumors); 2) 1.2 g/kg daily valproic acid (Sigma) (HDAC inhibitor [25]) and 5 mg/kg daily hydralazine (Sigma) (DNMT inhibitor [26], administered via drinking water; C: n = 59 tumors; EE2: n = 48 tumors); and 3) TAM, followed by valproic acid and hydralazine as a second-line treatment using rats that had de novo TAM-resistant or partially TAM-responding tumors (control: n = 17 tumors; EE2: n = 20 tumors).
Response of Tumors to Adult Drug Treatments
Based on their response to TAM, tumors were divided into four categories: those exhibiting 1) complete response (CR; tumor disappeared), 2) partial response (PR; tumor stopped growing and/or started to shrink), 3) de novo resistance (tumor continued growing), and 4) acquired resistance (tumors that exhibited CR lasting more than four weeks and then recurred at the same location where they were observed initially, reaching a size of 13 mm in diameter).
RNA Target Preparation/Affymetrix Microarray Analysis
In addition to comparing differences in gene expression in adenocarcinomas between control (n = 4) and EE2 (n = 4) offspring prior to TAM treatment, we compared the differentially expressed genes (DEGs) between isogenic human breast cancer cell lines that either respond to anti-estrogens (LCC1/MCF-7, n = 3) or exhibit anti-estrogen resistance (LCC9/MCF-7, n = 3) (27). Detailed description of these methods is provided in Supplementary Methods (available online).
Among the 48 DEGs, 27 were upregulated and 21 were downregulated in both the EE2 rat mammary tumors and LCC9 human breast cancer cells (Supplementary Table 1, available online). We used two separate approaches to identify transcription factors that are potentially linked to anti-estrogen resistance. First, to characterize the functional roles of the DEGs, the networks hosted by these genes were constructed using differential dependency network (DDN) analysis (28,29). DDN identifies differential connections among transcription factors that exist only in the LCC9/in utero EE2 grouping or only in the LCC1/control grouping. Second, all DEGs were initially assessed for predicting survival in three different Gene Expression Omnibus (GEO) datasets using only tumors obtained from ER+ breast cancer patients that were subsequently treated with TAM, ie, GSE2990, GSE6532, GSE12093 (30–34). We chose those transcription factors that were predictive of survival for the validation studies.
Confirmation of Changes in Gene and Protein Expression and Effect of Valproic Acid and Hydralazine
Methods are described in the Supplementary Methods and Supplementary Table 2 (available online).
Methylation Assays
Methods are described in the Supplementary Methods (available online).
Effect of Valproic Acid and Hydralazine on TAM Resistance in LCC9 Cells
Methods are described in the Supplementary Methods (available online).
Silencing of ETV4 in LCC9, and KLF4, LGALS3 and MICB in LCC1 Cells with siRNA
Methods are described in the Supplementary Methods (available online).
Neoadjuvant Study
Methods are described in the Supplementary Methods (available online).
Statistical Analyses
Responses of mammary tumors to TAM, with or without valproic acid and hydralazine, were analyzed using a one-sided Chi2 test. Two-sided two-way analysis of variance (ANOVA), followed by a two-sided Tukey test, was used to assess differences in 1) mRNA expression between LCC1 and LCC9 cells treated with vehicle, TAM, valproic acid, and hydralazine or TAM, valproic acid, and hydralazine; 2) cell proliferation in LCC1 or LCC9 cells using siRNAs to inhibit ETV4, KLF4, LGALS3, and MICB; and 3) mRNA expression between nonresponders and responders at biopsies obtained at three different time points in neo-adjuvant study. Two-sided one-way ANOVA and the Tukey test were used to determine sensitivity of LCC9 cells to TAM, valproic acid, and hydralazine vs TAM only. A two-sided Student’s t test was used to determine differences in the length of TAM treatment, latency to recurrence, and CpG site methylation levels. All analyses were performed using SigmaPlot 11. A P value of less than .05 was considered statistically significant.
Results
Effect of TAM Therapy on Mammary Tumors in Control and In Utero EE2-Exposed Rats
Control rats were treated with TAM for 19.5 weeks (range = 3–31 weeks). Of these rats, 54.2% exhibited a complete response (CR), 8.3% a partial response (PR), and 37.5% were de novo resistant (Figure 1A). Twenty-three point one percent of initial CR tumors recurred (Figure 1B). Mean latency to recurrence was 14.7 weeks (range = 8–23 weeks).
Figure 1.

Response of mammary tumors to tamoxifen. A) 9,12-dimethylbenz[a]anthracene (DMBA)-induced mammary tumor growth in rats that were exposed to 0.1 ppm EE2 or vehicle control in utero. Rats either received no treatment during tumor monitoring, or when a tumor reached a size of 13 mm in diameter they received 15 mg/kg/day TAM in diet, or 1.2 g/kg/day valproic acid and 5 mg/kg/day hydralazine in drinking water.P values indicate statistically significant differences between the C and EE2 groups; one-sided Chi2-test. NS = not statistically significant. The number of tumors studied in each group varied from 24 to 59. B) Effect of adding VA+H as a second line of treatment on the development of new de novo and acquired TAM-resistant tumors in the control and in utero EE2-exposed rats is shown. P values indicate statistically significant differences between the C and EE2 groups; one-sided Chi2-test. The number of tumors was 17 in the control group and 20 in the EE2 group. C) Panel shows the expression of ERα protein, assessed by western blot, in the DMBA-induced mammary adenocarcinomas of control and in utero EE2-exposed rats that either did not receive any treatment during tumor monitoring or received TAM or TAM and VA+H. The number of tumors studied in each group was three to four. Means (SDs) are shown. C = control; EE2 = ethinyl estradiol; ER = estrogen receptor; H = hydralazine; NS = not statistically significant; TAM = tamoxifen; VA = valproic acid.
In the in utero EE2-exposed group, only 37.5% of the tumors treated with TAM exhibited CR and 53.1% were de novo resistant. Thus, the EE2 rats exhibit statistically significantly more de novo resistant mammary tumors than the controls (Chi2 test, P = .047) (Figure 1A). The local recurrence rate of CR tumors in the rats exposed to EE2 in utero was almost twice that seen in the controls (41.7% of CR, Chi2 test, P = .007) (Figure 1B). The average length of TAM treatment was significantly shorter in the EE2 group (11.8 weeks, range = 2–19 weeks), but the latency to recurrence was not (10.8 weeks, range = 5–17 weeks). Reflecting the higher number of de novo resistant tumors in the EE2 group, the average length of TAM treatment was statistically significantly shorter in these rats (12.8 ± 1.6 weeks) than in the control group (t test, P = .043). In the absence of TAM treatment, mammary tumors in both control (n = 50 tumors) and in utero EE2-exposed rats (n = 46 tumors) grew and very few regressed spontaneously (Figure 1A). Thus, rats exposed to EE2 in utero were more likely than control rats to develop both de novo and acquired TAM-resistant mammary tumors.
Effect of Valproic Acid and Hydralazine on TAM Resistance in Rat Tumors
The effect of valproic acid and hydralazine on mammary tumor growth was then assessed in a group of control and EE2 rats: Neither group was responsive (Figure 1A). Consistent with the known safety profiles of these drugs, no toxicity was observed (Supplementary Table 3, available online). We next assessed whether valproic acid and hydralazine improve response to TAM when added as a second-line treatment. In the in utero EE2 group, but not in controls, valproic acid and hydralazine reduced the development of de novo or acquired TAM-resistant tumors (Figure 1B). In the controls, the rate of new de novo TAM/valproic acid/hydralazine-resistant tumors (appeared after treatment started) was 17.6% vs 25.4% with TAM only. In the EE2 rats, the rate of de novo resistant tumors fell to 15.0% vs 37.9% in the TAM-only group (Chi2 test, P < .001) (Figure 1B). Furthermore, in the EE2 group, no tumors that responded to TAM-only treatment acquired resistance during TAM/valproic acid/hydralazine treatment (Figure 1B). The mammary tumor recurrence rate was not altered in the control group by adding valproic acid and hydralazine to TAM treatment (Figure 1B). Thus, valproic acid and hydralazine reduced the development of de novo and acquired TAM resistance only in the rats exposed to EE2 in utero.
Mammary tumors in both the control and EE2 groups were ERα positive whether they were treated or not with TAM (Figure 1C). Mammary tumor histology also was similar in the two groups (Supplementary Table 4, available online). Thus, changes in neither ER status nor tumor histotype explained anti-estrogen responsiveness.
Common Gene Regulation in In Utero EE2-Exposed Rat Tumors and Human Anti-Estrogen-Resistant LCC9 Breast Cancer Cells
Because mammary tumors in the EE2 group exhibited a higher rate of TAM resistance than tumors in the control rats, we studied whether the gene expression patterns of the EE2 tumors prior to any treatment broadly resemble those seen in TAM-resistant human LCC9 breast cancer cells (acquired resistance model, no treatment). The 48 DEGs are shown in Figure 2A, listed in Supplementary Tables 1, 5, and 6, available online). Differential connections among transcription factors, which exist only in the LCC9/in utero EE2 grouping or only in the LCC1/control grouping (identified using DDN analysis), are illustrated in Figure 2B. Six upregulated and six downregulated genes (nodes) with differential connections (edges) were identified in LCC9 vs LCC1 cells. Functions of these genes are provided in Table 1. Nodes in LCC9 cells/mammary tumors from in utero EE2-exposed rats are connected to genes that result in anti-estrogen resistance, increased cancer cell proliferation and survival, inhibition of apoptosis, and altered mitochondrial respiration and immune functions.
Figure 2.

Differences in gene signaling in mammary tumors between control and in utero EE2–exposed rats. A) Heat map showing differences in the expression of the 48 genes in common between the LCC1 (n = 3) vs LCC9 cells (n = 3) and between mammary tumors in the control (n = 4) vs EE2 (n = 4)-exposed offspring. Genes associated with poor response to tamoxifen in at least one of three GEO datasets (Zhang et al. [GSE12093] ], Sotiriou et al. [GSE2990] ], and Loi et al. [GSE6532] [32–34]) and with differential expression verified by quantitative polymerase chain reaction are listed at the side of the heat maps. B) Results of differential dependency network analysis to identify unique connections among differentially expressed genes in LCC9 cells/tumors in EE2 rats vs in LCC1 cells/mammary tumors in control rats. Connections shown in green exist only in LCC9 cells/mammary tumors in EE2 rats, while connections shown in red exist only in LCC1 cells/tumors in control rats. Circles in orange indicate upregulation of gene expression, and circles in blue indicate downregulation in LCC9 cells/mammary tumors in EE2 rats. Nodes are circled in orange. DDN = differential dependency network; EE2 = ethinyl estradiol.
Table 1.
Upregulated and downregulated genes in anti-estrogen-resistant LCC9 breast cancer cells and EE2 rat mammary tumors and their unique signaling connections, identified in DDN analysis, compared with anti-estrogen sensitive LCC1 cells
| Upregulated gene (function) | Connections in LCC9 | Consequence | Connections in LCC1 | Consequence |
|---|---|---|---|---|
| CYP2R1 | ARRDC3† | Reduced tumor suppressor activity via activation of ITGB4 (3) | ETV4† | Reduced EMT (4,5), improved TAM response (6) |
| VD3 metabolism, immunosuppression (1,2)‡ | ||||
| DNAJC12† | Reduced ER activation (7), reduced endoplasmic reticulum stress (8), improved cancer survival (9), improved TAM response (6) | |||
| GGT1 | HOXB3* | Increased cancer risk (11), increased cell proliferation (12), increased methylation through DNMT3b (13) | ETV4† | Reduced EMT (4,5), improved TAM response (6) |
| Activation of oxidative stress pathway, link to metabolic disorders (10) | ||||
| RET | Increased anti-estrogen resistance (14,15) | |||
| ZBTB24 | DNA methylation and immunodeficiency (16) | |||
| HOXB3 | ARRDC3† | Reduced tumor suppressor activity in breast cancer via activation of ITGB4 (3) | CAST* | Suppresses pro-inflammation by reducing NFkB, IL-6, and IL-17 activity (17) |
| Cancer cell proliferation (12), increased methylation (13) | ||||
| GGT1† | Increased inflammation and oxidative stress, metabolic disorders (10) | |||
| SLC2A10† | Impaired mitochondrial respiration (18) and increased TGFβ signaling (19) | |||
| XPNPEP3† | Reduced mitochondrial stress resistance and increased ROS production (20) | |||
| HSPA4 | CRAMP1L† | Polycomb activation and reduced H1 expression (23) | ANXA2* | Induction of EMT (24) or inhibition of metastasis (25) |
| Cancer cell survival (21), chemoresistance (22) | ||||
| PTPN13* | Reduced cell adhesion (26), inhibition of T-cell differentiation (27), oncogenic or tumor suppressor activity (28) | KLF4* | Tumor suppressor activity via reduced EMT (29,30) | |
| RASGEF1A | TRIM47† | Dysregulation of innate immune response (33,34) | TNIP2* | Inhibition of NFkB activation (35) |
| Activation of c-myc (31), increased cancer cell proliferation (32) | ||||
| RET | GGT1* | Increased inflammation and oxidative stress, metabolic disorders (10) | PDE8A* | Increased chemokine expression/T-cell activation (36), inhibition of steroidogenesis (37) |
| Increased anti-estrogen resistance (14,15) | ||||
| WASF1* | Impaired T-cell activation (38), inhibition of apoptosis, increased tumor aggressiveness, and multidrug resistance (39–41) | |||
|
Downregulated gene (function) |
Connections in LCC9 |
Consequence |
Connections in LCC1* |
Consequence |
| ARRDC3 | CYP2R1* | Increased VD3 metabolism (1), immunosuppression via activation of regulatory T-cells (2) | SYNGR1† | Reduced risk of cancer recurrence (42) and increased auto-immunity (43) |
| Tumor suppressor (3) | ||||
| HOXB3 | Increased cancer risk (11) through increased cell proliferation (12), increased methylation through DNMT3b (13) | |||
| FAM5C (BRINP3) | PTPN18† | Increased HER2 signaling (47) | ETV4† | Reduced EMT (4,5) |
| Inflammation (44), tumor suppressor (45,46) | ||||
| LGALS3 | PTPN13* | Reduced cell adhesion (26), inhibition of T-cell differentiation (27) | TTPAL† | Reduced oncogene action (11), target of BMI1 (regulates stem cell renewal) (51) |
| Control of EMT (48), cancer survival (49), T-cell activity (50) | ||||
| LY6E | UGT1A6† | Reduced detoxification of carcinogens, xenobiotics, and estrogens (53,54) | CRAMP1L* | Polycomb silencing, histone H1 expression (23) |
| Immune cell recognition (52) | ||||
| MBP | GTPBP8* | Not known | CAST* | Suppresses pro-inflammation by reducing NFkB, IL-6, and IL-17 activity (17) |
| Antitumor immune activity (55) | ||||
| HSPB8* | Increased anti-estrogen resistance, inhibition of autophagy-induced apoptosis (56) | SLC2A10* | Facilitation of mitochondrial respiration (18) and decrease in TGFβ signaling (19) | |
| XPNPEP3* | Reduced mitochondrial stress resistance and increased ROS production (20) | |||
| TRIM47 | RASGEF1A* | Activation of cMyc (31), increase cancer cell proliferation (32) | GTPBP8† | Not known |
| Regulation of innate immune responses (33,34) |
Upregulated genes.
†Downregulated genes.
‡References provided in the Supplementary Material (available online).
DDN = differential dependency network; EE2 = ethinyl estradiol; EMT = epithelial-mesenchymal transition; ER = estrogen receptor; HER2 = human epidermal growth factor receptor 2; IL = interleukine; ITGB4 = integrin subunit beta4; ROS = reactive oxygen species TAM = tamoxifen TGFbeta = transforming growth factor beta.
To identify genes among the DEGs that may be causally linked to anti-estrogen resistance, we selected those that were predictive of survival among ER+ breast cancer patients treated with TAM (see “Methods”). These were the upregulated genes ETV4, HOXB3, MAST3, and WASF1 and the downregulated genes ARGHEF4, KLF4, LGALS3, and MICB. Expression of the eight genes was determined by performing quantitative polymerase chain reaction (qPCR) analysis of mRNA from an independent set of the LCC1 and LCC9 cells. Differential mRNA expression of all but the ARGHEF4 gene was confirmed.
Effect of Valproic Acid and Hydralazine on Gene Expression and Antiestrogen Resistance in LCC9 Cells
Among the differentially expressed genes, downregulation of KLF4, LGALS3, and MICB, and upregulation of ETV4, each were reversed in TAM-treated LCC9 cells exposed to valproic acid and hydralazine using doses comparable with those given to the rats and consistent with studies in other cancer models (Figure 3A) (20,38). Protein levels of ETV4, KLF4, LGALS3, and MICB (see below) were also determined using western blotting, and statistically significant changes between LCC1 and LCC9 cells were observed, consistent with the changes in mRNA expression (Supplementary Figure 2, available online). Methylation status of ETV4, KLF4, LGALS3, and MICB is summarized in Figure 3B; all three downregulated genes contained statistically significantly more methylated CpG islands in LCC9 cells compared with LCC1 cells. For the upregulated gene (ETV4), one CpG island in the TSS200-TSS1500 region was hypomethylated (Figure 3B), suggesting that reversal of ETV4 expression by valproic acid and hydralazine may be an indirect effect. These data indicate that alterations in the expression of genes related to the increased prevalence of TAM resistance seen with in utero estrogen treatment may be epigenetically induced.
Figure 3.

Changes in the expression of ETV4, KLF4, LGALS3, and MICB by valproic acid and hydralazine and their DNA methylation patterns. A) Reversal of upregulation of ETV4, and downregulation of KLF4, LGALS4, and MICB expression in LCC9 cells treated with vehicle (V) or 4-hydroxy-tamoxifen, by 1 mM valproic acid and 5 μM hydralazine (n = 5 per group). P values indicate statistically significant differences (two-sided two-way analysis of variance) in gene expression between LCC1 and LCC9 cells, and between LCC9 cells, with or without VA+H. Differences between V and TAM: *P < .05; †P < .001 using the two-sided Tukey test. Means (SDs) are shown. B) Differences are shown in the methylation patterns in promoter regions and first exon of ETV4, KLF4, LGALS4, and MICB genes between LCC1 cells compared with LCC9 cells (n = 5 per group). Bars represent CpG islands; those marked with * are different between LCC1 and LCC9 cells (P < .05, two-sided Student’s t test). H = hydralazine; TAM = tamoxifen; VA = valproic acid.
Figure 3.

B) continued.
TAM resistance in LCC9 cells was reversed by adding valproic acid or both valproic acid and hydralazine. Reversal of TAM resistance in LCC9 cells by valproic acid and hydralazine was dose dependent for TAM treatment (Figure 4). The combination of valproic acid and hydralazine was additive.
Figure 4.
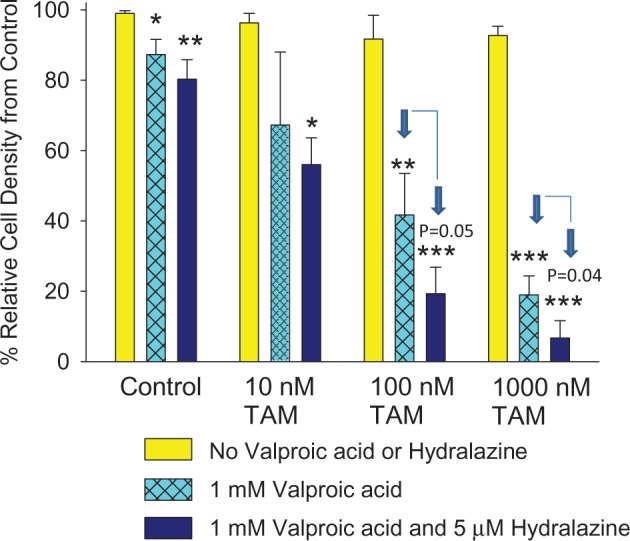
Effect of valproic acid and hydralazine on tamoxifen –resistant human breast cancer cells. Response of anti-estrogen-resistant LCC9 human breast cancer cells to 4-hydroxy-tamoxifen (10–1,000 nM) alone or TAM plus 1 mM valproic acid with and without 5 μM hydralazine. Bars marked * (P < .05), † (P < .01), or ‡ (P < .001) are statistically significantly different from no valproic acid or hydralazine control (two-sided one-way analysis of variance, followed by two-sided Tukey test). P values also are given for statistically significant differences between valproic acid– or valproic acid and hydralazine–treated cells. Data were generated using three replicates of each exposure. Means (SDs) are shown. TAM = tamoxifen.
Effect of ETV4, KLF4, LGALS3, and MICB Silencing by siRNA on TAM Responsiveness in LCC1 or LCC9 Cells and Association of the Expression of These Genes With Clinical Response
Reducing LGALS3 expression using RNAi reduced the response of LCC1 cells to TAM, compared with a control vector (two-way ANOVA, P = .02) (Figure 5A). In contrast, knockdown of ETV4 in anti-estrogen-resistant LCC9 cells increased their response to TAM (two-way ANOVA, P = .02) (Figure 5B). Silencing KLF4 or MICB had no effect on TAM responsiveness in LCC1 cells (data not shown). Recurrence-free survival in the three combined GEO datasets (Figure 5C) was statistically significantly shorter in ER+ breast cancers expressing the highest quartile of ETV4 and the lowest quartile of LGALS3 or KLF4. In a neoadjuvant study, tumors that responded to letrozole exhibited a statistically significant increase in KLF4 expression in the biopsy taken at 90 days of treatment (Figure 5D), but no changes were seen in the expression of ETV4, LGALS3, or MICB.
Figure 5.

Effect of silencing by siRNA of A) ETV4 in LCC9 cells and B) LGALS3 in LCC1 cells on tamoxifen resistance and correlation of gene expression with response to TAM or letrozole. Both LCC9 and LCC1 cells were treated with different doses of 4-hydroxy-tamoxifen or vehicle for seven days, and then cells were stained with 0.5% crystal violet. Experiments were repeated five times (n = 5 in each group). Two-sided two-way analysis of variance values between control siRNA and LGALS3 or ETV4 siRNA are shown. Means (SDs) are provided. C) Association of ETV4, LGALS3 (galectin-3), and KLF4 expression with recurrence-free survival in estrogen receptor–positive (ER+) breast cancer. Data obtained using tumors from ER+ breast cancers in patients treated with TAM in combined GEO datasets: Zhang et al. (GSE12093) (31), Sotiriou et al. (GSE2990) (30), and Loi et al. (GSE6532) (32–34). D) Association of KLF4 expression with response to 90 days’ neoadjuvant treatment (letrozole 2.5 mg/day, oral) (GSE20181) (36,37). Bar marked with * is statistically significantly different using the two-sided Tukey test from the baseline of women responding to treatment: P < .05. Means (SDs) are shown. CI = confidence interval; HR = hazard ratio; NR = no response to treatment; R = responding to treatment; TAM = tamoxifen.
Discussion
Responses of ER+ mammary tumors to TAM in the DMBA model closely mimic those seen in ER+ breast cancer patients. For example, TAM reduces both the risk of breast cancer recurrence (39) and the development of primary tumors in high-risk women (40) by about 50%. In our study, a complete response to TAM was seen in 54% of the tumors in control rats. The rate of TAM resistance in our model also is broadly comparable with what is seen in breast cancer patients (41,42). Local recurrence over 15 weeks in rats, which corresponds to 10 human years (43), was 23%. In ER+ breast cancer patients treated with TAM, the 10-year overall recurrence rate is 22.7% (44). Mammary tumors recurring with continued TAM treatment in rats express high levels of the endoplasmic reticulum chaperone GPR78 (45) and c-MYC (46), which are mechanistically linked to TAM resistance (47,48).
We determined whether the response to TAM is influenced by in utero exposure to EE2 and found that mammary tumors in these rats exhibited a statistically significantly higher rate of both de novo and acquired resistance to TAM than tumors in the control rats. Adding valproic acid and hydralazine to TAM as a second-line treatment reduced the development of de novo TAM resistance and recurrence in the rats exposed to EE2 in utero, but not in the controls. We chose to use valproic acid and hydralazine because these drugs improved the efficacy of radiotherapy and chemotherapy against advanced cervical and breast cancer in phases I, II, and III trials (49–52). Our findings are consistent with observations in women showing a clinical benefit to adding the HDAC inhibitor vorinostat to TAM only for patients with endocrine therapy–resistant metastatic disease who exhibited elevated expression of HDAC2 (19).
We also searched for genes that are differentially expressed in the tumors of in utero EE2-exposed rats and their controls as they may be causally linked to the development of TAM resistance. We compared these genes with those differing in their expression values between anti-estrogen-sensitive (LCC1) and -resistant (LCC9) human breast cancer cells. The acquired anti-estrogen-resistant phenotype appears to involve increased DNA methylation (53); here, we found that a combined treatment with valproic acid and hydralazine reversed TAM resistance in LCC9 cells, consistent with earlier findings in other breast cancer models in vitro (16,18). We hypothesized that common differences in gene expression patterns in rat EE2 tumors and LCC9 human breast cancer cell lines prior to treatment would most likely be among the key drivers of anti-estrogen resistance resulting from in utero EE2 exposure. We explored interactions among the 48 differentially expressed genes using DDN analysis to extract potential network signaling features (54). Specifically, DDN found differential connections among genes that exist only in the LCC9/in utero EE2 grouping or only in the LCC1/control grouping. Node-edge relationships identified genes in the LCC9 cells/in utero EE2 tumors related to increased anti-estrogen resistance (HSPB8 and RET) and altered tumor immune responses (CYP2RI, PTPN13, TRIM47, WASF1, and ZBTB14). In LCC1/control tumors, the nodes interacted with genes implicated in mitochondrial respiration, immune recognition and tumor suppressor activity, and inhibition of epithelial-mesenchymal transition (EMT). The comparison of rat mammary tumors and human breast cancer cells used here validates our approach of integrating insights from two model systems to identify new targets to prevent or reverse anti-estrogen resistance.
Of the differentially expressed genes, altered expression of KLF4, LGALS3, and MICB (each downregulated) and ETV4 (upregulated) was normalized in LCC9 cells by valproic acid and hydralazine. Notably, many CpG islands for KLF4, LGALS3, and MICB were more heavily methylated in the LCC9 than LCC1 cells. We found these differentially expressed genes to be predictive of poor survival in TAM-treated ER+ breast cancer patients. KLF4 inhibits EMT (55) and its expression is reduced in many cancers (56), possibly through hypermethylation (57). LGALS3 is a key regulator of T-cell functions (58), and its reduced expression, perhaps through methylation (59), is linked to cancer progression and poor survival (60). Importantly, we show that silencing LGALS3 by siRNA in LCC1 cells conferred TAM resistance. MICB encodes a glycosylated protein that binds to the NKG2D type II receptor and activates natural killer (NK) cells and cytotoxic T-cells (61). Previously, treatment with valproic acid and hydralazine upregulated MICB and increased the cytotoxicity of NK cells against human breast cancer (38). The only upregulated gene, ETV4, can induce an EMT (62,63). We show that knocking down ETV4 in LCC9 cells restores TAM sensitivity, suggesting that ETV4 is mechanistically related to TAM resistance.
Our study has some limitations. While the animal model used here is generally reflective of ER+ human breast cancer, it may not capture all subtypes identified in women. Further, because endocrine resistance is a complex phenotype, we may not have identified all key genes/pathways altered by in utero estrogenic exposures that lead to endocrine resistance. Finally, it is not clear if our data is limited to TAM or is also reflective of developing resistance to other endocrine therapies because these therapies are not fully cross-resistant.
In summary, an elevated in utero estrogenic environment increased the risk of developing de novo and acquired TAM-resistant ER+ mammary tumors and increased the risk of local recurrence. Further, TAM resistance in in utero EE2 rat mammary tumors, but not in controls, was prevented by treatment with valproic acid and hydralazine. Comparison of gene expression patterns in the EE2 mammary tumors and LCC9 breast cancer cells indicated that the rat tumors are predisposed to fail anti-estrogen therapy. Thus, resistance to TAM may be programmed by exposures to a highly estrogenic in utero environment that may arise naturally, because there is a substantial variation in estrogen levels in normal pregnancies (64), or through exogenous exposure to estrogenic compounds from the environment (10,11).
Funding
This work was supported by U54-CA149147 and U01-CA184902 (to R. Clarke), R01-CA164384 (to L. Hilakivi-Clarke), DOD W81XWH-14-1-0031 (to K. B. Bouker, funding for a postdoctoral fellowship), and P30-CA51008 (to Lombardi Comprehensive Cancer Center, funding for shared resources).
Notes
The study funders had no role in design of the study; the collection, analysis, or interpretation of the data; the writing of the manuscript; or the decision to submit the manuscript for publication.
Author contributions
conception and design: L. Hilakivi-Clarke, A. Wärri, R. Clarke; development of methodology: L. Hilakivi-Clarke, A. Wärri, Y. Wang, R. Clarke; acquisition of data: A. Wärri, K. B. Bouker, X. Zhang, K. L. Cook, J. Lu, A. Zwart, N. Nguyen, R. Hu, M. I. Cruz, X. Wang, B. Wehrenberg; analysis and interpretation of data: L. Hilakivi-Clarke, A. Wärri, J. R. Clarke, Lu, X. Wang, J. Xuan, Y. Wang; writing the manuscript: L. Hilakivi-Clarke, A. Wärri, Y. Wang, R. Clarke; administrative, technical, or material support: M. I. Cruz, S. de Assis, K. B. Bouker, X. Wang, J. Xuan, J. Lu, B. Wehrenberg; study supervision: L. Hilakivi-Clarke.
This study is dedicated to the memory of Dr. Irma Russo, a mother of the preclinical breast cancer model used here, who lost her battle against cancer in September 2013.
Supplementary Material
References
- 1. Palmer JR, Wise LA, Hatch EE, et al. Prenatal diethylstilbestrol exposure and risk of breast cancer. Cancer Epidemiol Biomarkers Prev. 2006;15(8):1509–1514. [DOI] [PubMed] [Google Scholar]
- 2. Hoover RN, Hyer M, Pfeiffer RM, et al. Adverse health outcomes in women exposed in utero to diethylstilbestrol. N Engl J Med. 2011;365(14):1304–1314. [DOI] [PubMed] [Google Scholar]
- 3. Hilakivi-Clarke L, Clarke R, Onojafe I, Raygada M, Cho E, Lippman ME. A maternal diet high in n-6 polyunsaturated fats alters mammary gland development, puberty onset, and breast cancer risk among female rat offspring. Proc Natl Acad Sci U S A. 1997;94:9372–9377. [DOI] [PMC free article] [PubMed] [Google Scholar]
- 4. Hilakivi-Clarke L. Maternal exposure to diethylstilbestrol during pregnancy and increased breast cancer risk in daughters. Breast Cancer Res. 2014;16(2):208. [DOI] [PMC free article] [PubMed] [Google Scholar]
- 5. de Assis S, Warri A, Cruz MI, et al. High-fat or ethinyl-oestradiol intake during pregnancy increases mammary cancer risk in several generations of offspring. Nat Commun. 2012;3:1053. [DOI] [PMC free article] [PubMed] [Google Scholar]
- 6. Doherty LF, Bromer JG, Zhou Y, Aldad TS, Taylor HS. In utero exposure to Diethylstilbestrol (DES) or Bisphenol-A (BPA) increases EZH2 expression in the mammary gland: an epigenetic mechanism linking endocrine disruptors to breast cancer. Horm Cancer. 2010;1(3):146–155. [DOI] [PMC free article] [PubMed] [Google Scholar]
- 7. Dworkin AM, Huang TH, Toland AE. Epigenetic alterations in the breast: Implications for breast cancer detection, prognosis and treatment. Semin Cancer Biol. 2009;19(3):165–171. [DOI] [PMC free article] [PubMed] [Google Scholar]
- 8. Wang Y, Klijn JG, Zhang Y, et al. Gene-expression profiles to predict distant metastasis of lymph-node-negative primary breast cancer. Lancet. 2005;365(9460):671–679. [DOI] [PubMed] [Google Scholar]
- 9. Anjum S, Fourkala EO, Zikan M, et al. A BRCA1-mutation associated DNA methylation signature in blood cells predicts sporadic breast cancer incidence and survival. Genome Med. 2014;6(6):47. [DOI] [PMC free article] [PubMed] [Google Scholar]
- 10. Hotchkiss AK, Rider CV, Blystone CR, et al. Fifteen years after "Wingspread"—environmental endocrine disrupters and human and wildlife health: where we are today and where we need to go. Toxicol Sci. 2008;105(2):235–259. [DOI] [PMC free article] [PubMed] [Google Scholar]
- 11. Crews D, Gillette R, Miller-Crews I, Gore AC, Skinner MK. Nature, nurture and epigenetics. Mol Cell Endocrinol. 2014;398(1-2):42–52. [DOI] [PMC free article] [PubMed] [Google Scholar]
- 12. Boylan ES, Calhoon RE. Prenatal exposure to diethylstilbestrol: ovarian-independent growth of mammary tumors induced by 7,12-dimethylbenz[a]anthracene. J Natl Cancer Inst. 1981;66(4):649–652. [PubMed] [Google Scholar]
- 13. Nagata C, Iwasa S, Shiraki M, Shimizu H. Estrogen and alpha-fetoprotein levels in maternal and umbilical cord blood samples in relation to birth weight. Cancer Epidemiol Biomarkers Prev. 2006;15(8):1469–1472. [DOI] [PubMed] [Google Scholar]
- 14. Stavola BL, Hardy R, Kuh D, Silva IS, Wadsworth M, Swerdlow AJ. Birthweight, childhood growth and risk of breast cancer in a British cohort. Br J Cancer. 2000;83(7):964–968. [DOI] [PMC free article] [PubMed] [Google Scholar]
- 15. Sovio U, Jones R, dos SS, I, Koupil I. Birth size and survival in breast cancer patients from the Uppsala Birth Cohort Study. Cancer Causes Control. 2013;24(9):1643–1651. [DOI] [PubMed] [Google Scholar]
- 16. Park JH, Ahn MY, Kim TH, et al. A new synthetic HDAC inhibitor, MHY218, induces apoptosis or autophagy-related cell death in tamoxifen-resistant MCF-7 breast cancer cells. Invest New Drugs. 2012;30(5):1887–1898. [DOI] [PubMed] [Google Scholar]
- 17. Phuong NT, Kim SK, Lim SC, et al. Role of PTEN promoter methylation in tamoxifen-resistant breast cancer cells. Breast Cancer Res Treat. 2011;130(1):73–83. [DOI] [PubMed] [Google Scholar]
- 18. Raha P, Thomas S, Thurn KT, Park J, Munster PN. Combined histone deacetylase inhibition and tamoxifen induces apoptosis in tamoxifen-resistant breast cancer models, by reversing Bcl-2 overexpression. Breast Cancer Res. 2015;17:26. [DOI] [PMC free article] [PubMed] [Google Scholar]
- 19. Munster PN, Thurn KT, Thomas S, et al. A phase II study of the histone deacetylase inhibitor vorinostat combined with tamoxifen for the treatment of patients with hormone therapy-resistant breast cancer. Br J Cancer. 2011;104(12):1828–1835. [DOI] [PMC free article] [PubMed] [Google Scholar]
- 20. Candelaria M, Gallardo-Rincon D, Arce C, et al. A phase II study of epigenetic therapy with hydralazine and magnesium valproate to overcome chemotherapy resistance in refractory solid tumors. Ann Oncol. 2007;18(9):1529–1538. [DOI] [PubMed] [Google Scholar]
- 21. Connolly R, Stearns V. Epigenetics as a therapeutic target in breast cancer. J Mammary Gland Biol Neoplasia. 2012;17(3-4):191–204. [DOI] [PMC free article] [PubMed] [Google Scholar]
- 22. Duenas-Gonzalez A, Coronel J, Cetina L, Gonzalez-Fierro A, Chavez-Blanco A, Taja-Chayeb L. Hydralazine-valproate: a repositioned drug combination for the epigenetic therapy of cancer. Expert Opin Drug Metab Toxicol. 2014;10(10):1433–1444. [DOI] [PubMed] [Google Scholar]
- 23. Jordan VC. Effect of tamoxifen (ICI 46,474) on initiation and growth of DMBA-induced rat mammary carcinomata. Eur J Cancer. 1976;12(6):419–424. [DOI] [PubMed] [Google Scholar]
- 24. Jordan VC, Allen KE. Evaluation of the antitumour activity of the non-steroidal antioestrogen monohydroxytamoxifen in the DMBA-induced rat mammary carcinoma model. Eur J Cancer. 1980;16(2):239–251. [DOI] [PubMed] [Google Scholar]
- 25. Gottlicher M, Minucci S, Zhu P, et al. Valproic acid defines a novel class of HDAC inhibitors inducing differentiation of transformed cells. EMBO J. 2001;20(24):6969–6978. [DOI] [PMC free article] [PubMed] [Google Scholar]
- 26. Singh N, Duenas-Gonzalez A, Lyko F, Medina-Franco JL. Molecular modeling and molecular dynamics studies of hydralazine with human DNA methyltransferase 1. Chem Med Chem. 2009;4(5):792–799. [DOI] [PubMed] [Google Scholar]
- 27. Brunner N, Boysen B, Jirus S, et al. MCF7/LCC9: an antiestrogen-resistant MCF-7 variant in which acquired resistance to the steroidal antiestrogen ICI 182,780 confers an early cross-resistance to the nonsteroidal antiestrogen tamoxifen. Cancer Res. 1997;57(16):3486–3493. [PubMed] [Google Scholar]
- 28. Zhang B, Li H, Riggins RB, et al. Differential dependency network analysis to identify condition-specific topological changes in biological networks. Bioinformatics. 2009;25(4):526–532. [DOI] [PMC free article] [PubMed] [Google Scholar]
- 29. Tian Y, Zhang B, Hoffman EP, et al. Knowledge-fused differential dependency network models for detecting significant rewiring in biological networks. BMC Syst Biol. 2014;8(1):87. [DOI] [PMC free article] [PubMed] [Google Scholar]
- 30. Sotiriou C, Wirapati P, Loi S, et al. Gene expression profiling in breast cancer: understanding the molecular basis of histologic grade to improve prognosis. J Natl Cancer Inst. 2006;98(4):262–272. [DOI] [PubMed] [Google Scholar]
- 31. Zhang Y, Sieuwerts AM, McGreevy M, et al. The 76-gene signature defines high-risk patients that benefit from adjuvant tamoxifen therapy. Breast Cancer Res Treat. 2009;116(2):303–309. [DOI] [PubMed] [Google Scholar]
- 32. Alonso-Magdalena P, Vieira E, Soriano S, et al. Bisphenol-A Exposure during Pregnancy Disrupts Glucose Homeostasis in Mothers and Adult Male Offspring. Environ Health Perspect. 2010;118(9):1243–1250. [DOI] [PMC free article] [PubMed] [Google Scholar]
- 33. Loi S, Haibe-Kains B, Desmedt C, et al. Definition of clinically distinct molecular subtypes in estrogen receptor-positive breast carcinomas through genomic grade. J Clin Oncol. 2007;25(10):1239–1246. [DOI] [PubMed] [Google Scholar]
- 34. Loi S, Haibe-Kains B, Majjaj S, et al. PIK3CA mutations associated with gene signature of low mTORC1 signaling and better outcomes in estrogen receptor-positive breast cancer. Proc Natl Acad Sci U S A. 2010;107(22):10 208–10 213. [DOI] [PMC free article] [PubMed] [Google Scholar]
- 35. Brenet F, Moh M, Funk P, et al. DNA methylation of the first exon is tightly linked to transcriptional silencing. PLoS ONE. 2011;6(1):e14 524. [DOI] [PMC free article] [PubMed] [Google Scholar]
- 36. Miller WR, Larionov A, Anderson TJ, Evans DB, Dixon JM. Sequential changes in gene expression profiles in breast cancers during treatment with the aromatase inhibitor, letrozole. Pharmacogenomics J. 2012;12(1):10–21. [DOI] [PubMed] [Google Scholar]
- 37. Miller WR, Larionov A. Changes in expression of oestrogen regulated and proliferation genes with neoadjuvant treatment highlight heterogeneity of clinical resistance to the aromatase inhibitor, letrozole. Breast Cancer Res. 2010;12(4):R52. [DOI] [PMC free article] [PubMed] [Google Scholar]
- 38. Chavez-Blanco A, Cruz-Hernandez E, Dominguez GI, et al. Upregulation of NKG2D ligands and enhanced natural killer cell cytotoxicity by hydralazine and valproate. Int J Oncol. 2011;39(6):1491–1499. [DOI] [PubMed] [Google Scholar]
- 39. Fisher B, Dignam J, Bryant J, et al. Five versus more than five years of tamoxifen therapy for breast cancer patients with negative lymph nodes and estrogen receptor-positive tumors. J Natl Cancer Inst. 1996;88(21):1529–1542. [DOI] [PubMed] [Google Scholar]
- 40. Fisher B, Costantino JP, Wickerham DL, et al. Tamoxifen for prevention of breast cancer: report of the national surgical adjuvant breast and bowel project P-1 study. J Natl Cancer Inst. 1998;90:1371–1388. [DOI] [PubMed] [Google Scholar]
- 41. Early Breast Cancer Trialslists' Collaborative Group. Effects of chemotherapy and hormonal therapy for early breast cancer on recurrence and 15-year survival: an overview of the randomised trials. Lancet. 2005;365(9472):1687–1717. [DOI] [PubMed] [Google Scholar]
- 42. Ring A, Dowsett M. Mechanisms of tamoxifen resistance. Endocr Relat Cancer. 2004;11(4):643–658. [DOI] [PubMed] [Google Scholar]
- 43. Sengupta P. The Laboratory Rat: Relating Its Age With Human's. Int J Prev Med. 2013;4(6):624–630. [PMC free article] [PubMed] [Google Scholar]
- 44. Dowsett M, Forbes JF, Bradley R, et al. Aromatase inhibitors versus tamoxifen in early breast cancer: patient-level meta-analysis of the randomised trials. Lancet. 2015;386(10001):1341–1352. [DOI] [PubMed] [Google Scholar]
- 45. Cook KL, Shajahan AN, Warri A, Jin L, Hilakivi-Clarke LA, Clarke R. Glucose-regulated protein 78 controls cross-talk between apoptosis and autophagy to determine antiestrogen responsiveness. Cancer Res. 2012;72(13):3337–3349. [DOI] [PMC free article] [PubMed] [Google Scholar]
- 46. Shajahan-Haq AN, Cook KL, Schwartz-Roberts JL, et al. MYC regulates the unfolded protein response and glucose and glutamine uptake in endocrine resistant breast cancer. Mol Cancer. 2014;13:239. [DOI] [PMC free article] [PubMed] [Google Scholar]
- 47. Cook KL, Shajahan AN, Clarke R. Autophagy and endocrine resistance in breast cancer. Expert Rev Anticancer Ther. 2011;11(8):1283–1294. [DOI] [PMC free article] [PubMed] [Google Scholar]
- 48. Miller TW, Balko JM, Ghazoui Z, et al. A gene expression signature from human breast cancer cells with acquired hormone independence identifies MYC as a mediator of antiestrogen resistance. Clin Cancer Res. 2011;17(7):2024–2034. [DOI] [PMC free article] [PubMed] [Google Scholar]
- 49. Arce C, Perez-Plasencia C, Gonzalez-Fierro A, et al. A proof-of-principle study of epigenetic therapy added to neoadjuvant doxorubicin cyclophosphamide for locally advanced breast cancer. PLoS ONE. 2006;1:e98. [DOI] [PMC free article] [PubMed] [Google Scholar]
- 50. Coronel J, Cetina L, Pacheco I, et al. A double-blind, placebo-controlled, randomized phase III trial of chemotherapy plus epigenetic therapy with hydralazine and valproate for advanced cervical cancer. Preliminary results. Med Oncol. 2011;28(Suppl 1):S540–S546. [DOI] [PubMed] [Google Scholar]
- 51. Bauman J, Shaheen M, Verschraegen CF, et al. A Phase I Protocol of Hydralazine and Valproic Acid in Advanced, Previously Treated Solid Cancers. Transl Oncol. 2014;7:349–354. [DOI] [PMC free article] [PubMed] [Google Scholar]
- 52. Mani E, Medina LA, Isaac-Olive K, Duenas-Gonzalez A. Radiosensitization of cervical cancer cells with epigenetic drugs hydralazine and valproate. Eur J Gynaecol Oncol. 2014;35(2):140–142. [PubMed] [Google Scholar]
- 53. Lin X, Li J, Yin G, et al. Integrative analyses of gene expression and DNA methylation profiles in breast cancer cell line models of tamoxifen-resistance indicate a potential role of cells with stem-like properties. Breast Cancer Res. 2013;15(6):R119. [DOI] [PMC free article] [PubMed] [Google Scholar]
- 54. Zhang B, Tian Y, Jin L, et al. DDN: a caBIG(R) analytical tool for differential network analysis. Bioinformatics. 2011;27(7):1036–1038. [DOI] [PMC free article] [PubMed] [Google Scholar]
- 55. Tiwari N, Meyer-Schaller N, Arnold P, et al. Klf4 is a transcriptional regulator of genes critical for EMT, including Jnk1 (Mapk8). PLoS ONE. 2013;8(2):e57329. [DOI] [PMC free article] [PubMed] [Google Scholar]
- 56. Tetreault MP, Yang Y, Katz JP. Kruppel-like factors in cancer. Nat Rev Cancer. 2013;13(10):701–713. [DOI] [PubMed] [Google Scholar]
- 57. Li H, Wang J, Xiao W, et al. Epigenetic alterations of Kruppel-like factor 4 and its tumor suppressor function in renal cell carcinoma. Carcinogenesis. 2013;34(10):2262–2270. [DOI] [PubMed] [Google Scholar]
- 58. Hsu DK, Chen HY, Liu FT. Galectin-3 regulates T-cell functions. Immunol Rev. 2009;230(1):114–127. [DOI] [PubMed] [Google Scholar]
- 59. Margadant C, van dB I, van Boxtel AL, Thijssen VL, Sonnenberg A. Epigenetic regulation of galectin-3 expression by beta1 integrins promotes cell adhesion and migration. J Biol Chem. 2012;287(53):44 684–44 693. [DOI] [PMC free article] [PubMed] [Google Scholar]
- 60. Yamaki S, Fujii T, Yajima R, et al. Clinicopathological significance of decreased galectin-3 expression and the long-term prognosis in patients with breast cancer. Surg Today. 2013;43(8):901–905. [DOI] [PubMed] [Google Scholar]
- 61. Pages F, Kroemer G. Prognostic impact of anticancer immune responses: an introduction. Semin Immunopathol. 2011;33(4):317–319. [DOI] [PubMed] [Google Scholar]
- 62. Yuen HF, Chan YK, Grills C, et al. Polyomavirus enhancer activator 3 protein promotes breast cancer metastatic progression through Snail-induced epithelial-mesenchymal transition. J Pathol. 2011;224(1):78–89. [DOI] [PubMed] [Google Scholar]
- 63. Fernando RI, Castillo MD, Litzinger M, Hamilton DH, Palena C. IL-8 signaling plays a critical role in the epithelial-mesenchymal transition of human carcinoma cells. Cancer Res. 2011;71(15):5296–5306. [DOI] [PMC free article] [PubMed] [Google Scholar]
- 64. Lof M, Hilakivi-Clarke L, Sandin SS, de AS, Yu W, Weiderpass E. Dietary fat intake and gestational weight gain in relation to estradiol and progesterone plasma levels during pregnancy: a longitudinal study in Swedish women. BMC Womens Health. 2009;9:10. [DOI] [PMC free article] [PubMed] [Google Scholar]
Associated Data
This section collects any data citations, data availability statements, or supplementary materials included in this article.