

Abstract
Aims
Filgotinib (GS‐6034, formerly GLPG0634) is an oral, selective Janus kinase 1 (JAK1) inhibitor that showed early response and sustained efficacy in patients with rheumatoid arthritis and with Crohn's disease. The aim of the present study was to investigate the impact of age and renal impairment (RI) on the pharmacokinetics (PK) of filgotinib and its main metabolite.
Methods
The effect of age was assessed in two groups of 10 elderly healthy subjects (65–74 and ≥75 years of age) and a control group of 10 younger healthy subjects (40–50 years of age). The impact of RI was investigated in three groups of subjects with mild (n = 6), moderate (n = 6) and severe (n = 3) RI [estimated glomerular filtration rate (eGFR) 60–89, 30–59 and 15–29 ml min–1 1.73 m–2, respectively] and a control group (n = 9) with normal renal function (eGFR ≥90 ml min–1 1.73 m–2). The PK of filgotinib and its metabolite were evaluated following filgotinib 100 mg once‐daily doses for 10 days.
Results
At steady state, the exposure [area under the concentration–time curve over the dosing interval (AUC0–24 h)] of filgotinib and its metabolite was moderately higher (1.45‐ and 1.33‐fold, respectively) in the elderly subjects (≥75 years) compared with younger subjects. Renal clearance for filgotinib and its metabolite decreased with the degree of RI, leading to a maximum increase in AUC0–24 h of 1.54‐fold for filgotinib and 2.74‐fold for the metabolite in subjects with severe RI. Filgotinib was generally safe and well tolerated.
Conclusions
Age and mild to moderate impairment of renal function had limited impact on the PK of filgotinib. In subjects with severe RI, the exposure to the metabolite of filgotinib was elevated, consistent with its renal elimination pathway.
Keywords: Pharmacokinetics, inflammation < Immunology, elderly < Geriatrics
What is Already Known about this Subject
Filgotinib is an oral, small‐molecule, selective Janus kinase 1 inhibitor that combines early response and sustained efficacy in patients with rheumatoid arthritis and Crohn's disease.
Filgotinib pharmacokinetics (PK) have previously been characterized in healthy subjects and in patients, demonstrating extensive and rapid absorption and dose‐proportional PK over a 50–200 mg once‐daily dose range.
What this Study Adds
The study found supporting data to indicate that age and mild to moderate impairment of renal function had a limited impact on the PK of filgotinib and its major metabolite.
Introduction
Filgotinib is an oral, small‐molecule, selective Janus kinase 1 (JAK1) inhibitor combining early response and sustained clinical efficacy in rheumatoid arthritis (RA) 1, 2, 3, 4 and Crohn's disease (CD) 5, 6. Selectively inhibiting JAK1 may modulate a subset of proinflammatory cytokines within the JAK–signal transducer and activator of transcription (STAT) pathway, which may improve the benefit–risk profile compared with other pan‐JAK inhibitors 7.
Filgotinib is a selective JAK1 inhibitor with a half maximal inhibitory concentration (IC50) value of 629 nM (267 ng ml–1); in human whole blood, the compound was 30 times more selective for JAK1 over JAK2 8, 9. Filgotinib has a major metabolite with a similar JAK1 selectivity profile but with reduced potency (19‐fold) in a human whole‐blood assay 8. In humans, exposure to this metabolite is higher by approximately 16‐ to 20‐fold compared with the parent filgotinib 10. Filgotinib is extensively and rapidly absorbed after oral dosing, and is metabolized by carboxylesterase isoform 2 (CES2), forming its main metabolite 11. Systemic exposures of filgotinib and its main metabolite increased dose proportionally over a 50–200 mg once‐daily dose (QD) range. Filgotinib and its metabolites are predominantly eliminated in urine (>80%).
RA is a chronic, progressive, systemic inflammatory disease. Lifelong disease‐modifying therapy may be required in RA, extending treatment into older patient groups. Hence, characterization of the potential effect of age on filgotinib pharmacokinetics (PK) is important to inform whether dose adjustments may be necessary in the elderly. Various physiological changes that can have an impact on drug disposition are associated with ageing 12, such as reduced muscle mass and total body water, and increased body fat 13. In addition, a reduction in the apparent liver blood flow with age by about 40% is also expected to affect phase I metabolism rather than phase II conjugation. Although the metabolism of filgotinib is not mediated by cytochrome P450 (CYP450) at the hepatic level, but rather by CES2 at the intestinal level, there is limited information available on the potential impact of ageing on these enzymes. Finally, the most significant organ changes in the elderly occur in the kidneys, with a decline in estimated glomerular filtration rate (eGFR) from 0.40 ml min–1 1.73 m–2 to 1.02 ml min–1 1.73 m–2 per year.
The current study sought to characterize the effect of ageing and renal impairment (RI) on the PK of filgotinib and its major metabolite, to gain information on optimal dosing and to maximize its benefit : risk profile. Although the PK of filgotinib are linear (i.e. dose proportional and time independent) within the therapeutic dose range (50–200 mg), the investigations were performed after repeated dosing (100 mg QD), to assess any potential change induced by age and/or decrease in kidney function on the steady‐state PK of filgotinib and its main metabolite.
Methods
Two studies were conducted in accordance with the accepted standards for the protection of patient safety and welfare, and the principles of the Declaration of Helsinki and its amendments, and followed Good Clinical Practice. Protocols and informed consent forms for the ageing study and the RI study were approved by the Ziekenhuis Netwerk Antwerpen Ethics Committee (Belgium) and by Ärztekammer Schleswig‐Holstein Independent Ethics Committee (Germany), respectively. All subjects gave written informed consent prior to study initiation.
Trial designs
Effect of age (NCT2012–002721‐30)
The effect of age was evaluated in an open‐label phase I study conducted in two groups of 10 healthy elderly subjects (65–74 and ≥ 75 years of age) and one control group of 10 younger subjects (40–50 years of age). Eligible subjects were in good health, with a body mass index (BMI) of 18–30 kg m–2 and no clinically significant deviation from normal, in terms of medical history, physical examinations, vital signs, electrocardiograms (ECGs) and clinical laboratory determinations. Subjects were excluded from the study if they had history of or a current immunosuppressive condition or the presence or sequelae of gastrointestinal, liver or kidney, or other conditions known to interfere with the absorption, distribution, metabolism or excretion of drugs. Subjects had to discontinue all medications (including over‐the‐counter medications and herbal supplements) within the 2 weeks prior to first dosing. The two groups of elderly subjects have been arbitrarily defined to cover subjects aged from 65 years and also in the older age range, 75 years and above. All subjects (male and female) were matched for body weight across each age group.
After a standard breakfast, filgotinib 100 mg (capsule formulation) was administered QD for 10 days. Blood samples were collected for filgotinib and its metabolite on day 10 at the following times: predose and at 0.5, 1, 2, 3, 5, 8, 12, 24, 48 and 72 h postdose. Additional predose samples were collected on days 1, 2, 3, 5 and 7 for steady‐state assessment. Urine was collected in three fractions on day 10 (0–6, 6–12, 12–24 h after dosing). Additionally, urine samples were collected on day 1 over 24 h to calculate the creatinine clearance (CLCR) and estimate the potential decline in renal function in elderly subjects.
Effect of RI (NCT2013–004407‐40)
The effect of RI was evaluated in an open‐label phase I study conducted in healthy male and female subjects between 18–79 years of age, with a BMI of 18–34 kg m–2 and with various degrees of RI, categorized according to the eGFR using the modification of diet in renal disease equation. As filgotinib is predominantly eliminated via metabolism, the effect of RI was firstly assessed in three subjects with an eGFR between 15 and 29 (inclusive) ml min–1 1.73 m–2 as a ʻworst caseʼ scenario to determine the magnitude of the change in PK in these subjects with severe RI. The PK and safety data from these three subjects were compared with those of three subjects with normal renal function. Given the substantial changes noted for the metabolite (more than twofold increase in exposure) 14, the study was expanded to investigate further the changes in PK in subjects with moderate (eGFR: 30–59 ml min–1 1.73 m–2) and mild (eGFR: 60–89 ml min–1 1.73 m–2) RI in comparison with PK from subjects with normal renal function. For this second step, six subjects were enrolled for each renal function group. For the final PK analysis, data from subjects with normal renal function included in the two study steps were pooled (n = 9).
Subjects with normal renal function were matched to the RI subjects, in terms of median age (±10 years) and BMI (±15%). Eligible subjects were in good health and in stable condition with regard to renal function, based on the results of medical history, physical examinations, vital signs, 12‐lead ECG and clinical laboratory determinations. Subjects were excluded from the study if they had a history of or a current immunosuppressive condition or a history of gastric surgery, vagotomy and bowel resection, or any surgical procedures known to interfere with the gastrointestinal motility, pH or absorption. Additionally, to control for potential influences derived from the natural course of the renal dysfunction and demonstrate the stability of the RI, the variation in serum creatinine level was measured 3–6 months prior to screening and at the time of screening; this variation should be <20%. Subjects with normal renal function had to discontinue all concomitant medications (including over‐the‐counter medications and herbal supplements) within the 2 weeks prior to first dosing. The same restrictions applied for RI subjects, with the exception of medications essential for the treatment of concomitant medical conditions and the management of RI.
After a 10‐h fast, filgotinib 100 mg (tablet formulation) was administered QD for 10 days. Food had no impact on the bioavailability of filgotinib 10; however, to prevent any issues at dosing intake in these subjects, the tablet was given in a fasted state. Blood samples were collected to evaluate the PK of filgotinib and its metabolite on day 10 at the following times: predose and at 0.25, 0.5, 0.75, 1, 1.5, 2, 2.5, 3, 4, 5, 8, 12, 24, 48, 72 and 168 h after dosing. Trough plasma concentrations were determined at days 1, 2, 3, 5, 7 and 8 for steady‐state assessment. Urine was collected in three fractions on day 10 (0–6, 6–12 and 12–24 h after dosing).
Blood and urine sample management
Blood was collected in tubes containing lithium heparin to obtain plasma for the analysis of concentrations of filgotinib and its major metabolite. Within 30 min after blood collection, the plasma was separated in a refrigerated centrifuge (4–8°C) for 10 min at approximately 1500 g and stored at −20°C until analysis. Urine samples were collected and refrigerated (2–8°C) until sample collection was completed. After measuring the total weight, the urine was homogenized and 10 ml aliquots were placed into prelabelled polypropylene containers and stored at −20°C until analysis.
Bioanalytical and PK assessments
Plasma and urine concentrations of filgotinib and its major metabolite were determined using a validated liquid chromatography–tandem mass spectrometry (LC–MS/MS) assay 10. The internal standard (deuterated filgotinib) was added to plasma samples and then processed by solid phase extraction. The evaporated and reconstituted samples were injected into a SCIEX API3000 LC–MS/MS equipped with a short high‐pressure LC column. Filgotinib and its metabolite were detected with multiple reaction monitoring. Quantification was performed using peak area ratios and standard curves (with 1/x2 least squares quadratic regression) prepared from calibration standards. The lower limit of quantification for filgotinib and its metabolite was 1.00 ng ml–1. For both compounds, the between‐ and within‐run precision for quality controls was expressed as the coefficient of variation (CV%) and was no greater than 8.7% and 8.5%, respectively, with deviations from nominal concentrations of no more than 12.0%.
For urine samples, the between‐ and within‐run precision for quality controls for filgotinib and its metabolite was expressed as CV% and was no greater than 11.0% and 12.9%, respectively, with deviations from nominal concentrations of no more than 14.0%.
The steady‐state PK parameters for filgotinib and its metabolite included: maximum plasma concentration (Cmax), the time of occurrence of Cmax (tmax), the apparent terminal half‐life (t½,λz), the area under the curve over the dosing interval (AUC0–24 h), the metabolite‐to‐parent ratio (R) evaluated using AUC0–24 h, the amount excreted in the urine (Ae) and the renal clearance (CLR) calculated over the dosing interval. These PK parameters were determined using WinNonLin® (version 5.3), Pharsight Corporation, Mountain View, CA, USA.
Safety assessments
General safety was evaluated by the incidence of adverse events through nonleading questioning, vital signs, 12‐lead ECGs, physical examinations and clinical laboratory parameters (haematology, biochemistry and urinalysis).
Statistical analyses
No formal sample size calculations were performed for either study. The number of subjects per group was considered sufficient to allow for relevant comparisons of PK and safety data among subjects with various degrees of RI or of different ages. Descriptive statistics for the PK parameters were calculated. For each group of elderly or RI subjects, the fold‐change in exposure (Cmax and AUC0–24 h) vs. control subjects (i.e. young or normal renal function groups) was calculated as the point estimate with its associated 90% confidence interval (CI) of the least‐square geometric means of the mixed‐effect analysis of variance, with age group or stage of RI as fixed factor, and represented graphically. Additionally, the relationship between PK parameters and renal function (CLCR or eGFR) was explored in both studies.
The impact of age and RI on the PK of filgotinib and its metabolite was assessed, taking into account both the magnitude of the change and the statistical analysis. A fold‐change in mean PK parameters for filgotinib or its metabolite ≤2 was considered as moderate and of no clinical relevance. In addition, for all 90% CIs that contained the value of one, the observed fold‐change was considered as not statistically significant.
Results
Subject disposition and baseline characteristics
Subject disposition is presented in Table 1. Most of the subjects included in the two studies (96.7% and 100%, respectively) were Caucasian. In the study to assess the effect of age, males were predominant in the two elderly groups (70–80%), and females (80%) in the younger control group. In the RI study, most of subjects were male in each subgroup (66.7–100%). The other demographic and baseline characteristics across subgroups, except for age and renal function, were comparable.
Table 1.
Demographic summary
| Group | N | Age (years) | Height (cm) | Weight (kg) | BMI (kg m–2) | Sex (F:M) | Race (Caucasian: Black) | Renal function |
|---|---|---|---|---|---|---|---|---|
| Ageing study (N = 36) | ||||||||
| Age 40–50 | 10 | Median values (range) | 8:2 | 10:0 | CLCR | |||
| 46.0 (41–50) | 167 (154–181) | 72.5 (68–83) | 25.4 (23.2–29.5) | 127 (95.0–158) | ||||
| Age 65–74 | 10 | 67.5 (65–72) | 172 (157–182) | 74.5 (69–81) | 25.7 (23.2–30.0) | 2:8 | 9:1 | 115 (77.4–135) |
| Age ≥75 | 10 | 78.0 (75–81) | 167 (153–173) | 72.5 (62–90) | 26.9 (22.6–30.1) | 3:7 | 10:0 | 103 (81.9–136) |
| RI study (N = 24) | ||||||||
| Normal renal function | 9 | Median values (range) | 2:7 | 6:0 | eGFR a (ml min–1 1.73 m–2) | |||
| 65.0 (63–78) | 175 (160–185) | 77.6 (66.4–101 | 26.0 (24.0–30.0) | 101.0 (94.0–116.0) | ||||
| Mild RI | 6 | 71.0 (60–79) | 171 (158–182) | 70.0 (54.0–102) | 24.5 (19.0–34.0) | 3:3 | 6:0 | 73.5 (61.0–75.3) |
| Moderate RI | 6 | 69.0 (47–78) | 173 (163–174) | 76.2 (58.2–81.0) | 25.5 (20.0–30.0) | 2:4 | 6:0 | 47.5 (33.0–54.0) |
| Severe RI | 3 | 73.0 (71–77) | 170 (170–180) | 85.8 (75.0–108) | 30.0 (26.0–33.0) | 0:3 | 3:0 | 22.0 (15.0–25.0) |
BMI, body mass index; CLCR, creatinine clearance after the dose (day 1); eGFR, estimated glomerular filtration rate; F, female; M, male; RI, renal impairment
According to Modification in Diet in Renal Disease equation
Effect of age
A summary of PK parameters for filgotinib and its metabolite at day 10 of dosing is shown in Table 2. After repeated daily oral administration, filgotinib was rapidly absorbed, followed by a biphasic decline in plasma concentrations (Figure 1). Sequential predose (trough) concentrations are shown in Figure 2, demonstrating no accumulation with repeated dosing. Filgotinib plasma concentrations reached steady state by the second dosing day, regardless of the age group.
Table 2.
Summary of filgotinib and metabolite steady‐state pharmacokinetic parameters and corresponding creatinine clearance across age groups
| PK parameter | Age 40–50 years; N = 10 | Age 65–74 years; N = 10 | Age ≥75 years; N = 10 | |
|---|---|---|---|---|
| Filgotinib | Cmax (μg ml–1) | 0.435 (32.4) | 0.584 (39.3) | 0.629 (32.1) |
| tmax (h) | 2.0 (1.0–5.0) | 2.0 (0.5–3.0) | 2.0 (0.5–3.0) | |
| AUC0–24 h (μg.h ml–1) | 1.60 (32.0) | 1.79 (24.0) | 2.22 (20.6) | |
| t½, λz (h) | 6.07 (58.2)a | 5.83 (23.3)b | 6.90 (36.3)a | |
| Ae0–24 h (% dose) | 8.01 (26.5)b | 6.55 (14.3)c | 7.24 (16.9)b | |
| CLR (l h–1) | 5.55 (19.9)b | 3.90 (23.2)c | 3.33 (20.2)b | |
| Metabolite | Cmax (μg ml–1) | 1.69 (26.5) | 1.90 (15.5) | 2.20 (19.4) |
| tmax (h) | 4.0 (2.0–5.0) | 3.0 (3.0–5.0) | 5.0 (3.0–5.0) | |
| AUC0‐24 h (μg.h ml–1) | 29.4 (27.3) | 34.2 (17.3) | 40.9 (21.9) | |
| t½, λz (h) | 17.8 (17.9) | 24.7 (23.3) | 23.5 (21.2) | |
| Ae0–24 h (% dose) | 34.3 (22.3)b | 37.4 (13.2)c | 37.6 (15.4)b | |
| CLR (l h–1) | 1.25 (19.3)b | 1.13 (20.9)c | 0.926 (29.5)b | |
| R | 18.8 (25.1) | 19.4 (22.0) | 18.4 (16.4) | |
| Creatinine clearance | CLcr (ml min–1) | 127 (12.8) | 111 (16.3) | 100 (15.5) |
Values are arithmetic means (CV%) except median (min–max) for tmax and geometric means (CV%) for R
Ae0–24 h, amount of filgotinib or metabolite excreted in the urine over 24 h, expressed as a percentage of daily dose administered; AUC0–24 h, area under the curve over the dosing interval; CLR, renal clearance; Cmax, maximum plasma concentration; PK, pharmacokinetic; R, metabolite‐to‐parent ratio; tmax, time of occurrence of Cmax; t½,λz, apparent terminal half‐life
N = 7
N = 8
N = 9
Figure 1.
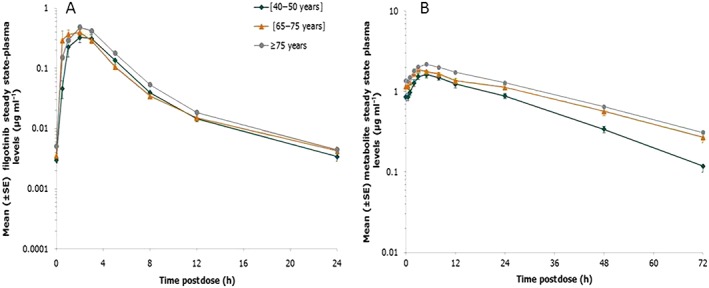
Mean [± standard error (SE)] steady‐state plasma concentration vs. time profiles of filgotinib (A) and its metabolite (B) in the three age groups following dosing with filgotinib 100 mg once daily. Note: There is a 10‐fold difference in the y‐axis scale
Figure 2.
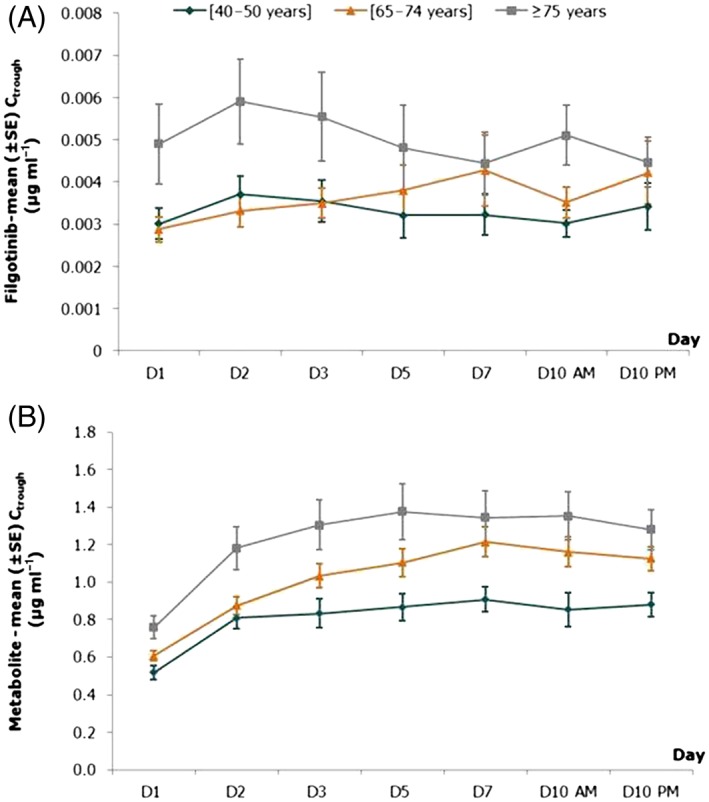
Mean [± standard error (SE)] predose (trough) plasma concentrations of filgotinib (A) and its metabolite (B) in the three age groups following dosing with filgotinib 100 mg once daily
A graphical representation of the fold‐change (with 90% CI) in Cmax and AUC0–24 h of filgotinib between elderly age groups relative to the younger control group is presented in Figure 3. Overall, there were no or minimal differences between age groups for all PK parameters, as shown by the 90% CI containing the value of one, except for exposure (AUC0–24 h), with a maximal increase of 1.40‐fold observed in the oldest vs. youngest age group. The percentage of filgotinib excreted in the urine was not affected by age, with mean values of 6.55% and 7.24% of the daily dose administered for the two elderly age groups, respectively, compared with 8.01% for the younger control group. As a consequence, CLR was 34% lower in the oldest compared with the youngest age group.
Figure 3.
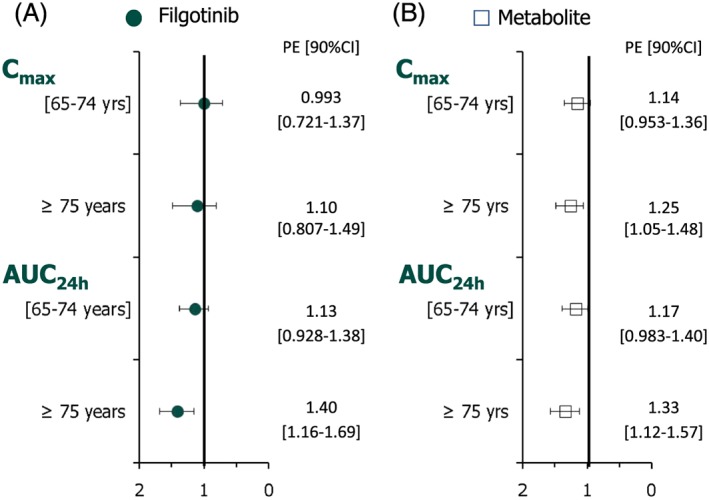
Fold‐change (90% CI) in steady‐state Cmax and AUC0–24 h of filgotinib (A) and its metabolite (B) in elderly subjects (65–74 and ≥75 years) relative to young subjects (40–50 years). AUC0–24 h, area under the curve over the dosing interval; CI, confidence interval; Cmax, maximum plasma concentration; PE point estimate
Of note, even though CLCR in the oldest age group was slightly (~20%) lower than in the two other age groups (Table 1), the values were still within the normal range, indicating no RI in these subjects. The decrease in filgotinib CLR was poorly associated with a decrease in CLCR (Figure 4).
Figure 4.
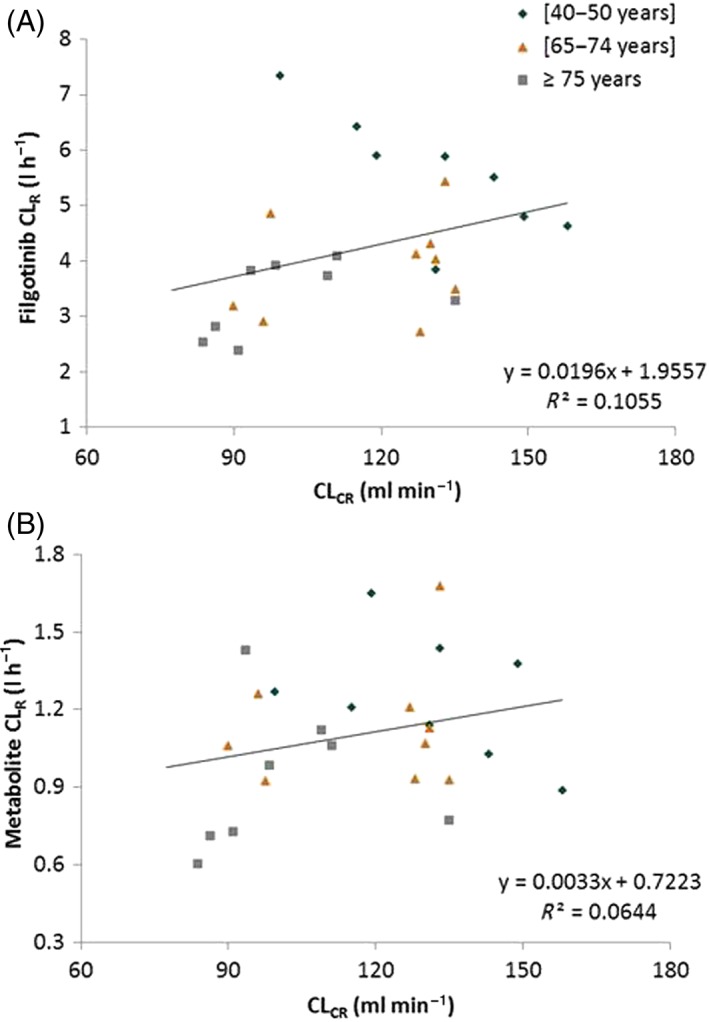
Relationship between the steady‐state renal clearance (CLR) of filgotinib (A) and its metabolite (B), and creatinine clearance (CLCR)
The main metabolite was formed rapidly, with a median tmax ranging between 3.0 h and 5.0 h, and was slowly eliminated according to a mono‐exponential decline (Figure 1). Steady state was attained within 4 dosing days (Figure 2), consistent with the t½,λz of approximately 22 h.
An overall increase of 1.25‐fold in Cmax and of 1.33‐fold in AUC0–24 h was noted in the oldest vs. youngest age groups (Figure 3). Additionally, the percentage of filgotinib metabolite excreted unchanged in the urine was not affected by age: 34.3% and 37.6% of the daily dose administered for the youngest group (40–50 years) and oldest group (≥75 years), respectively. Consequently, CLR was 40% lower in the oldest (CLR = 0.926 l h–1) compared with the youngest (CLR = 1.25 l h–1) age group. In regard to filgotinib, the decrease in metabolite CLR was not associated with a decrease in CLCR (Figure 4).
The apparent elimination half‐life (t½) of filgotinib (mean range: 5.83–6.90 h) was not altered by age. For the metabolite, the apparent elimination t½,λz was similar for the two elderly groups (24.7 h and 23.5 h, respectively) but slightly longer than for the youngest (17.8 h). PK differences between age groups were similar between filgotinib and its metabolite, as reflected by similar R values across the three age groups.
In all age groups, the between‐subject variability was low to moderate, as reflected by CV%s of Cmax and AUC0–24 h lower than 40% for both filgotinib and its metabolite.
Effect of RI
A summary of PK parameters for filgotinib and of its major metabolite at day 10 of dosing is shown in Table 3. Filgotinib was rapidly absorbed, with Cmax reached 1 h after dosing on day 10 (Figure 5). Sequential predose (trough) concentrations are shown in Figure 6, demonstrating that steady state for filgotinib concentrations in the plasma was reached by day 2 in all renal function groups. No accumulation was observed, which was consistent with the short t½,λz (5.42–10.9 h) and the QD dosing interval. In all groups, the between‐subject variability, as reflected by the CV%s of AUC0–24 h and Cmax, was moderate to high after multiple dosing (CV%s up to 60%).
Table 3.
Summary of steady state pharmacokinetic parameters for filgotinib and its metabolite across renal impairment groups
| PK parameter | Normal renal function N = 9 | Mild RI N = 6 | Moderate RI N = 6 | Severe RI N = 3 | |
|---|---|---|---|---|---|
| Filgotinib | Cmax (μg ml–1) | 0.882 (58.2) | 0.780 (60.3) | 0.936 (47.7) | 0.921 (12.1) |
| tmax (h) | 0.8 (0.3–1) | 0.5 (0.3–2) | 0.6 (0.3–4) | 1 (1–1) | |
| AUC0–24 h (μg.h ml–1) | 1.82 (51.4) | 1.89 (29.0) | 2.69 (42.5) | 2.64 (34.2) | |
| t½,λz (h) | 5.42 (30.2) | 10.9 (47.1) | 10.6 (75.4) | 9.03 (51.3) | |
| Ae0–24 h (% dose) | 7.61 (35.4) | 5.37 (42.1) | 4.34 (51.2) | 2.08 (34) | |
| CLR (l h–1) | 4.45 (27.4) | 2.95 (48.1) | 1.89 (61.4) | 0.898 (65) | |
| Metabolite | Cmax (μg ml–1) | 1.63 (31.9) | 1.54 (31.3) | 2.35 (35.4) | 3.43 (14.6) |
| tmax (h) | 3 (2–4) | 3.3 (1.5–5) | 2.3 (0.5–5) | 3 (3–4) | |
| AUC0–24 h (μg.h ml–1) | 24.9 (31.7) | 30.1 (29.3) | 42.7 (38.4) | 66.6 (18.5) | |
| t½,λz (h) | 20.8 (17.1) | 25.4 (24.8) | 31.7 (24.9) | 43.6 (12.6) | |
| Ae0–24 h (% dose) | 37.4 (11.6) | 35.7 (40.3) | 29.9 (24.1) | 32.1 (9.36) | |
| CLR (l h–1) | 1.59 (24.5) | 1.21 (42.1) | 0.781 (47.8) | 0.488 (10.6) | |
| R | 13.8 (21.5) | 15.9 (22.0) | 16.7 (35.8) | 26.0 (20.4) | |
| Renal function | eGFR (ml min–1/1.73 m–2) | 102.1 (2.58) | 71.9 (2.21) | 45.0 (3.69) | 20.7 (2.96) |
Values are arithmetic means (CV%) except median (min–max) for tmax, geometric means (CV%) for R and arithmetic mean (standard error) for estimated eGFR. Ae0–24 h, amount of filgotinib or metabolite excreted in the urine over 24 h, expressed as a percentage of daily dose administered; AUC0–24 h, area under the curve over the dosing interval; CLR, renal clearance; Cmax, maximum plasma concentration; eGFR, estimated glomerular filtration rate according to Modification in Diet in Renal Disease equation; PK, pharmacokinetic; R, metabolite‐to‐parent ratio; tmax, time of occurrence of Cmax; t½,λz, apparent terminal half‐life
Figure 5.
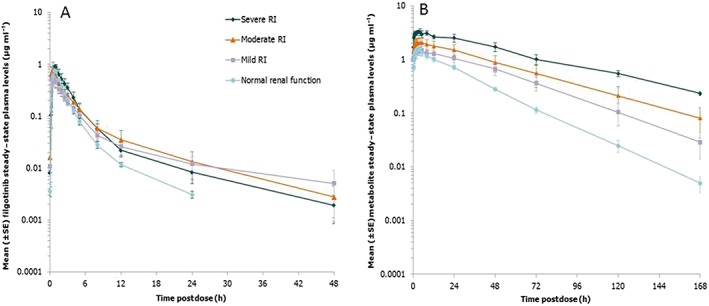
Mean [± standard error (SE)] steady‐state plasma concentration vs. time profiles of filgotinib (A) and its metabolite (B) in subjects with various degrees of renal impairment following dosing with filgotinib 100 mg once daily. RI, renal impairment
Figure 6.
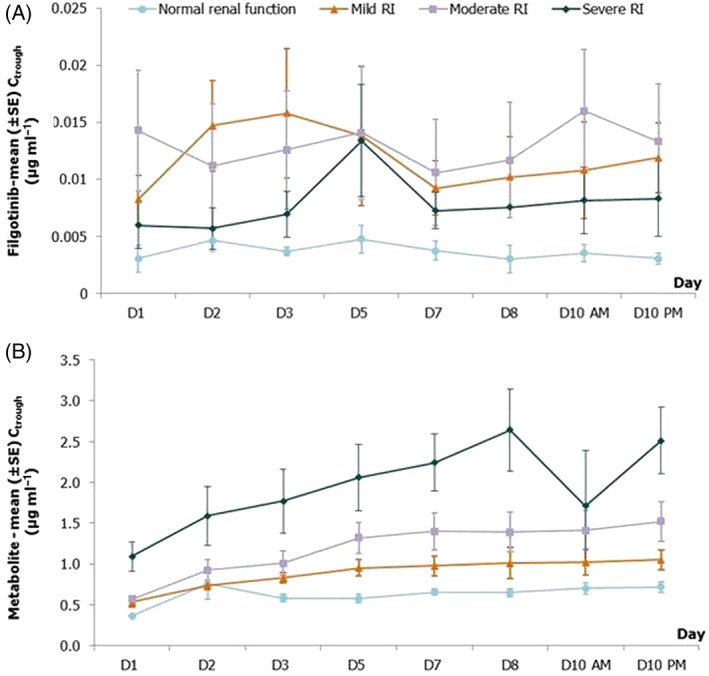
Mean [± standard error (SE)] predose (trough) plasma concentrations of filgotinib (A) and its metabolite (B) in subjects with various degrees of renal impairment following dosing with filgotinib 100 mg once daily. RI, renal impairment
RI reduced the Ae over 24 h (Ae0–24 h), which decreased with the degree of RI. Consequently, the CLR decreased with the degree of RI, leading to 1.54‐ and 1.42‐fold higher filgotinib plasma exposure (AUC0–24 h) in subjects with severe and moderate RI, respectively, compared with subjects with normal renal function (Cmax did not appear to differ according to stage of RI). However, the 90% CI of the fold‐change vs. control group included the value of one and suggested that these changes observed in the AUC0–24 h of filgotinib for moderate and severe RI were not significant (Figure 7).
Figure 7.
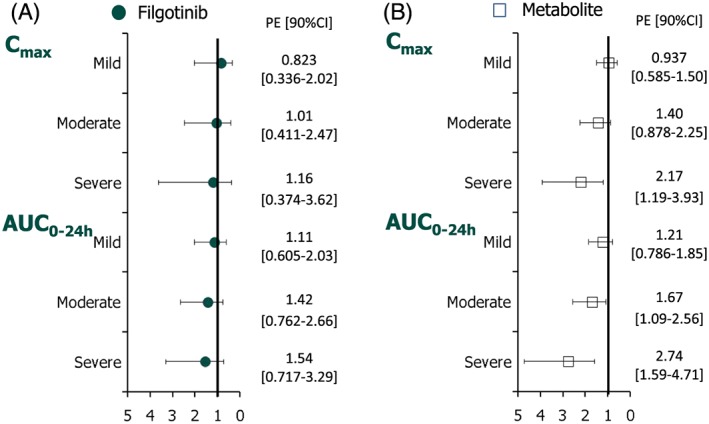
Fold‐change (90% CI) in steady‐state Cmax and AUC0–24 h of filgotinib (A) and its metabolite (B) in subjects with mild, moderate and severe renal impairment relative to subjects with normal renal function. AUC0–24 h, area under the curve over the dosing interval; CI, confidence interval; Cmax, maximum plasma concentration; PE point estimate
For the metabolite, steady‐state plasma concentrations were reached between day 3 (normal renal function and mild RI) and day 5 (moderate and severe RI), consistent with mean t½,λz values ranging from 20.8 h (normal renal function) to 43.6 h (severe RI), as shown in Figure 6. A graphical representation of the fold‐change differences in Cmax and AUC0–24 h between RI groups relative to the group with normal renal function is presented in Figure 7. RI showed a marked effect on the metabolite exposure (Cmax, AUC0–24 h), as well as its elimination parameters (t½,λz and CLR). In the severe RI group, the reduction in its elimination (mean CLR values 0.488 vs. 1.59 l h–1 and mean t½ values 43.6 vs. 20.8 h) resulted in 2.17‐ and 2.74‐fold higher Cmax and AUC0–24 h, respectively, compared with subjects with normal renal function. In the two other RI groups, no or a minimal effect was noted vs. the control group, except for moderate RI, with a 1.67‐fold increase in AUC0–24 h. In all groups, the between‐subject variability reflected by the CV%s of AUC0–24 h and Cmax was low to moderate after multiple dosing (up to 38.4%).
The relationships between exposure to filgotinib and its metabolite (AUC0–24 h and Cmax) and eGFR are illustrated in Figure 8. The correlation coefficient was higher for the metabolite than the parent drug, filgotinib.
Figure 8.
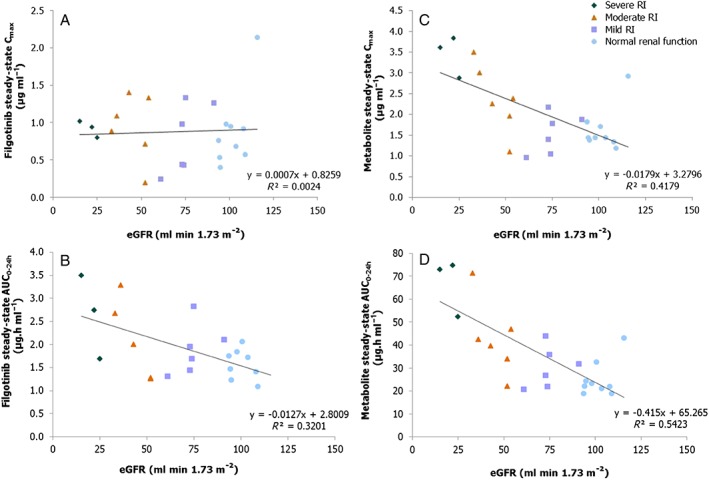
Relationship between steady‐state exposure (Cmax and AUCtau) of filgotinib (A and B) and its metabolite (C and D) and eGFR. AUC0–24 h = area under the curve over the dosing interval, Cmax, maximum plasma concentration; eGFR, estimated glomerular filtration rate; RI, renal impairment
Safety
There were no deaths or serious adverse events during either study. In the current studies, none of the treatment‐emergent adverse events were severe in intensity and none led to study medication withdrawal, although three of them were of moderate severity: migraine (age study), urinary continence (age study) and headache (RI study). There were no clinically significant changes in laboratory values, physical examination, vital signs, or ECG parameters. Filgotinib 100 mg QD for 10 days was generally safe and well tolerated in these studies.
Discussion
Two phase I open‐label studies were conducted to examine the effects of age and RI on the steady‐state PK of filgotinib and its major metabolite. Although most of the subjects included in these two studies were Caucasian (>96%) and males were predominant in the two elderly groups (70–80%) and in each RI group (66.7–100%), this was not expected to confound the potential effect of age or renal function on filgotinib PK, as none of the demographic factors (e.g. sex, body weight, BMI, race) were shown significantly to affect filgotinib PK, based on population PK analysis using phase II data in RA and CD 15, 16, 17.
Although these two studies used different filgotinib formulations and administration conditions (the effect of age study used a capsule formulation in fed conditions and the RI study used a tablet formulation in the fasted state), filgotinib and metabolite exposure appeared to be comparable for the control groups across these two studies.
No change in PK was noted in the 65–74‐year age group. Filgotinib exposure (AUC0–24 h) was moderately higher, by 1.40‐fold, in subjects aged ≥75 years, while Cmax, t½,λz and Ae for unchanged filgotinib were not altered. The CLR decreased with age, as did the CLCR, but without a strong relationship between these parameters. Of note, even though CLCR was lower in elderly subjects, the values were still within the normal range, indicating that there was no RI in these subjects.
Higher gastric pH may have been a factor for differences in bioavailability in elderly subjects 18, 19; however, for filgotinib administered as the hydrochlorhydrate salt in these two studies, a higher gastric pH would have led to filgotinib free base formation, which is less soluble and bioavailable than the ionized form. Consequently, higher gastric pH would be unlikely to account for the observed increase in exposure in the elderly subjects aged ≥75 years.
Similarly to filgotinib, exposure to the metabolite was higher (by 1.33‐fold) in the oldest subjects after filgotinib 100 mg QD, with no change in the formation and elimination of the metabolite. This observation was supported by the constant R values over the entire age range (from 18.4 to 19.4). Based on these data, it could be concluded that age had no impact on the carboxylesterases involved in filgotinib's metabolite formation. Overall, the moderate change (<2‐fold) observed in exposure of filgotinib and its metabolite are unlikely to be linked to physiological changes associated with age and could be due to variability and the small sample size (n = 10 per age group). This is further support by the population PK model developed with data obtained in patients with RA 15 and CD 16, 17, in which age was not included as a significant covariate in the PK modelling of filgotinib and its metabolite.
In the RI study, filgotinib CLR decreased with the degree of RI, with an 80% lower value for subjects with severe RI (0.898 l h–1), compared with subjects with normal renal function (4.45 l h–1). The decrease in CLR in severe RI subjects resulted in a moderate increase in filgotinib systemic exposure (by 1.54‐fold vs. normal). For the metabolite, Cmax, and AUC0–24 h increased with the degree of RI severity. At the extremes of renal function (i.e. severe RI compared with normal renal function), the mean values of Cmax and AUC0–24 h increased by 2.17‐fold and 2.74‐fold, respectively. In the two other RI groups, no or a minimal effect was noted vs. the control group, except for moderate RI with a 1.67‐fold increase in AUC0–24 h. The t½,λz of the filgotinib metabolite was also longer according to RI severity: 20.8 h and 25.4 h for subjects with normal renal function or mild RI, and 31.7 h and 43.6 h for subjects with moderate and severe RI, respectively. The CLR decreased with the degree of RI, with a 51% and 69% drop in the moderate and severe renal RI groups (0.781 l h–1 and 0.488 l h–1), respectively, compared with subjects with normal renal function (1.59 l h–1) or mild RI (1.21 l h–1).
Although the number of subjects included in each RI group was small (n = 3–6), the results of the present study showed a clear trend of increased exposure associated with decreased renal function. The observed differences in exposure to the metabolite were more pronounced compared with the parent drug, which was consistent with the fact that, in humans, filgotinib is mainly metabolized, with only a small fraction (<10%) excreted unchanged in the urine, whereas its metabolite is excreted mainly in the urine (≥50%). In terms of the impact of age and RI, a two‐fold increase in mean exposure was defined as a substantial effect and used as the threshold for interpretation. Based on this criterion, a significant change >2‐fold was observed for the metabolite exposure in severe RI only.
Clinical efficacy was observed at daily doses of 75–300 mg in a phase IIa study in patients with RA with an insufficient response to methotrexate and naïve to biological disease‐modifying anti‐rheumatic drugs, with similar effects noted for these doses in terms of improvements in C‐reactive protein and disease activity scores based on 28 joints 1, 2, 20. Subsequently, efficacy was confirmed in larger, phase IIb studies of filgotinib given as monotherapy 3 and in combination with methotrexate 4. Filgotinib dosed at 100–200 mg once daily is currently being evaluated in pivotal phase III studies in patients across several indications, including RA, CD and ulcerative colitis.
Conclusions
Age and mild to moderate RI had a limited impact on the PK of filgotinib. In subjects with severe RI, the exposure to filgotinib's metabolite was elevated, consistent with its renal elimination pathway.
Competing Interests
F.N. is an employee of Galapagos SASU. L.F., A.V. der A., P.H. and C.T. are employees of Galapagos NV. Y.X. is an employee of Gilead Sciences.
The authors would like to acknowledge colleagues from Galapagos: Mr Nicolas Sabourault and Mr Marc de Weer for drug substance and formulation development; Mrs Christine Guerin for preclinical safety assessment; Dr Magdalena Petkova, Dr Atef Halabi and their trial teams from SGS Life Science Services Clinical Pharmacology Unit (Antwerp, Belgium) and CRS Clinical Research Services Kiel (Kiel, Germany) for conducting these trials; and Mrs Elisabeth Osborne and Mr Mark Hows at LGC (former Quotient BioResearch, Northamptonshire, UK) for plasma and urine sample analysis. Certara (Mark Shelton and Flowers Lovern) provided medical writing support for this manuscript.
Namour, F. , Fagard, L. , Van der Aa, A. , Harrison, P. , Xin, Y. , and Tasset, C. (2018) Influence of age and renal impairment on the steady state pharmacokinetics of filgotinib, a selective JAK1 inhibitor. Br J Clin Pharmacol, 84: 2779–2789. 10.1111/bcp.13726.
The authors confirm that the PIs for this paper are Dr Magdalena Petkova and Dr Atef Halabi who had direct clinical responsibility for patients in the elderly and RI studies, respectively.
References
- 1. Vanhoutte F, Mazur M, Van der Aa A, Wigerinck P, Van't Klooster G. Selective JAK1 inhibition in the treatment of rheumatoid arthritis: proof of concept with GLPG0634. Arthritis Rheumatol 2012; 64 (Suppl. 10): 2489. [Google Scholar]
- 2. Tasset C, Harrison P, Van der Aa A, Meuleners L, Vanhoutte F, Van't Klooster G. The JAK1‐selective inhibitor GLPG0634 is safe and rapidly reduces disease activity in volunteers with moderate to severe rheumatoid arthritis: results of a 4‐week dose ranging study. Arthritis Rheumatol 2013; 65 (Suppl. 10): 2381. [Google Scholar]
- 3. Kavanaugh A, Kremer J, Ponce L, Cseuz R, Reshetko O, Stanislavchuk M, et al Filgotinib (GLPG0634/GS‐6034), an oral selective JAK1 inhibitor, is effective as monotherapy in patients with active rheumatoid arthritis: results from a randomised, dose‐finding study (DARWIN 2). Ann Rheum Dis 2017; 76: 1009–1019. [DOI] [PubMed] [Google Scholar]
- 4. Westhovens R, Taylor PC, Alten R, Pavlova D, Enriquez‐Sosa F, Mazur M, et al Filgotinib (GLPG0634/GS‐6034), an oral JAK1 selective inhibitor, is effective in combination with methotrexate (MTX) in patients with active rheumatoid arthritis and insufficient response to MTX: results from a randomised, dose‐finding study (DARWIN 1). Ann Rheum Dis 2017; 76: 998–1008. [DOI] [PubMed] [Google Scholar]
- 5. Vermeire S, Schreiber S, Patrayka R, Keuhbacher T, Hebuterne X, Roblin X. Clinical remission in patients with moderate‐to‐severe Crohn's disease treated with filgotinib (the FITZROY study): results from a phase 2, double‐blind, randomised, placebo‐controlled trial. Lancet 2017; 389: 266–275. [DOI] [PubMed] [Google Scholar]
- 6. Danese S, Fiorina G, Peyrin‐Biroulet L. Filgotinib in Crohn's disease: JAK is back. Gastroenterology 2017; 153: 603–605. [DOI] [PubMed] [Google Scholar]
- 7. O'Shea JJ, Kontzias A, Yamaoka K, Tanaka Y, Laurence A. Janus kinase inhibitors in autoimmune diseases. Ann Rheum Dis 2013; 72 (Suppl. 2): ii111–ii115. [DOI] [PMC free article] [PubMed] [Google Scholar]
- 8. Van Rompaey L, Galien R, Van der Aar E, Clement‐Lacroix P, Nelles L, Smets B, et al Preclinical characterization of GLPG0634, a selective inhibitor of JAK1 for the treatment of inflammatory diseases. J Immunol 2013; 191: 3568–3577. [DOI] [PubMed] [Google Scholar]
- 9. Galien R, Vayssière B, De Vos S, Auberval M, Vandeghinste N, Dupont S, et al Analyis of the JAK1 selectivity of GLPG0634 and its main metabolite in different species, healthy subjects and rheumatoid arthritis volunteers. Poster presented at the Annual Congress of Rheumatology Conference. 25–30 October 2013; San Diego, CA.
- 10. Namour F, Diderichsen PM, Cox E, Vayssiere B, Van der Aa A, Tasset C, et al Pharmacokinetics and pharmacokinetic/pharmacodynamic modeling of filgotinib (GLPG0634), a selective JAK1 inhibitor, in support of phase IIB dose selection. Clin Pharmacokinet 2015; 54: 859–874. [DOI] [PMC free article] [PubMed] [Google Scholar]
- 11. Namour F, Desrivot J, Van der Aa A, Harrison P, Tasset C, Van't Klooster G. Clinical confirmation that the selective JAK1 inhibitor filgotinib (GLPG0634) has a low liability for drug‐drug interactions. Drug Metab Lett 2016; 10: 38–48. [DOI] [PubMed] [Google Scholar]
- 12. Shah RR. Drug development and use in the elderly: search for the right dose and dosing regimen. Br J Clin Pharmacol 2004; 58: 452–469. [DOI] [PMC free article] [PubMed] [Google Scholar]
- 13. Forbes GB, Reina JC. Adult lean body mass declines with age: some longitudinal observations. Metabolism 1970; 19: 653–663. [DOI] [PubMed] [Google Scholar]
- 14. US Food and Drug Administration . Pharmacokinetics in patients with impaired renal function – study design, data analysis, and impact on dosing and labeling (Draft Guidance), March 2010.
- 15. Namour F, Diderichsen PM, Cox E, Sharma S, Tasset C. Dose selection of filgotinib, a selective JAK1 inhibitor, for rheumatoid arthritis phase 3 studies: exposure‐DAS28 and ACR modeling approach. Poster presented at the American College of Rheumatology/Association of Rheumatology Health Professionals Annual Meeting. 11–16 November 2016; Washington, DC.
- 16. Sharma S, Xin Y, Gao C, Namour F, Mathias A. Population pharmacokinetics and exposure‐response of filgotinib in patients with moderate to severe Crohn's disease. Poster presented at the American Conference of Pharmacometrics. 23–26 October 2016; Bellevue, WA.
- 17. Meng A, Sharma S, Xin Y, Namour F, Mathias A. Population PK/PD modeling for evaluation of filgotinib efficacy in subjects with moderate to severe Crohn's disease. Abstract presented at the American Conference on Pharmacometrics, 15–18 October 2017; Fort Lauderdale, FL.
- 18. Annesley TM. Special considerations for geriatric therapeutic drug monitoring. Clin Chem 1989; 35: 1337–1341. [PubMed] [Google Scholar]
- 19. Turnheim K. When drug therapy gets old: pharmacokinetics and pharmacodynamics in the elderly. Exp Gerontol 2003; 38: 843–853. [DOI] [PubMed] [Google Scholar]
- 20. Taylor PC, Abdule Azeez M, Kiriakidis S. Filgotinib for the treatment of rheumatoid arthritis. Expert Opin Investig Drugs 2017; 26: 1181–1187. [DOI] [PubMed] [Google Scholar]