A common type of DNA modification, addition of a methyl group to cytosine (C) at carbon atom C-5, can greatly increase the rate of mutation of the C to a T. In mammals, methylation of CG sequences increases the rate of CG→TG mutations. It is unknown whether cytosine C-5 methylation increases the mutation rate in bacteria under natural conditions. I show that sites methylated by the Dcm enzyme exhibit an 8-fold increase in mutation rate in natural bacterial populations. I also show that modifications at other sites in various bacteria also increase the mutation rate, in some cases by a factor of forty or more. Finally, I demonstrate how this phenomenon can be used to infer sequence specificities of methylation enzymes.
KEYWORDS: DNA methylation, hypermutation, mutation
ABSTRACT
Methylation of DNA at the C-5 position of cytosine occurs in diverse organisms. This modification can increase the rate of C→T transitions at the methylated position. In Escherichia coli and related enteric bacteria, the inner C residues of the sequence CCWGG (W is A or T) are methylated by the Dcm enzyme. These sites are hot spots of mutation during rapid growth in the laboratory but not in nondividing cells, in which repair by the Vsr protein is effective. It has been suggested that hypermutation at these sites is a laboratory artifact and does not occur in nature. Many other methyltransferases, with a variety of specificities, can be found in bacteria, usually associated with restriction enzymes and confined to a subset of the population. Their methylation targets are also possible sites of hypermutation. Here, I show using whole-genome sequence data for thousands of isolates that there is indeed considerable hypermutation at Dcm sites in natural populations: their transition rate is approximately eight times the average. I also demonstrate hypermutability of targets of restriction-associated methyltransferases in several distantly related bacteria: methylation increases the transition rate by a factor ranging from 12 to 58. In addition, I demonstrate how patterns of hypermutability inferred from massive sequence data can be used to determine previously unknown methylation patterns and methyltransferase specificities.
IMPORTANCE A common type of DNA modification, addition of a methyl group to cytosine (C) at carbon atom C-5, can greatly increase the rate of mutation of the C to a T. In mammals, methylation of CG sequences increases the rate of CG→TG mutations. It is unknown whether cytosine C-5 methylation increases the mutation rate in bacteria under natural conditions. I show that sites methylated by the Dcm enzyme exhibit an 8-fold increase in mutation rate in natural bacterial populations. I also show that modifications at other sites in various bacteria also increase the mutation rate, in some cases by a factor of forty or more. Finally, I demonstrate how this phenomenon can be used to infer sequence specificities of methylation enzymes.
INTRODUCTION
Methylation of cytosine at the C-5 position is a DNA modification found in diverse organisms (reviewed in reference 1). This modification can increase the rate of C→T transition mutations (equivalently, the rate of G→A transitions on the opposite strand) (2–4). This increase is due to the fact that methylated C is somewhat more prone to spontaneous deamination, and to the fact that deaminated methyl C is less likely to be repaired because it yields the natural DNA base T, rather than the unnatural base U (2, 5). In mammals, cytosine C-5 methylation of CG sequences leads to a very high rate of CG→TG mutations (3, 4).
Escherichia coli, Salmonella species, and some other enteric bacteria (6) contain an enzyme, Dcm, that methylates the inner cytosines on both strands of the sequence CCWGG (W is A or T). Dcm sites are a source of mutational hot spots in laboratory experiments (2). This laboratory hypermutability occurs despite the presence of a DNA repair protein, Vsr, the apparent sole purpose of which is preventing mutations at Dcm sites (7–9). On the other hand, Dcm sites do not exhibit hypermutation in nondividing E. coli cells, provided that the vsr gene is intact (10). It has been suggested that Dcm hypermutation is a consequence of unnatural rapid growth in rich medium in the laboratory, and that under natural conditions, Vsr repair is efficient and Dcm sites are not hypermutable (11).
Cytosine C-5 methyltransferases (MTases) with various specificities are found throughout the prokaryotic world, mostly associated with type II restriction modification (RM) systems (12). Unlike Dcm, most of these are found in only a subset of the population. The existence of strains both containing and lacking an MTase allows separation of methylation effects from sequence context effects and can provide assurance that high transition rates are due to methylation. It is known that the M.HpaII MTase from Haemophilus parainfluenzae induces hypermutation at its target sites when introduced into E. coli in the laboratory (13). It has not been established whether restriction-associated MTases lead to hypermutation in nature, or even in their natural hosts.
Here, I examine the effects of cytosine C-5 methylation on mutation rate in natural populations of bacteria, using whole-genome sequence data for tens of thousands of isolates per species or genus. The data show that methylated Dcm sites are in fact hypermutable in natural populations of E. coli and Salmonella. Hypermutability due to other methyltransferases (MTases) is also evident in enteric bacteria and other species. Observations of hypermutation can be used to infer previously unknown methylation patterns.
RESULTS
Dcm methylation causes hypermutation in natural populations of E. coli and Salmonella.
In the E. coli data examined, there are 4,721 C→T and G→A transitions at Dcm methylated sites and 57,939 at other sites. The weighted average (see Materials and Methods) of the ratio of methylated positions to other C/G pairs is 0.01009. The transition rate at methylated sites relative to that at nonmethylated sites is therefore (4,721/57,939)/0.01009 = 8.08 (95% confidence interval [CI], 7.84 to 8.32). Thus, there appears to be considerable hypermutability of Dcm-methylated nucleotides in natural populations, comparable to that observed during rapid growth in rich medium in the laboratory.
Results for Salmonella species are quite similar. There are totals of 19,074 transitions at Dcm methylated sites and 232,002 C→T or G→A transitions at other positions. The weighted average ratio of methylated positions to other C/G sites is 0.01076. It follows that the rate at methylated sites is larger than the average rate by a factor of 7.64 (7.53 to 7.75).
One check of these results is to calculate the relative rates using only transitions inferred to have occurred on internal branches of the trees. The isolates that were analyzed in this study did experience some growth in the laboratory. It seems unlikely that laboratory mutations are so numerous as to dominate the mutational spectrum, especially because most of the isolates were grown only for the purpose of sequencing rather than being cultured extensively. Nonetheless, it would be desirable to eliminate the possibility that laboratory mutants are responsible for the observed hypermutability. Laboratory mutations should map to terminal branches of the tree, so considering only internal branches should eliminate most or all of them. Restricting attention to internal branches, which correspond to events occurring further back in time, would also diminish any effects of the types of hosts and other environments from which the isolates were sampled.
Relative transition rates on internal branches are in fact very similar to, and statistically indistinguishable from, those on whole trees. For E. coli, rates at Dcm sites are higher than average by a factor of 8.50 (8.08 to 8.93). For Salmonella, the relative rate is 7.62 (7.43 to 7.82). Thus, the hypermutability of Dcm sites is apparently not an artifact of brief growth in the laboratory, nor is it restricted to very recent events outside the laboratory.
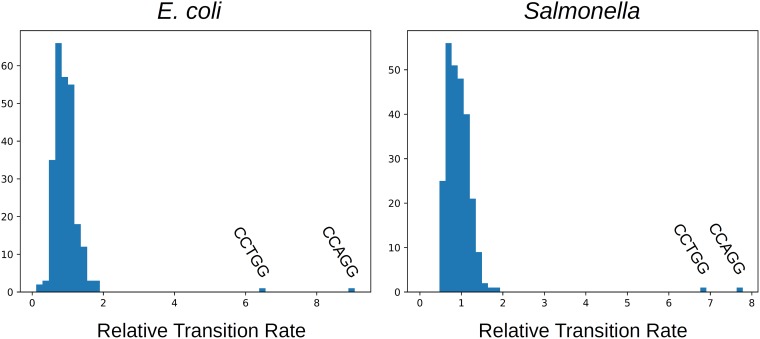
It can be checked that the 8-fold higher rate at Dcm sites does not fall within the range of rate variation due to context effects, which would allow the possibility that it is not due to methylation. There are 44 = 256 possible sequence contexts for NCNNN→NTNNN transitions, two of which (CCAGG and CCTGG) correspond to Dcm sites. Their distributions of the relative transition rates for all of these are shown in Fig. 1. For both E. coli and Salmonella species, the rates at Dcm sites are well outside the distribution of rates at other sequence contexts. Thus, it is implausible that the high rates are explained by context effects, and it appears that they are indeed caused by methylation.
FIG 1.
The distributions of relative rates of transitions at NCNNN sites with all 256 possible sequence contexts. The rates at Dcm sites are gross outliers, making it implausible that their high rates are due to context effects rather than methylation.
BLAST searches confirm the presence of vsr in more than 99% of the isolates. In the few cases where a full-length protein match was not found, this may be due to the fragmentation or incompleteness of the assembled sequence rather than to the absence of an intact vsr gene. In any case, vsr is nearly universally present. Thus, hypermutation occurs at Dcm sites despite the presence of vsr.
Restriction-associated MTases cause hypermutation in Salmonella.
M.SinI is a restriction-associated MTase discovered in Salmonella enterica serovar Infantis (14). It methylates the internal cytosines on both strands of the sequence GGWCC at the C-5 position (the underline indicates the modified residue on the forward strand). A BLAST search of all the Salmonella proteins revealed that, in most clusters, either no isolates contained close M.SinI homologs or all did (see Fig. S1 in the supplemental material), allowing a simple classification of clusters as negative or positive for it. In the positive clusters, the MTase was presumably present in the last common ancestor of the MTase-containing isolates and vertically inherited by them, so that the MTase was present on all of the branches that contribute mutations to the analysis. In a few clusters, just one isolate contained the MTase, and these were eliminated from the analysis. A similar pattern was observed for the other methylases discussed below, with one exception, which is noted.
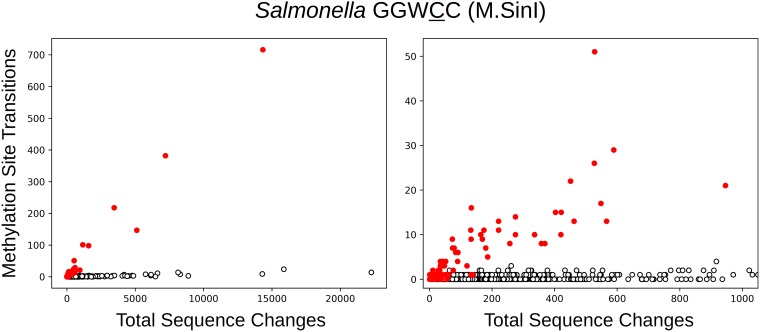
Fig. 2 shows the number of observed transitions at M.SinI target residues as a function of the total number of sequence changes, with M.SinI-containing clusters shown in red. It is readily apparent that there is a much higher transition rate at M.SinI target nucleotides when they are methylated. In fact, the presence of this methylation pattern can be diagnosed from the plot for clusters with a sufficient total number of mutations.
FIG 2.
The number of transitions at GGWCC positions (M.SinI methylation sites) in Salmonella clusters as a function of the total number of sequence changes. Each plotted point represents a cluster of closely related isolates. Clusters that contain M.SinI, as determined by sequence similarity, are shown in red, while clusters that lack this MTase are shown as open circles. The right panel is an enlarged detail of the left panel.
A tally of the sequence changes in the two classes of clusters reveals a total of 2,145 methylation-associated transitions in the M.SinI-containing clusters, out of a total change count of 44,475. For clusters lacking M.SinI, the counts are 363 and 396,293. The ratio of site frequencies is 0.957, indicating a somewhat lower frequency of M.SinI sites in clusters containing the MTase. The relative rate at M.SinI sites in the presence of MTase is then [2,145/(44,475-2,145)]/[363/(396,293-363)]/0.957 = 57.8 (51.6 to 64.7). That is, methylation of a cytosine by M.SinI increases its transition rate by a factor of ∼58.
The transition rate at M.SinI-methylated sites can also be compared to that at other sites in the same genome, as was done for Dcm sites, for which no comparison to groups lacking MTase was possible. The rate at M.SinI-methylated sites is found to be 53.3 times the average (51.0 to 55.8). This result agrees well with the above comparison, as expected if MTase target sequences have near-average rates in the absence of MTase.
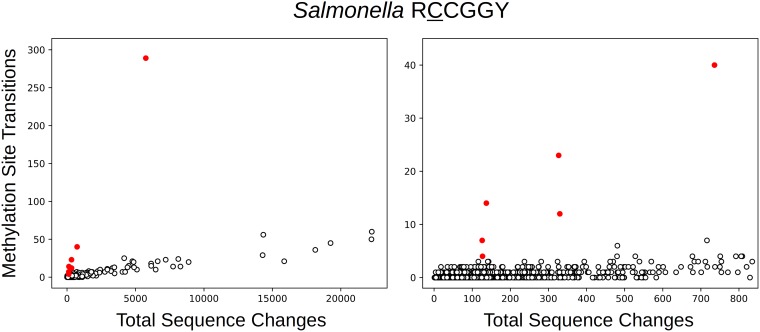
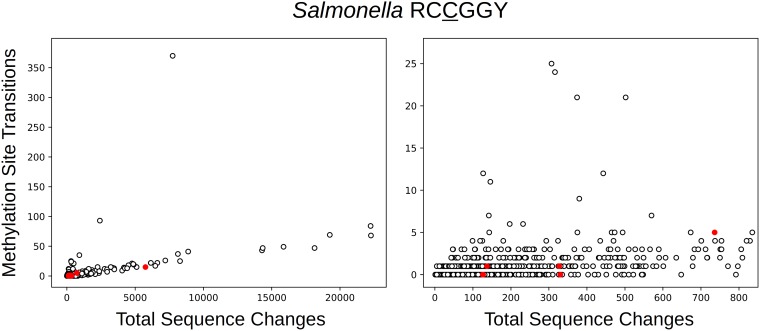
Another restriction-associated C-5 MTase is found in some Salmonella isolates that, according to the Restriction Enzyme Database (REBASE) (15) (entry M.Sen35185ORF12517P), methylates RCCGGY (R is A or G; Y is T or C) at an unknown position. It is clear from analysis of mutation patterns that the first C in this sequence is modified: clusters that carry the MTase have much higher rates of transition at RCCGGY sites (Fig. 3) but not at RCCGGY sites (Fig. 4, which also reveals the effects of other MTases present in different clusters). In the MTase-containing clusters there were 389 transitions at the methylated positions (RCCGGY) out of a total of 7,537 sequence changes. For clusters without the MTase, 1,300 out of 503,620 were transitions at these positions. The site frequency ratio was 0.989. It follows that methylation increases the transition rate by a factor of 21.3 (18.9 to 23.9). The within-genome comparison yields a slightly lower, but comparable, relative rate, 16.2 (14.5 to 18.0).
FIG 3.
The number of transitions at RCCGGY positions in Salmonella clusters as a function of the total number of sequence changes. Details are as in Fig. 1, except that red indicates the presence of a different MTase (REBASE number M.Sen35185ORF12517P).
FIG 4.
The number of transitions at RCCGGY positions in Salmonella clusters as a function of the total number of sequence changes. As in Fig. 3, red indicates the presence of MTase M.Sen35185ORF12517P in the cluster. These clusters do not exhibit hypermutation at these positions (compare to Fig. 3), although some other clusters do due to the actions of other MTases, which are discussed below.
Methylation-associated hypermutation in Listeria.
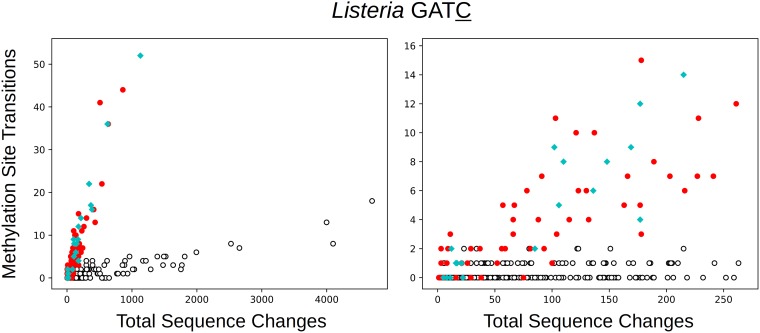
Listeria species are represented in the data by the largest number of isolates after those of Salmonella species and E. coli. Many strains of Listeria monocytogenes carry a restriction modification (RM) system that methylates the C in GATC sequences at the C-5 position (16, 17). Analysis suggested that another MTase found in some isolates, with approximately 50% amino acid identity to the first, also methylates the C in this sequence. Figure 5 illustrates that the presence of either MTase increases the rate of transitions at these sites. There are 620 transitions at methylation target positions in clusters containing either MTase, out of a total of 12,853 sequence changes. In clusters lacking both MTases, there are 282 transitions at these sites out of a total of 75,184 changes. The site frequency ratio is 0.980. It follows that methylation increases the rate of transition by a factor of 16.7 (14.3 to 19.5). Compared to positions in the same genome that are not methylation targets, the rate at methylated sites is higher by a comparable factor of 13.0 (12.0 to 14.2). The rates for clusters containing the two MTases are similar and statistically indistinguishable; the ratio of rate for the first to that for the second is 0.90 (0.76 to 1.07).
FIG 5.
The number of transitions at GATC positions in Listeria clusters as a function of the total number of sequence changes. Red indicates the presence of one MTase, and cyan indicates the presence of another that apparently also methylates GATC.
Methylation-associated hypermutation in Campylobacter.
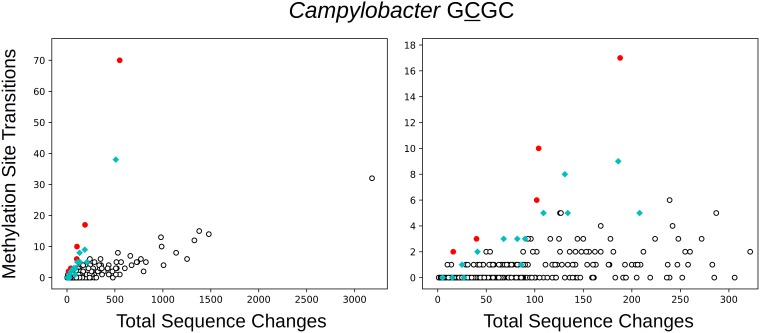
The next most highly represented group is Campylobacter. Some strains of Campylobacter contain a cytosine C-5 MTase that, according to REBASE, recognizes the sequence GCGC. Analysis revealed that this MTase increases the transition rate at the first C of this sequence (Fig. 6, red symbols). However, it is apparent that some clusters that lack this MTase also exhibit hypermutation at these positions. Examination of the reference genome for the largest of these clusters (PDS000002974.31) revealed a single cytosine C-5 MTase (identical to NCBI reference sequence [RefSeq] WP_002875392.1), which is only distantly related to the first MTase (amino acid identity of ∼28% in an alignment that includes only about half of the protein sequences). Clusters containing close homologs of this MTase are shown with cyan symbols. The specificity of sequence matches to this enzyme is listed as unknown by REBASE, but it apparently methylates the first C of at least some GCGC sequences.
FIG 6.
The number of transitions at GCGC positions in Campylobacter clusters as a function of the total number of sequence changes. Red indicates the presence of an MTase predicted to methylate GCGC. Cyan indicates the presence of another MTase that is inferred, on the basis of the relationship shown in the figure, to methylate at least some GCGC sites.
As is evident from Fig. 6, this second MTase (cyan) induces less hypermutation than the first (red). The first increases the transition rate by a factor of 25.1 (19.8 to 31.7), while the second increases it by only a factor of 8.2 (6.3 to 10.5). Thus, the rate in the presence of the first MTase is higher by a factor of 3.1 (2.3 to 4.2) than the rate in the presence of the second MTase. Comparison to other sites in the genome yields higher relative rates, namely, 58.7 (47.2 to 72.3) for the first MTase and 18.8 (14.8 to 23.5) for the second. This reflects the fact that GCGC positions have higher than average transition rates, even in the absence of these MTases. The ratio of these rates again indicates a 3.1-fold lower rate for the second MTase.
This apparent difference in rates suggests that the second MTase has a narrower specificity, so that only a subset of GCGC sites is methylated. A detailed analysis of mutation patterns (see the text in the supplemental material) suggests that the specificity is indeed narrower, but that this does not explain the difference in rates. The second MTase may be specific for WGCGCD sequences (D is A, T, or G) or a similar subset of GCGC. However, accounting for this leaves a rate difference of approximately a factor of 2. Some possible explanations are discussed in the supplemental material. Calculation of the relative transition rate on the basis of the narrower specificity yields somewhat higher values, as expected, namely, 12.2 (10.9 to 19.0) for the comparison to the same sites in clusters lacking MTase and 27.8 (21.8 to 34.9) for the comparison to other sites in the genome.
Discovering unknown MTase specificities.
It is evident from Fig. 2 through 6 that the existence of an MTase with a given specificity is often immediately apparent from inspection of mutation patterns at putative methylation sites. In Campylobacter species, the apparent specificity of an MTase was discovered because it happened to be similar to that of another MTase with known specificity. Deliberate discovery of MTase activities can often be easy, as illustrated below.
(i) Tetranucleotide motifs in Salmonella.
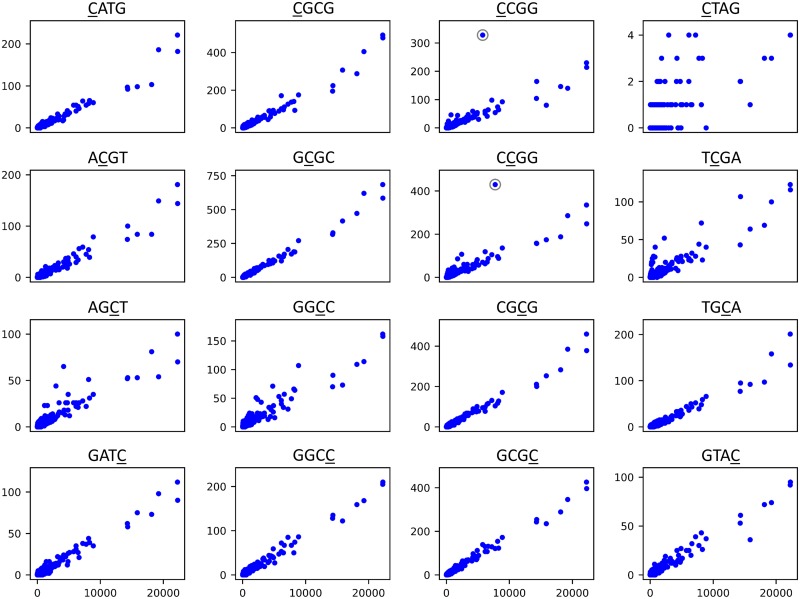
There are sixteen possible palindromic 4-base cytosine methylation motifs (this tally counts methylation of different cytosines of the same sequence, e.g., CGCG and CGCG, separately). Examination of mutation patterns at these sites may reveal 4-base methylation specificities but also, e.g., 6-base specificities centered on these tetranucleotides, provided that the methylated cytosine lies within the central four bases.
Figure 7 shows mutation patterns for Salmonella species for all sixteen tetranucleotide motifs. Obvious fingerprints of methylation are apparent for some, and possible indications are apparent for others.
FIG 7.
Patterns of transitions at all 16 possible palindromic tetranucleotide specificities of cytosine methylation in Salmonella species. The two circled points represent the most obvious cases of hypermutation. The apparently responsible MTases are discussed in the text.
Hypermutation is obvious for CCGG, particularly for one cluster (represented by a circled point in Fig. 7) with a relatively large number of sequence changes. This is due to the RCCGGY-specific MTase discussed above (Fig. 3). Had this specificity been unknown, examination of the reference genome for this cluster would have revealed the responsible MTase, and examination of the contexts of the transitions at this site would have revealed RCCGGY as the likely specificity.
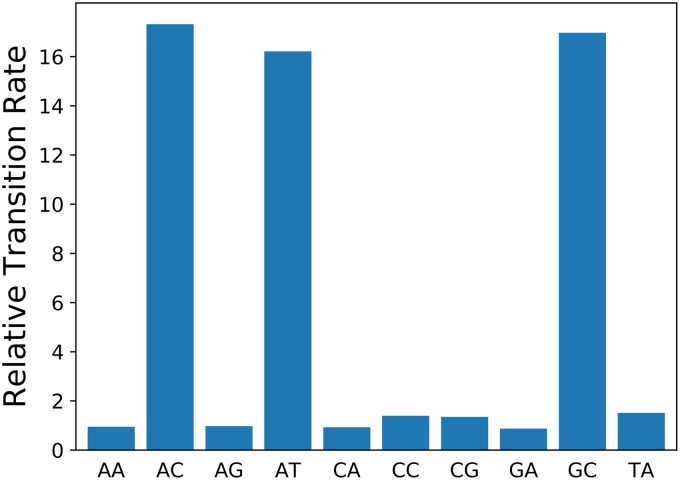
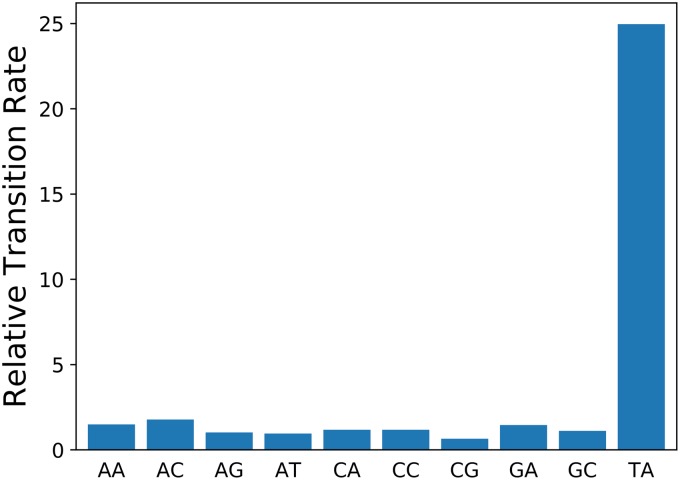
Hypermutation is also obvious for CCGG, again especially for one cluster with a relatively large number of changes (PDS000015357.38; the corresponding point is circled in Fig. 7). Examination of the contexts of the CCGG transitions in this cluster (Fig. 8 and Table S2) clearly suggests that the MTase specificity is RCCGGY. Examination of the reference genome for the cluster (NCBI RefSeq NZ_CP022489.1) reveals a single C-5 MTase (NCBI RefSeq WP_017441736.1) aside from Dcm. The numbers of RCCGGY transitions as a function of total changes are shown for clusters containing and lacking this MTase in Fig. S4. Clusters containing the MTase generally have higher rates of transition at these sites. Compared to other clusters (excluding those containing a second MTase discussed below) the rate is higher by a factor of 12.8 (11.5 to 14.2). Compared to other positions in the genome, it is higher by a factor of 15.7 (14.3 to 17.4).
FIG 8.
The relative rates of transition at CCGG positions with all possible pairs of flanking nucleotides in the Salmonella cluster PDS000015357.38. This cluster corresponds to the lower circled point in Fig. 5. “AT,” for example, refers to ACCGGT sites. Rates are calculated relative to other C·G base pairs in the genome. Complementary hexamers are combined, so that, for example, “AC” encompasses both ACCGGC and GCCGGT transitions. Thus, the three flanks with high relative rates together correspond exactly to RCCGGY sites.
This MTase is a perfect match to several proteins in REBASE (e.g., M.SenU1590ORF4570P). For all of these, and for all close matches, the specificity is listed as unknown. If, as seems likely, the observed hypermutation reflects the activity of this MTase, this finding represents a de novo determination of MTase specificity from mutation patterns alone.
It is apparent from Fig. S5 that some clusters that lack this MTase also have elevated transition rates at RCCGGY. The chromosome of the reference genome (NCBI RefSeq NZ_CP012833.1) for the cluster indicated by the arrow (PDS000003493.86) encodes a perfect match (NCBI RefSeq WP_023233677.1) to REBASE entry M.Sen58ORFBP, among others. The predicted specificity for these is GCCGGC, with the position of the modified base undetermined. Examination of the context of CCGG transitions in this cluster confirms that the specificity is GCCGGC (Fig. 8 and Table S3). The mutation pattern for GCCGGC is shown in Fig. S6, with clusters containing the GCCGGC-specific MTase shown in red and those containing the RCCGGY-specific MTase in cyan. Relative transition rates for the GCCGGC-specific MTase are 43.3 (35.4 to 52.7) compared to clusters lacking both MTases, and 48.5 (41.0 to 57.0) compared to other positions in the same genomes.
These two MTases thus both induce hypermutation, but to very different extents. It is apparent from Fig. S6 that even if we consider only GCCGGC, which is expected to be methylated by both MTases, the transition rate tends to be much lower for clusters containing the RCCGGY-specific MTase than for those containing the GCCGGC-specific MTase. This situation is similar to that for the two Campylobacter MTases analyzed above. The genomic context of the first (RCCGGY-specific) MTase gene may be relevant to the lower rate of transition.
Downstream of this gene is a gene encoding a protein containing two gyrase-Hsp90-histidine kinase-MutL (GHKL) ATP binding domains, followed by a gene for a hypothetical protein, and then a restriction endonuclease gene. The GHKL-containing protein (WP_017441735.1) is annotated, probably incorrectly, as a histidine kinase. A BLAST search of bacteria reveals that genes encoding relatives of this protein, some quite distant, are consistently associated with cytosine C-5 MTase genes. The association of certain genes encoding GHKL domain proteins with RM systems, and particularly with C-5 MTases, has been reported (18).
For some clusters, hypermutation is evident at GGCC. For most, this appears to be due to close relatives of REBASE entry M.SenWORF4408P, which is predicted to methylate GGCC. Analysis of flanking nucleotides (Fig. 9 and Table S4) suggests that the REBASE prediction is incorrect and the specificity is actually TGGCCA.
FIG 9.
The relative rates of transition at GGCC positions with all possible pairs of flanking nucleotides in Salmonella clusters containing MTase M.SenWORF4408P.
The hypermutation apparent at TCGA is due mainly to MTases that are close matches to REBASE entry M.SenLA9ORF19435P. This has a predicted recognition sequence of GTCGAC, with the modification position unknown. Analysis of the nucleotides flanking TCGA (Fig. S7 and Table S5) indicates that this prediction is incorrect. Hypermutation is strongest for CTCGAG, and also affects other sequences. This MTase may modify CTCGAG sites fully and partially methylate others, especially others of the form MTCGAK (M is A or C; K is T or G).
In the three obvious cases of clusters with only a small amount of hypermutation, only a minority of the isolates contain the MTase. These isolates occur mainly in large clades within the clusters. The terminal branches leading to these isolates were included in the flank analysis to increase power. The rate for CTCGAG nonetheless has a large uncertainty because it is a rare hexamer in Salmonella species.
The hypermutation evident for AGCT appears from flank analysis to be specific for SAGCTS (S is C or G). The effect is weak; approximately a factor of 5 for the most extreme clusters. A search for a responsible MTase did not find any candidates.
(ii) Pentanucleotide motifs in Salmonella.
A similar analysis can be done for palindromic pentanucleotide specificities. Mutational patterns for all 32 cases (taking the specificity for the central position to be either W or S) are shown in Fig. S8. These reveal additional signatures of MTase-induced hypermutation. The obvious cases do not reveal any previously unknown recognition sequences. They do, however, determine the modification position in two cases and will be described briefly.
The activity of M.SinI, which is analyzed above, is apparent in the plot for GGWCC. This plot is identical to the upper plot in Fig. 2, except for the lack of color coding. Mild hypermutation (about a factor of 2 increase) in M.SinI-containing clusters is evident for GGSCC, presumably indicating a small amount of off-target methylation of these sites by M.SinI. Low-level off-target methylation of AGWCT is also apparent for one cluster.
The obvious hypermutation at CCSGG sites is due to MTases closely related to REBASE entry M.Sen377ORF2975P, which is predicted to methylate CCNGG at an undetermined position. Thus, analysis of mutational patterns revealed the previously unknown position of methylation. The relevant clusters do not stand out in the plot for CCWGG, but this is expected, because all clusters are methylated at these sites by Dcm (note the high rates of transition for all clusters).
One cluster displays obvious hypermutation at both CTWAG and CTSAG. The reference sequence for this cluster (NCBI assembly GCA_000020705.1) contains a match to REBASE entry M.Sen66ORF100P, which is predicted to methylate GCTNAGC at an undetermined position. Analysis of the flanking nucleotides for CTNAG transitions confirms this specificity, and the pattern of hypermutation indicates that the position of the modified base is GCTNAGC.
DISCUSSION
Naturally occurring methylation-induced hypermutation was detected in every case examined. The increase in transition rate ranged from about a factor of 8 to a factor of 58. Hypermutation rates for the MTases analyzed are summarized in Table 1.
TABLE 1.
Summary of results for MTases analyzed
| Organism | Specificity | REBASE match | Relative rate (95% CI) compared to that of: |
|
|---|---|---|---|---|
| Same site without MTase | Other positions in genome | |||
| E. coli | CCWGG | M.EcoKDcm | 8.08 (7.84–8.32) | |
| Salmonella | CCWGG | M.StyLT2DcmP | 7.64 (7.53–7.75) | |
| Salmonella | GGWCC | M.SinI | 57.8 (51.6–64.7) | 53.3 (51.0–55.8) |
| Salmonella | RCCGGY | M.Sen35185ORF12517P | 21.3 (18.9–23.9) | 16.2 (14.5–18.0) |
| Listeria | GATC | M.LmoA7ORFAP, M.Lmo7956II | 16.7 (14.3–19.5) | 13.0 (12.0–14.2) |
| Campylobacter | GCGC | M.Cje11351ORF1151P | 25.1 (19.8–31.7) | 58.7 (47.2–72.3) |
| Campylobacter | WGCGCD? | M.Csp6878ORF3435P | 12.2 (10.9–19.0) | 27.8 (21.8–34.9) |
| Salmonella | RCCGGY | M.SenU1590ORF4570P | 12.8 (11.5–14.2) | 15.7 (14.3–17.4) |
| Salmonella | GCCGGC | M.Sen58ORFBP | 43.3 (35.4–52.7) | 48.5 (41.0–57.0) |
Elevation of mutation rates by Dcm methylation at CCWGG sites occurs in natural populations of enteric bacteria, not just in the laboratory. It has been hypothesized that Dcm hypermutation is for the most part a laboratory phenomenon, the result of unnaturally rapid growth in rich medium (5). Although it turns out not to be true, this hypothesis was quite plausible. In fact, it is somewhat surprising that Vsr-initiated repair does not prevent most mutation at Dcm sites in nature. Laboratory hypermutation appears to result from an insufficient concentration of Vsr. Although high levels of Vsr come at the cost of mutations at other sites, it would seem that optimal production of Vsr under natural conditions could eliminate most Dcm-induced mutations, as it does in nondividing cells. It is especially surprising that the magnitude of the effect in nature—approximately a factor of 8 increase in transition rate—is about as large as in rapidly growing cells in the laboratory. Since nondividing cells do not exhibit Dcm hypermutation, these results can be taken as evidence that E. coli and Salmonella cells do not spend so much time in a nondividing state that it dominates the mutational spectrum. Laboratory results are available only for rapidly dividing cells and cells that are not dividing at all, so it may be that slowly dividing cells exhibit significant hypermutation, perhaps as much as rapidly dividing cells. It is also conceivable that nondividing cells in nature differ from those studied in the laboratory in some way that makes them susceptible to hypermutation.
MTases associated with restriction systems were also found to lead to hypermutation. Because these MTases, unlike Dcm, are absent from most strains, they provide an opportunity for comparison of the same sites in the methylated and unmethylated states. This provides assurance that the observed high rate of mutation is actually due to methylation rather than being an effect of sequence context.
Two restriction-associated MTases analyzed in Salmonella species increased transition rates by factors of about 21 in one case and 58 in another. These hypermutation rates are much higher than that at Dcm sites. Presumably this reflects the fact that very short patch repair, initiated by Vsr, decreases the rate of transition at Dcm sites, whereas no analogous mechanism acts at the restriction-associated methylation sites. The large difference between the two restriction-associated rates may be due to sequence context effects on deamination rates or to the probability of repair.
In the genus Listeria, which is only distantly related to E. coli and Salmonella, two related MTases (∼50% amino acid identity) that apparently recognize the same sequence were found to induce hypermutation. Methylation increases transition rates by about a factor of 17.
In Campylobacter species, two MTases, only distantly related and found in different strains, apparently methylate GCGC sites. One of these MTases had previously unknown specificity, but its apparent specificity was identified by analysis of mutation patterns. As shown in the text in the supplemental material, the second MTase apparently has a narrower sequence specificity, perhaps WGCGCD. The second MTase illustrates how the action of an MTase can be detected from the signature of hypermutation without prior knowledge of its specificity or even of its existence.
Hypermutation would seem to be a significant cost associated with RM systems that employ cytosine C-5 methylation. This cost has obviously not prevented the proliferation of such systems, despite the possibility of employing nonmutagenic modifications, notably cytosine N-4 methylation, which can be applied to the same nucleotide residues. Some RM systems apparently mitigate this cost by including a homolog of the vsr gene (19). If the Dcm system is any indication, this remedy is likely to be only partially effective. In any case, the existence of these genes serves as evidence of a nonnegligible fitness cost of hypermutation.
The ease of inferring previously unknown MTase specificities from patterns of mutation was demonstrated for an example in the genus Salmonella. An MTase with unknown specificity was shown to most probably methylate RCCGGY sites. In addition, in two cases the recognition sequence predicted by REBASE was provisionally shown to be incorrect, and in several cases the previously unknown position of methylation within the recognition sequence was determined on the basis of which C in the sequence exhibited hypermutation.
This demonstration made use of a graphical approach to identifying clusters with MTase-induced hypermutation. This approach is valuable for the purpose of illustration, but it is not a necessity for determining MTase specificities. Analysis of the mutational patterns in clusters containing an MTase of interest should provide information about its specificity, provided that the total tree length is sufficiently large, even if hypermutation is not obvious from plots such as Fig. 7 and S7.
The approach also involved comparisons of MTase-containing strains to relatives lacking the MTase. Such comparisons have the virtue of accounting for context effects, provided that these effects do not differ greatly between the two groups. This advantage is important for quantifying the factor by which methylation increases the transition rate, but it is likely dispensable for determination of MTase specificity. The specificity of Dcm, for example, was evident in the pattern of mutation despite the lack of an MTase-negative comparison. In fact, Fig. 1 shows that even the effect of Dcm—the weakest of the hypermutation effects observed—far outweighs context effects. Determination of flanking nucleotide specificities, illustrated in Fig. 8 and 9, was also based only on MTase-containing strains.
In two cases—one in Salmonella and the other in Campylobacter—two MTases lead to very different amounts of hypermutation at sites that are apparently methylated by both. None of the MTases involved are associated with close homologs of Vsr. Incomplete methylation is an unlikely explanation for the Salmonella discrepancy because the MTase leading to the lower transition rate is apparently associated with a restriction endonuclease. The Salmonella and Campylobacter MTases with the lower transition rates share a notable feature: the genes for both are immediately followed by genes encoding proteins containing GHKL ATP binding domains. Certain proteins containing GHKL domains are usually associated with RM systems, most often with cytosine C-5 MTases (18). They are related to mismatch repair proteins, such as MutL (18). A role for these proteins in mitigating MTase-induced hypermutation, generally analogous to that of Vsr, could explain the puzzling transition rate results. It would also explain the tendency of these GHKL proteins to be associated with cytosine C-5 MTases and not with adenine N-6 or cytosine N-4 MTases. Some of these proteins (e.g., HgiDII; see reference 20) are known to be restriction enzymes, but an additional role in preventing mutations is possible and might explain the presence of an ATP binding domain in a type II restriction enzyme. Note in this regard that the GHKL-containing enzyme HgiDII exhibits restriction endonuclease activity in the absence of added ATP (20).
Methylation-induced hypermutation was observed in two enteric bacteria (members of the Gammaproteobacteria) and in the two distantly related bacterial genera examined, namely, Campylobacter, a member of the Epsilonproteobacteria, and Listeria, a Gram-positive bacterial genus. It therefore seems likely to be a general phenomenon among bacteria. The mutational signature of cytosine C-5 methylation can be used to infer or confirm methylation patterns and MTase specificities.
MATERIALS AND METHODS
Data.
Raw data were obtained from the NCBI Pathogen Detection project (https://www.ncbi.nlm.nih.gov/pathogens/) and are archived at ftp://ftp.ncbi.nlm.nih.gov/pub/jcherry/methylation_hypermutation/. In this data set, each taxon (species or genus) is divided into clusters of very closely related isolates; the largest distances within a cluster are fewer than 250 nucleotide differences, out of more than one million to several million nucleotides analyzed. Clusters range in size from two to several thousand isolates. Those with fewer than five isolates were not included in the analysis. Single-nucleotide polymorphism (SNP) information is provided for each cluster, along with a phylogenetic tree built from it using a maximum compatibility algorithm (21). The SNP information includes locations on the genome assembly, which allowed the sequence context to be determined.
The build runs used for analysis were PDG000000004.864 (E. coli, including Shigella), PDG000000002.1069 (Salmonella), PDG000000001.829 (Listeria), and PDG000000003.527 (Campylobacter). Mutation data (including sequence context), along with Python code for performing the analyses presented here, are available at ftp://ftp.ncbi.nlm.nih.gov/pub/jcherry/methylation_hypermutation/.
Reconstruction of DNA sequence changes.
For each cluster, changes in sequence were inferred by a most-parsimonious reconstruction on the tree after midpoint rooting, using a “soft” treatment of multifurcations (22). Where the most-parsimonious reconstruction was ambiguous, usually due to ambiguity characters in the sequence data, a single reconstruction was chosen. Altering the details of the reconstruction method did not change the results substantially. Changes occurring on the branches descending directly from the root were excluded from the analysis because of the impossibility of determining their polarity.
Calculation of relative transition rates at methylated sites.
To estimate the rate at methylated sites relative to that at nonmethylated sites in the same genome, the ratio of the observed number of C/G→T/A transitions at the two types of sites was divided by the ratio of the numbers of such sites in the genome. The latter ratio varies slightly among isolates, so a weighted average of its values among the reference sequences for the clusters was used, with the weight equal to the total number of sequence changes observed for the cluster. For computation of a confidence interval, transitions at both types of site were taken to be Poisson random variables. Conditional on the total, the apportionment between methylated and nonmethylated sites is then given by a binomial distribution. The R function binom.test returns confidence limits for the binomial fraction that are easily transformed to limits for the relative rate.
The relative rate at potentially methylated sites in the presence and absence of MTase genes was calculated from the numbers of transitions at these sites and other sequence changes in the two types of clusters, along with the target site frequencies in the two types of genomes. The relative rate was given by the formula
where S is the number of transitions at methylation target sites, O is the number of other sequence changes, F is the ratio of MTase target positions to other positions in the genome (calculated as a weighted average, as described above), and the subscripts m and 0 indicate clusters with and without MTase, respectively. The denominator—essentially the ratio of site frequencies in genomes containing and lacking MTase—ranged from very slightly greater than 1 to appreciably less than 1, the latter presumably because hypermutation leads to loss of methylation sites. Confidence intervals for the numerator were calculated with the R function fisher.test, and the bounds were divided by the denominator to give confidence intervals for the relative rate.
Supplementary Material
ACKNOWLEDGMENTS
This research was supported by the Intramural Research Program of the NIH, National Library of Medicine.
Footnotes
Supplemental material for this article may be found at https://doi.org/10.1128/JB.00371-18.
REFERENCES
- 1.Jurkowska RZ, Jeltsch A. 2016. Mechanisms and biological roles of DNA methyltransferases and DNA methylation: from past achievements to future challenges. Adv Exp Med Biol 945:1–17. doi: 10.1007/978-3-319-43624-1_1. [DOI] [PubMed] [Google Scholar]
- 2.Coulondre C, Miller JH, Farabaugh PJ, Gilbert W. 1978. Molecular basis of base substitution hotspots in Escherichia coli. Nature 274:775–780. doi: 10.1038/274775a0. [DOI] [PubMed] [Google Scholar]
- 3.Bird AP. 1980. DNA methylation and the frequency of CpG in animal DNA. Nucleic Acids Res 8:1499–1504. doi: 10.1093/nar/8.7.1499. [DOI] [PMC free article] [PubMed] [Google Scholar]
- 4.Cooper DN, Youssoufian H. 1988. The CpG dinucleotide and human genetic disease. Hum Genet 78:151–155. doi: 10.1007/BF00278187. [DOI] [PubMed] [Google Scholar]
- 5.Lutsenko E, Bhagwat AS. 1999. Principal causes of hot spots for cytosine to thymine mutations at sites of cytosine methylation in growing cells. A model, its experimental support and implications. Mutat Res 437:11–20. doi: 10.1016/S1383-5742(99)00065-4. [DOI] [PubMed] [Google Scholar]
- 6.Gomez-Eichelmann MC, Levy-Mustri A, Ramirez-Santos J. 1991. Presence of 5 methylcytosine in CC(A/T)GG sequences (Dcm methylation) in DNAs from different bacteria. J Bacteriol 173:7692–7694. doi: 10.1128/jb.173.23.7692-7694.1991. [DOI] [PMC free article] [PubMed] [Google Scholar]
- 7.Sohail A, Lieb M, Dar M, Bhagwat AS. 1990. A gene required for very short patch repair in Escherichia coli is adjacent to the DNA cytosine methylase gene. J Bacteriol 172:4214–4221. doi: 10.1128/jb.172.8.4214-4221.1990. [DOI] [PMC free article] [PubMed] [Google Scholar]
- 8.Hennecke F, Kolmar H, Bründl K, Fritz HJ. 1991. The vsr gene product of E. coli K-12 is a strand and sequence specific DNA mismatch endonuclease. Nature 353:776–778. doi: 10.1038/353776a0. [DOI] [PubMed] [Google Scholar]
- 9.Gabbara S, Wyszynski M, Bhagwat AS. 1994. A DNA repair process in Escherichia coli corrects U:G and T:G mismatches to C:G at sites of cytosine methylation. Mol Gen Genet 243:244–248. [DOI] [PubMed] [Google Scholar]
- 10.Lieb M, Rehmat S. 1997. 5-Methylcytosine is not a mutation hot spot in nondividing Escherichia coli. Proc Natl Acad Sci U S A 94:940–945. doi: 10.1073/pnas.94.3.940. [DOI] [PMC free article] [PubMed] [Google Scholar]
- 11.Lieb M, Bhagwat AS. 1996. Very short patch repair: reducing the cost of cytosine methylation. Mol Microbiol 20:467–473. doi: 10.1046/j.1365-2958.1996.5291066.x. [DOI] [PubMed] [Google Scholar]
- 12.Sánchez-Romero MA, Cota I, Casadesús J. 2015. DNA methylation in bacteria: from the methyl group to the methylome. Curr Opin Microbiol 25:9–16. doi: 10.1016/j.mib.2015.03.004. [DOI] [PubMed] [Google Scholar]
- 13.Bandaru B, Wyszynski M, Bhagwat AS. 1995. HpaII methyltransferase is mutagenic in Escherichia coli. J Bacteriol 177:2950–2952. doi: 10.1128/jb.177.10.2950-2952.1995. [DOI] [PMC free article] [PubMed] [Google Scholar]
- 14.Lupker HS, Dekker BM. 1981. Purification of the sequence specific endonuclease SinI from Salmonella infantis. Biochim Biophys Acta 654:297–299. doi: 10.1016/0005-2787(81)90185-4. [DOI] [PubMed] [Google Scholar]
- 15.Roberts RJ, Vincze T, Posfai J, Macelis D. 2015. REBASE—a database for DNA restriction and modification: enzymes, genes and genomes. Nucleic Acids Res 43:D298–D299. doi: 10.1093/nar/gku1046. [DOI] [PMC free article] [PubMed] [Google Scholar]
- 16.Zheng W, Kathariou S. 1997. Host-mediated modification of Sau3AI restriction in Listeria monocytogenes: prevalence in epidemic associated strains. Appl Environ Microbiol 63:3085–3089. [DOI] [PMC free article] [PubMed] [Google Scholar]
- 17.Yildirim S, Elhanafi D, Lin W, Hitchins AD, Siletzky RM, Kathariou S. 2010. Conservation of genomic localization and sequence content of Sau3AI-like restriction modification gene cassettes among Listeria monocytogenes epidemic clone I and selected strains of serotype 1/2a. Appl Environ Microbiol 76:5577–5584. doi: 10.1128/AEM.00648-10. [DOI] [PMC free article] [PubMed] [Google Scholar]
- 18.Iyer LM, Abhiman S, Aravind L. 2008. MutL homologs in restriction modification systems and the origin of eukaryotic MORC ATPases. Biol Direct 3:8. doi: 10.1186/1745-6150-3-8. [DOI] [PMC free article] [PubMed] [Google Scholar]
- 19.Bickle TA, Krüger DH. 1993. Biology of DNA restriction. Microbiol Rev 57:434–450. [DOI] [PMC free article] [PubMed] [Google Scholar]
- 20.Kröger M, Hobom G, Schütte H, Mayer H. 1984. Eight new restriction endonucleases from Herpetosiphon giganteus—divergent evolution in a family of enzymes. Nucleic Acids Res 12:3127–3141. doi: 10.1093/nar/12.7.3127. [DOI] [PMC free article] [PubMed] [Google Scholar]
- 21.Cherry JL. 2017. A practical exact maximum compatibility algorithm for reconstruction of recent evolutionary history. BMC Bioinformatics 18:127. doi: 10.1186/s12859-017-1520-4. [DOI] [PMC free article] [PubMed] [Google Scholar]
- 22.Maddison W. 1989. Reconstructing character evolution on polytomous cladograms. Cladistics 5:365–377. doi: 10.1111/j.1096-0031.1989.tb00569.x. [DOI] [PubMed] [Google Scholar]
Associated Data
This section collects any data citations, data availability statements, or supplementary materials included in this article.


