

Antimalarial treatment currently relies on an artemisinin derivative and a longer-acting partner drug. With the emergence of resistance to the artemisinin derivatives and the potential pressure this exerts on the partner drugs, the impact of resistance to each drug on efficacy needs to be investigated.
KEYWORDS: antimalarial combination therapy, artemisinin resistance, malaria, partner drug resistance, pharmacokinetic-pharmacodynamic modeling, within-host modeling
ABSTRACT
Antimalarial treatment currently relies on an artemisinin derivative and a longer-acting partner drug. With the emergence of resistance to the artemisinin derivatives and the potential pressure this exerts on the partner drugs, the impact of resistance to each drug on efficacy needs to be investigated. An in silico exploration of dihydroartemisinin-piperaquine and mefloquine-artesunate, two artemisinin-based combination therapies that are commonly used in Southeast Asia, was performed. The percentage of treatment failures was simulated from a within-host pharmacokinetic-pharmacodynamic (PKPD) model, assuming that parasites developed increasing levels of (i) artemisinin derivative resistance or (ii) concomitant resistance to both the artemisinin derivative and the partner drug. Because the exact nature of how resistant Plasmodium falciparum parasites respond to treatment is unknown, we examined the impact on treatment failure rates of artemisinin resistance that (i) reduced the maximal killing rate, (ii) increased the concentration of drug required for 50% killing, or (iii) shortened the window of parasite stages that were susceptible to artemisinin derivatives until the drugs had no effect on the ring stages. The loss of the ring-stage activity of the artemisinin derivative caused the greatest increase in the treatment failure rate, and this result held irrespective of whether partner drug resistance was assumed to be present or not. To capture the uncertainty regarding how artemisinin derivative and partner drug resistance affects the assumed concentration-killing effect relationship, a variety of changes to this relationship should be considered when using within-host PKPD models to simulate clinical outcomes to guide treatment strategies for resistant infections.
INTRODUCTION
Approximately 200 million clinical cases of malaria are treated globally each year (1). The World Health Organization (WHO) currently recommends artemisinin-based combination therapies (ACTs) as the first-line treatment for Plasmodium falciparum malaria (2). ACTs consist of an artemisinin derivative, artesunate (ARS), artemether, or dihydroartemisinin (DHA), coformulated with a partner drug, typically mefloquine (MQ) (or amodiaquine), lumefantrine, or piperaquine (PQ), respectively. Artemisinin derivatives are the most effective antimalarial agents available, rapidly clearing most parasites from the body. However, these drugs are quickly eliminated (within 12 h), necessitating the coadministration of a long-acting partner drug to kill the remaining parasites.
Artemisinin resistance has emerged and spread within Southeast Asia, first in western Cambodia and now throughout the Greater Mekong Subregion (3, 4). The artemisinin resistance phenotype, with a delay in parasite clearance, has been found to be associated with mutations in the P. falciparum Kelch protein on chromosome 13 (K13 mutation) (5). It has been proposed that these mutations are linked to a loss of ring-stage antimalarial activity (6–9). As a consequence of artemisinin resistance, a greater number of parasites survive the early stage of treatment, exerting pressure on the partner drug and ultimately leading to partner drug resistance and a decline in the efficacy of ACTs (10, 11).
Faced with increasing resistance to both artemisinin derivatives and the partner drugs, it is imperative that we explore the possible clinical consequences of resistance. Pharmacokinetic-pharmacodynamic (PKPD) models characterize the relationship between the antimalarial drug concentrations in the blood (pharmacokinetic [PK]) and the changes in the number of parasites (pharmacodynamic [PD]) within an individual host over time (12). These models provide the ideal framework to investigate how parasitological outcomes change as parasites become more (or completely) resistant to the artemisinin derivatives and/or the partner drugs.
Artemisinin resistance and partner drug resistance have previously been investigated in a simulation PKPD modeling framework (13, 14). Winter and Hastings (13) found that increasing the 50% effective concentration (EC50) of the artemisinin derivative places greater pressure on the partner drug and, if resistance to the partner drug is already present (defined as an increase in the EC50), greatly affects the clinical efficacy of ACTs. In the study by Zaloumis et al. (14), similar patterns were found; the proportion clinically cured for each of the ACTs examined was highly sensitive to the EC50 and maximal killing rate (kmax) of the partner drug.
Saralamba et al. (8) and Hoshen et al. (15) developed within-host PKPD models for ARS that include the aging of parasites within red blood cells, allowing the drug to act on different stages of the erythrocytic parasite life cycle, i.e., rings (parasites aged 1 to 26 h), trophozoites (parasites aged 27 to 38 h), or schizonts (parasites aged 39 to 48 h). Zaloumis et al. (14) expanded on the model described by Saralamba et al. (8) to accommodate the PK and PD of both the artemisinin derivative and the partner drug, to simulate outcomes for individuals receiving ACTs. Hodel et al. (16) compared a continuous-time model that did not accommodate the different stages of the parasite life cycle to a discrete-time model that did, and they found that the numbers of parasites predicted from each model deviated over time, which could have an impact on the predicted therapeutic outcome for short-half-life drugs with stage-specific killing (i.e., artemisinin derivatives).
To date, studies have assessed the impact of artemisinin resistance only when it is modeled as a change in EC50 or kmax and the broad-stage activity on parasites aged 6 to 44 h (17) is maintained; studies have not considered that artemisinin resistance is likely to change the parasite stages that are susceptible to the drug, i.e., it may reduce the broad-stage activity or, equivalently, shorten the killing window of artemisinin from 6 to 44 h to 12 to 44 h, as an example. In this study, we used the model described by Zaloumis et al. (14) to compare the impact (percentages of treatment failures) on the efficacy of DHA-PQ and ARS-MQ when artemisinin resistance is stage specific. First, we examined the impact on percentages of treatment failures of artemisinin resistance that (i) reduced the kmax, (ii) increased the EC50, or (iii) shortened the window of parasite stages that were susceptible to artemisinin derivatives until they had no effect on the ring stages. In addition, we explored the impact of artemisinin resistance on treatment failure changes in the presence of partner drug resistance. Our modeling provides insight into how simulated clinical outcomes compare between artemisinin derivative resistance that does not alter the killing window and stage-specific artemisinin derivative resistance that does alter the killing window.
RESULTS
We begin by examining how the percentage of treatment failures for the artemisinin combination therapies DHA-PQ and ARS-MQ varied with (i) artemisinin derivative resistance (Fig. 1) and (ii) concomitant artemisinin derivative and partner drug resistance (Fig. 2). In Fig. 1 and 2, changes in the parasite sensitivity to the artemisinin derivative are represented by increasing the EC50 from 1 to 128 ng/ml, decreasing the fold reduction (natural log scale) in parasites per hour of treatment (kmax) from 0.47 to 0.27 h−1, and shortening the artemisinin derivative killing window from parasites aged 6 to 44 h to parasites aged 26 to 44 h, so that the derivative had no effect on ring-stage parasites. For the simulations exploring concomitant resistance (Fig. 2), partner drug resistance is represented by increasing the EC50 of PQ from 25 ng/ml to 60 ng/ml and that of MQ from 280 ng/ml to 770 ng/ml. The contours (z axis) in Fig. 1 and 2 are the percentages of 1,000 hypothetical patients who experienced treatment failure during a 63-day follow-up period, i.e., simulated parasitemia either never fell below or reappeared above the microscopic limit of detection (50 parasites/μl of blood) during 63 days of follow-up monitoring. The parameters of the within-host PKPD model are defined in Table 1, and further details regarding the construction of the contour plots in Fig. 1 and 2 are provided in Materials and Methods.
FIG 1.
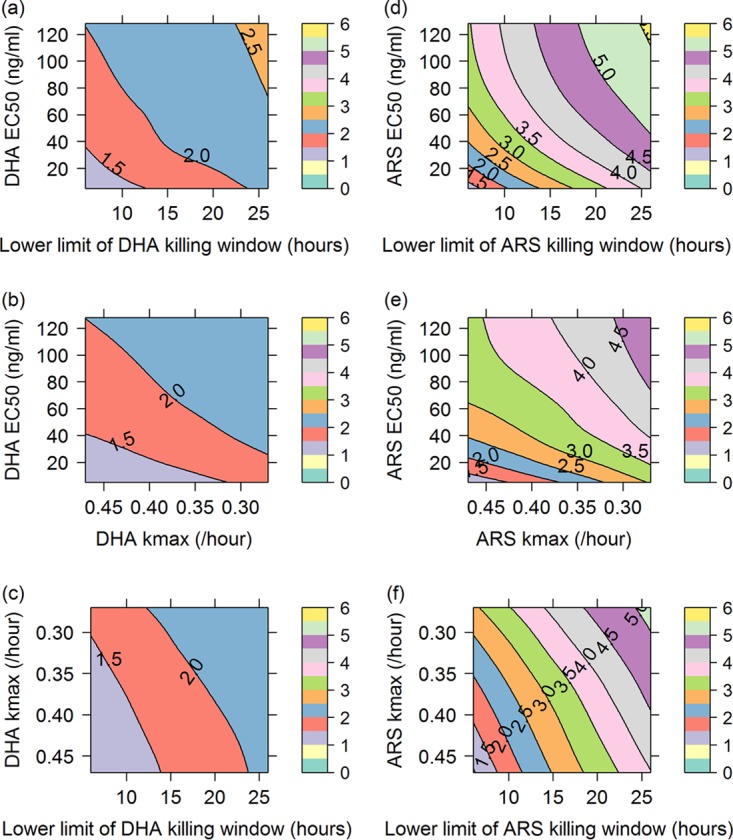
Contour plots showing percentages of treatment failures (contour lines and color scale) for DHA-PQ (a to c) and ARS-MQ (d to f), resulting from increasing the EC50 of the artemisinin derivative and shortening its killing window (a and d); increasing the EC50 of the artemisinin derivative and decreasing its kmax (b and e); or decreasing the kmax of the artemisinin derivative and shortening its killing window (c and f). DHA profiles were simulated for ARS, since DHA is the primary active metabolite of ARS and ARS is considered the prodrug.
FIG 2.
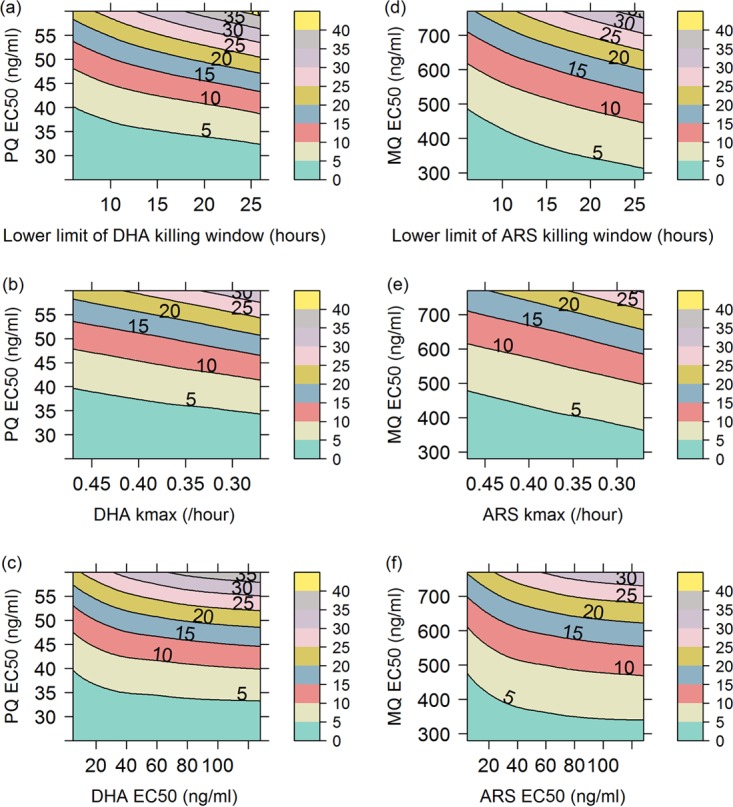
Contour plots showing percentages of treatment failures (contour lines and color scale) for DHA-PQ (a to c) and ARS-MQ (d to f), resulting from increasing the EC50 of the partner drug (y axis in all plots) and shortening the killing window of the artemisinin derivative (a and d); decreasing the kmax of the artemisinin derivative (b and e); or increasing the EC50 of the artemisinin derivative (c and f). DHA profiles were simulated for ARS, since DHA is the primary active metabolite of ARS and ARS is considered the prodrug.
TABLE 1.
Parameter definitions for the within-host PKPD model
| Parameter | Description |
|---|---|
| IPL | Initial parasite load of the patient on admission |
| μIPL | Mean of age distribution of the initial parasite load (hours) |
| σIPL | Standard deviation of age distribution of the initial parasite load (hours) |
| PMF | Parasite multiplication factor (per 48-h cycle) |
| kmax | Maximal killing rate of the drug (hour−1) |
| γ | Slope of the in vivo concentration-effect curve |
| EC50 | In vivo concentration at which the killing rate is 50% of the maximum (nanograms per milliliter) |
| Killing window | Ages in the parasite life cycle within the red blood cell that the drug can kill (hours) |
Artemisinin derivative resistance.
For DHA-PQ and ARS-MQ, the percentage of treatment failures stayed below 3% and 6%, respectively, for all combinations of artemisinin derivative resistance investigated (i.e., increasing EC50, decreasing kmax, and shortening the killing window to action against trophozoites only). The percentage of treatment failures for ARS-MQ increased more rapidly as artemisinin resistance increased, compared with DHA-PQ (note the larger spacing between contour lines in Fig. 1a to c than in Fig. 1d to f), most likely due to MQ having a lower parasite reduction ratio (PRR) than PQ (see Fig. S1 in the supplemental material).
For both ACTs, the highest percentage of treatment failures occurred when shortening of the artemisinin derivative killing window was combined with an increase in the EC50 (see the orange region in Fig. 1a for DHA-PQ and the yellow region in Fig. 1d for ARS-MQ). The percentages of treatment failures at the highest degree of artemisinin resistance explored in each contour plot did not vary considerably among the combinations of artemisinin derivative resistance examined (Table 2).
TABLE 2.
Highest percentage of treatment failures for each combination of artemisinin derivative resistance and concomitant resistance
| Resistance mechanisms | % of treatment failuresa |
|
|---|---|---|
| DHA-PQ | ARS-MQ | |
| Artemisinin derivative resistance | ||
| Artemisinin derivative EC50 (DHA EC50 of >80 ng/ml and ARS EC50 of >110 ng/ml) and shortened killing window (26–44 h) | 3 | 6 |
| Artemisinin derivative EC50 (DHA EC50 of >40 ng/ml and ARS EC50 of >80 ng/ml) and kmax (<0.3 h−1) | 2.5 | 5 |
| Artemisinin derivative kmax (DHA kmax of <0.45 h−1 and ARS kmax of <0.30 h−1) and shortened killing window (26–44 h) | 2.5 | 5.5 |
| Concomitant resistance | ||
| Partner drug EC50 (PQ EC50 of >57 ng/ml and MQ EC50 of >750 ng/ml) and artemisinin derivative shortened killing window (26–44 h) |
45 | 40 |
| Partner drug EC50 (PQ EC50 of >57 ng/ml and MQ EC50 of >750 ng/ml) and artemisinin derivative kmax (DHA kmax of <0.30 and ARS kmax of <0.30 h−1) |
35 | 30 |
| Partner drug EC50 (PQ EC50 of >57 ng/ml and MQ EC50 of >750 ng/ml) and artemisinin derivative EC50 (DHA EC50 of >70 ng/ml and ARS EC50 of >60 ng/ml) |
40 | 35 |
ARS, artesunate; DHA, dihydroartemisinin; MQ, mefloquine; PQ, piperaquine.
Concomitant resistance.
Figure 2 shows how the percentages of treatment failures varied as the EC50 increased, the kmax decreased, and killing window was shortened for the artemisinin derivatives DHA and ARS and the EC50 increased for the partner drugs PQ and MQ. For both ACTs, the contour plots indicate that, in the presence of partner drug resistance, shortening the killing window for the artemisinin derivative caused a more rapid increase in the percentage of treatment failures than did decreasing the kmax or increasing the EC50 of the artemisinin derivative (note the smaller spacing between contour lines in Fig. 2a versus Fig. 2b and c for DHA-PQ and Fig. 2d versus Fig. 2e and f for ARS-MQ). The percentage of treatment failures increased faster with increasing EC50 than with decreasing kmax in the presence of partner drug resistance. The contours decline rapidly with lower artemisinin derivative EC50 values, levelling off when the EC50 reaches 20 to 30 ng/ml (Fig. 2c and f). In contrast, the decline with the artemisinin derivative kmax is relatively constant over the range of kmax values examined (Fig. 2b and e).
The percentages of treatment failures at the highest degree of artemisinin derivative and partner drug resistance explored in each contour plot varied by approximately 5% (Table 2). ARS-MQ maintained a lower percentage of treatment failures than did DHA-PQ over the ranges and combinations of artemisinin derivative and partner drug resistance explored for each ACT (Table 2). The PK profile of PQ may make the DHA-PQ regimen more susceptible to artemisinin derivative resistance as it becomes less effective, i.e., the EC50 increases (Fig. S2).
Figures S3 and S4 are duplicates of Fig. 1 except with the EC50 values for PQ and MQ increased by 50% or 100%. Figures S3 and S4 indicate that, if partner drug resistance was already present, then the percentage of treatment failures increased even when there was no increase or a small increase in artemisinin derivative resistance (aqua regions in Fig. S3a to c and S4a to c disappear in Fig. S3d to i and Fig. S4d to i, where the EC50 of the partner drug was increased by 50% or 100%). The percentage of treatment failures also increased more rapidly as the partner drug efficacy decreased (the spacing between contour lines becomes increasingly smaller going from Fig. S3a to c and Fig. S4a to c to Fig. S3d to f and Fig. S4d to f and then to Fig. S3g to i and Fig. S4g to i).
DISCUSSION
Our simulation study suggests that, in regions in which partner drug resistance has not yet emerged, the percentage of treatment failures is largely insensitive to artemisinin resistance. Furthermore, our study suggests that the form in which artemisinin resistance is modeled (reduction in ring-stage activity, decrease in maximal killing effect, or increase in the concentration required to kill 50% of parasites) is of minor importance in the absence of partner drug resistance. However, if there is evidence of concomitant resistance to both drugs in an ACT emerging in a region, then the hypothesized forms of resistance are important. The percentage of treatment failures increases rapidly, with the most rapid increase being when partner drug resistance occurs with ring-stage artemisinin resistance. These findings concur with DHA-PQ failure rates across Cambodia in 2012 to 2013. DHA-PQ failure rates of 11%, 34%, and 77% in Ratanakiri, Preah Vihear, and Pursat, respectively, correspond to increasing prevalence of the molecular markers for artemisinin resistance (K13 genotype, 2%, 16%, and 46%, respectively) and PQ resistance (exo-E415G, 0%, 12%, and 59%; plasmepsin, 0%, 3%, and 64%, respectively) (18). PCR-adjusted ARS-MQ cure rates on the Thai-Myanmar border declined from 100% in 2003 to 81.1% in 2013 as the proportion of P. falciparum isolates with multiple pfmdr1 copies doubled from 32.4% to 64.7% and those with K13 mutations increased from 6.7% to 83.4% (19).
A strength of this simulation study is that between-subject variability was included, so that the hypothetical patients varied in terms of drug absorption and exposure, as observed in antimalarial PK studies (20), and in terms of parasite load and proportions of parasites that were rings, trophozoites, and schizonts at the time of treatment, as observed in clinical studies (21). In detail, between-subject variability was added to the following parameters: initial parasite load and parasite age distribution, to produce variability in the severity and synchronicity of the infection prior to treatment; and PK parameters. Furthermore, the estimates of between-subject variability for the initial parasite load and the PK parameters were based on published values from clinical efficacy and PK studies (22–24). Additional strengths are that the parameter distributions used to simulate the parasitemia profiles of the hypothetical patients were derived from in vitro data and clinical studies and a discrete-time model was used to simulate treatment outcomes for combination therapies comprising the short-half-life and stage-specific artemisinin derivatives (8, 14, 16).
The within-host PKPD model does not account for host immunity and any interaction between the PK and PD of the artemisinin derivative and the partner drug. In the study by Ataide et al. (25), immunity was found to reduce the parasite clearance half-life by only 30 min, suggesting that immunity would have little impact on our results. For the ACTs investigated, there is evidence in the literature that the PK and PD interactions between DHA and the partner drugs PQ and MQ are minimal (26), thereby justifying our model assumption of no interactions between the drugs. The steeper increase in percentage of treatment failures at low EC50 values for the artemisinin derivatives was sensitive to the shape of the DHA PK curve at low concentrations. Because not much is known about the shape of the curve near the quantification limit of DHA (around 2 ng/ml), the prediction of the percentage of treatment failures at low artemisinin derivative EC50 values may not be reliable.
Within the past 5 years, significant advances in the understanding of the biochemical pathways disrupted by K13 mutations and how artemisinin resistance alters the parasite life cycle have been made (10, 11, 27, 28). However, only a limited number of possible parasite resistance responses, e.g., increasing either the artemisinin derivative or partner drug EC50, decreasing the maximal killing effect of the artemisinin derivative, and shortening the killing window of the artemisinin derivative, were explored in this study. Future work aims to investigate more complex potential resistance mechanisms using a recently developed PKPD model that accounts for drug accumulation effects (29). This model has been validated only with in vitro experimental data designed to elucidate the artemisinin drug action (6, 7), and more information is required to inform some of the parameters for the in vivo setting.
Coexistent resistance of the artemisinin derivatives and the partner drugs PQ and MQ predicted rapid increases in the percentage of treatment failures, agreeing with observed increases in DHA-PQ failure rates in Ratanakiri, Preah Vihear, and Pursat, Cambodia, and declines in ARS-MQ cure rates at the Thai-Myanmar border. There is in vitro evidence that changes in the ring-stage activity are associated with artemisinin resistance (30); however, we found only marginal differences in the increase in percentage of treatment failures among the three mechanisms of artemisinin resistance investigated (with minimally worse outcomes for complete artemisinin resistance in the ring stage of the life cycle). The precise mechanism of in vivo artemisinin resistance remains unknown, although a population transcriptomic study suggested one possible molecular pathway (31, 32). To date, model-based (in silico) studies have explored only a limited number of possible mechanisms of artemisinin resistance, i.e., changes in the assumed concentration-killing effect relationship. Accordingly, we recommend considering a range of artemisinin resistance mechanisms (possibly focusing more on stage-specific responses) when using within-host PKPD models to inform dosing strategies to expand the life span of the current suite of ACTs.
MATERIALS AND METHODS
We used a published within-host PKPD model for P. falciparum malaria (14) to generate the parasitological outcomes, following treatment with DHA-PQ or ARS-MQ, displayed in the contour plots of Fig. 1 and 2. The following describes the x and y axis selection (referred to as grid selection) for the contour plots in Fig. 1 and 2 and details how the contours (z axis) were generated for each (x,y) coordinate. Three parameters of the within-host PKPD model (EC50, kmax, and killing window) were varied to represent increasing levels of (i) artemisinin resistance and (ii) concomitant artemisinin and partner drug resistance. All three mechanisms were explored to see how a stage-specific artemisinin resistance mechanism (i.e., shortening the killing window) would compare to how resistance had been modeled previously in silico (i.e., as a broad-stage effect by varying kmax and EC50) (13, 14) and to investigate how the impacts on therapeutic efficacy may vary in vivo.
Grid (x and y axis) selection.
The x and y axis values used to produce Fig. 1 and 2 are given in Table 3. The lower limit for the EC50 values specified in Table 3 for DHA and PQ (5 ng/ml and 25 ng/ml, respectively) are based on 50% inhibitory concentrations (IC50) from ex vivo experiments with fresh P. falciparum isolates collected from Oddar Meancheay Province, Cambodia, in 2013 (33). The IC50 values reported were 2.0 ng/ml for DHA and 21.0 ng/ml for PQ, and those values were multiplied by a free drug scalar, derived from plasma protein binding data reported by Zaloumis et al. (14) (scalar for DHA, 2.7; scalar for PQ, 1.22), to derive the lower limits of 5 ng/ml and 25 ng/ml reported in Table 3 for DHA and PQ, respectively. The upper EC50 for DHA (128 ng/ml) is approximately 12% of the maximal concentration (Cmax) (Cmax = 1,064 ng/ml) of the population average PK profile simulated based on the PK parameter estimates in Table 4 for DHA/ARS. Roughly doubling the EC50 between 5 and 128 ng/ml produces the EC50 values in Table 3 for DHA. For PQ, the upper EC50 of 60 ng/ml resulted in a median percentage of clinically cured cases of approximately 70 to 80% in the report by Zaloumis et al. (14), and 16 equally spaced values between 25 ng/ml and 60 ng/ml were selected. The kmax values for DHA were selected based on the PRR for DHA of 105.28 (3). The upper limit of 0.47 h−1 is equivalent to a 50-fold increase in the PRR (105.28 × 50), and the lower limit of 0.27 h−1 is equivalent to a 50-fold decrease in the PRR (105.28/50) (see Table 5 for the equation describing the relationship between kmax and PRR). Eleven equally spaced values between 0.47 and 0.27 h−1 were selected. The killing window for DHA was varied from 6 to 44 h to 26 to 44 h of the intraerythrocytic parasite life cycle by increasing the lower limit of the window in 2-h increments, which resulted in 11 killing windows to be evaluated. Because DHA is the active metabolite of ARS, the grid values described above for DHA EC50, DHA kmax, and shortening of the DHA killing window were used for ARS. The lower limit for the PQ EC50 is approximately 13% of the Cmax (Cmax = 188 ng/ml) from the population average PK profile simulated based on the PK parameter estimates in Table 4. Accordingly, the lower limit for the MQ EC50 of 280 ng/ml is approximately 13% of the Cmax (Cmax = 2174 ng/ml) from the population average PK profile. Sixteen equally spaced values between 280 ng/ml and 770 ng/ml were selected.
TABLE 3.
| Parameter (fixed/varied) | Value(s) | Figure(s) |
|---|---|---|
| DHA/ARS grid points | ||
| EC50 (ng/ml) | ||
| Varied | 5, 8, 12, 16, 20, 24, 28, 32, 40, 48, 56, 64, 80, 96, 112, or 128 | 1a, b, d, and e, y axis; 2c and f, x axis |
| Fixed | 5 | 1c and f; 2a, b, d, and e |
| kmax (h−1) | ||
| Varied | 0.47, 0.45, 0.43, 0.41, 0.39, 0.37, 0.35, 0.33, 0.31, 0.29, or 0.27 |
1b and e, x axis; 1c and f, y axis; 2b and e, x axis |
| Fixed | 0.47 | 1a and d; 2a, c, d, and f |
| Killing window (h) | ||
| Varied | From 6–44 to 26–44, increasing the lower limit of the window by 2 | 1a, c, d, and f, x axis; 2a and d, x axis |
| Fixed | 6–44 | 1b and e; 2b, c, e, and f |
| PQ grid points | ||
| EC50 (ng/ml) | ||
| Varied | 25, 27, 30, 32, 34, 37, 39, 41, 44, 46, 48, 51, 53, 55, 58, or 60 | 2a to c, y axis |
| Fixed | 25 | 1a to c |
| Killing window (h), fixed | 12–36 | 1a to c; 2a to c |
| MQ grid points | ||
| EC50 (ng/ml) | ||
| Varied | 280, 313, 345, 378, 411, 443, 476, 509, 541, 574, 607, 639, 672, 705, 737, or 770 |
2d to f, y axis |
| Fixed | 280 | 1d to f |
| Killing window (h), fixed | 18–40 | 1d to f; 2d to f |
TABLE 4.
Population PK parameter values for each drug
| PK parametera | ARS/DHAb | MQ | PQ |
|---|---|---|---|
| ka (h−1) (BSV [%]) | 0.82 (26.5) | 0.29 (26) | 0.717 (168) |
| CL/F (liters/kg/h) (BSV [%]) | 1.01 (22.4) | 0.03 (33) | 1.38 (42) |
| V/F (liters/kg) (BSV [%]) | 0.83 (50) | 10.2 (51) | |
| Vc/F (liters/kg) (BSV [%]) | 180.42 (101) | ||
| Q/F (liters/kg/h) (BSV [%]) | 2.73 (85) | ||
| Vp/F (liters/kg) (BSV [%]) | 500 (50) |
These parameter values were used in the LHS of the distribution for the PK parameters given in Table 5. Between-subject variability (BSV) is presented as the standard deviation multiplied by 100 (log-normal error model). Parameter values were taken from the literature for ARS/DHA (22), MQ (23), and PQ (24). ka, absorption rate constant; CL/F, clearance; V/F, volume of distribution; Vc/F, volume of the central compartment; Q/F, intercompartmental clearance; Vp/F, volume of the peripheral compartment; F, bioavailability.
ARS, artesunate; DHA, dihydroartemisinin; MQ, mefloquine; PQ, piperaquine. DHA profiles were simulated for ARS, since DHA is the primary active metabolite of ARS and ARS is considered the prodrug.
TABLE 5.
| Parameter(s) | Distributiona | Additional details |
|---|---|---|
| PK parametersb | lnN(μIPL,σIPL) | μIPL is the natural log-transformed PK parameter estimate in Table 4 and σIPL is the corresponding percent BSV estimate divided by 100 |
| IPL | lnN(10.03,1.13) | Multiplied by the average blood volume of an adult (∼5 × 10⁶ μl) |
| μIPL | DU(4,16) | |
| σIPL | DU(2,8) | |
| PMF | TRI(8,12,10) | |
| DHA/ARS γ | lnN(1.31,0.65) | |
| PQ γ | lnN(1.35,0.66) | |
| MQ γ | lnN(0.97,0.54) | |
| PQ kmax | TRI(0.33,0.65,0.49) | PRR = 104.6, KW = 25 h |
| MQ kmax | TRI(0.11,0.46,0.28) | PRR = 102.25, KW = 23 h |
Drug-independent parameters; 10.03 = ln(22,746), where 22,746 parasites per μl of blood is the initial parasite load. DU, discrete-uniform [DU(a,b), a < b; a and b are positive integers]; TRI, triangular [TRI(a,b,c), a < c < b; a, b, and c are real numbers]; lnN, log-normal [lnN(μIPL,σIPL); μIPL and σIPL are positive real numbers]. The mode of the triangular distribution for kmax (c) was calculated from the following expression: kmax = [(1/KW) × ln(PRR)] + [(1/KW) × ln(PMF)], where PRR is the parasite reduction ratio for the drug in the corresponding row, KW is the length of the killing window (in hours) for each drug in the corresponding row, and PMF in this expression equals 10 parasites/48 h. The lower and upper limits of the triangular distribution for kmax (a and b) are calculated by evaluating the latter expression for kmax with PRR values decreased or increased, respectively, by 50-fold (KW remains unchanged).
All parameters listed in Table 4. ARS, artesunate; DHA, dihydroartemisinin; MQ, mefloquine; PQ, piperaquine.
Contour (z axis) calculation.
The contours (z axis) in Fig. 1 and 2 were derived from the proportions of hypothetical patients who experienced treatment failure, as simulated with the within-host PKPD model (14). For each x and y axis combination in Table 3 (e.g., for Fig. 1a, the first grid point is DHA EC50 of 5 ng/ml [y axis] and DHA killing window of 6 to 44 h [x axis]), the proportion of hypothetical patients who experienced treatment failure was calculated as follows.
In step 1, simulate circulating parasitemia profiles for 1,000 hypothetical patients and for 63 days of follow-up monitoring by (i) setting the parameters labeled “fixed” in Table 3 to the values specified for all 1,000 hypothetical patients and each of the 176 (16 × 11) combinations of DHA EC50 and DHA killing window values to be evaluated, (ii) generating 1,000 PK and PD parameter datasets by using Latin hypercube sampling (LHS) (34) of the parameter distributions specified in Table 5 and setting the EC50 and killing window values to the current combination or grid point (e.g., set the DHA EC50 to 5 ng/ml and the killing window to 6 to 44 h for Fig. 1a) for all 1,000 PK and PD parameter datasets, and (iii) simulating 1,000 PK profiles based on the LHS-sampled PK parameters and ACT dosing regimens in Table 6 (see Fig. S2 in the supplemental material for a plot of the simulated PK profiles) and simulating 1,000 circulating parasitemia profiles for 63 days of follow-up monitoring from the within-host PKPD model based on the LHS-sampled PD parameters and simulated PK profiles.
TABLE 6.
Dosing regimens for ACT
| ACTa | Dosing regimen (WHO) |
|---|---|
| ARS-MQ | ARS at 4.0 mg/kg and MQ at 8.3 mg/kg at 0, 24, and 48 h |
| DHA-PQ | DHA at 4.0 mg/kg and PQ at 18.0 mg/kg at 0, 24, and 48 h |
ARS, artesunate; DHA, dihydroartemisinin; MQ, mefloquine; PQ, piperaquine.
In step 2, count the number of hypothetical patients who experienced treatment failure within 63 days of follow-up monitoring. Hypothetical patients are assumed to have experienced treatment failure if their circulating parasitemia profiles do not fall below or reappear above the microscopic limit of detection (50 parasites/μl of blood) during the 63 days of follow-up monitoring. In step 3, calculate the proportion of treatment failures by dividing the number obtained in step 2 by the number of hypothetical patients (n = 1,000).
LHS of the PK and PD parameters listed in Table 5 is performed only for the first grid point or (x,y) coordinate; these 1,000 PK and PD parameter data sets are then used for all remaining combinations (or grid points). All simulations and plotting were performed in R version 3.3.2. The proportion of hypothetical patients who experienced treatment failure for each combination or grid point was simulated using user-written R code. Contour plots of the simulated output were produced using the levelplot function from the lattice package, with panel.2dsmoother set to the loess method.
Supplementary Material
ACKNOWLEDGMENTS
This work was supported by a National Health and Medical Research Council (NHMRC) project grant (grant 1100394), by an Australian Research Council (ARC) Discovery Project grant (grant 170103076), and in part by an NHMRC Centre of Research Excellence for Biostatistics (Victorian Centre for Biostatistics, grant 1035261) and the Australian Centre of Research Excellence on Malaria Elimination (grant 1134989). J.A.S. is funded by a NHMRC Senior Research Fellowship (grant 1104975), S.G.Z. is funded by an ARC DECRA Fellowship (grant 170100785), and F.J.I.F. is funded by an ARC Future Fellowship (grant 130101122).
Footnotes
Supplemental material for this article may be found at https://doi.org/10.1128/AAC.01292-18.
REFERENCES
- 1.World Health Organization. 2017. World malaria report 2017. World Health Organization, Geneva, Switzerland. [Google Scholar]
- 2.World Health Organization. 2015. Guidelines for the treatment of malaria, 3rd ed World Health Organization, Geneva, Switzerland. [Google Scholar]
- 3.Dondorp AM, Nosten F, Yi P, Das D, Phyo AP, Tarning J, Lwin KM, Ariey F, Hanpithakpong W, Lee SJ, Ringwald P, Silamut K, Imwong M, Chotivanich K, Lim P, Herdman T, An SS, Yeung S, Singhasivanon P, Day NPJ, Lindegardh N, Socheat D, White NJ. 2009. Artemisinin resistance in Plasmodium falciparum malaria. N Engl J Med 361:455–467. doi: 10.1056/NEJMoa0808859. [DOI] [PMC free article] [PubMed] [Google Scholar]
- 4.Ashley EA, Dhorda M, Fairhurst RM, Amaratunga C, Lim P, Suon S, Sreng S, Anderson JM, Mao S, Sam B, Sopha C, Chuor CM, Nguon C, Sovannaroth S, Pukrittayakamee S, Jittamala P, Chotivanich K, Chutasmit K, Suchatsoonthorn C, Runcharoen R, Hien TT, Thuy-Nhien NT, Thanh NV, Phu NH, Htut Y, Han K-T, Aye KH, Mokuolu OA, Olaosebikan RR, Folaranmi OO, Mayxay M, Khanthavong M, Hongvanthong B, Newton PN, Onyamboko MA, Fanello CI, Tshefu AK, Mishra N, Valecha N, Phyo AP, Nosten F, Yi P, Tripura R, Borrmann S, Bashraheil M, Peshu J, Faiz MA, Ghose A, Hossain MA, Samad R, Rahman MR, Hasan MM, Islam A, Miotto O, Amato R, MacInnis B, Stalker J, Kwiatkowski DP, Bozdech Z, Jeeyapant A, Cheah PY, Sakulthaew T, Chalk J, Intharabut B, Silamut K, Lee SJ, Vihokhern B, Kunasol C, Imwong M, Tarning J, Taylor WJ, Yeung S, Woodrow CJ, Flegg JA, Das D, Smith J, Venkatesan M, Plowe CV, Stepniewska K, Guerin PJ, Dondorp AM, Day NP, White NJ. 2014. Spread of artemisinin resistance in Plasmodium falciparum malaria. N Engl J Med 371:411–423. doi: 10.1056/NEJMoa1314981. [DOI] [PMC free article] [PubMed] [Google Scholar]
- 5.Ariey F, Witkowski B, Amaratunga C, Beghain J, Langlois A-C, Khim N, Kim S, Duru V, Bouchier C, Ma L, Lim P, Leang R, Duong S, Sreng S, Suon S, Chuor CM, Bout DM, Ménard S, Rogers WO, Genton B, Fandeur T, Miotto O, Ringwald P, Le Bras J, Berry A, Barale J-C, Fairhurst RM, Benoit-Vical F, Mercereau-Puijalon O, Ménard D. 2014. A molecular marker of artemisinin-resistant Plasmodium falciparum malaria. Nature 505:50–55. doi: 10.1038/nature12876. [DOI] [PMC free article] [PubMed] [Google Scholar]
- 6.Dogovski C, Xie SC, Burgio G, Bridgford J, Mok S, McCaw JM, Chotivanich K, Kenny S, Gnädig N, Straimer J, Bozdech Z, Fidock DA, Simpson JA, Dondorp AM, Foote S, Klonis N, Tilley L. 2015. Targeting the cell stress response of Plasmodium falciparum to overcome artemisinin resistance. PLoS Biol 13:e1002132. doi: 10.1371/journal.pbio.1002132. [DOI] [PMC free article] [PubMed] [Google Scholar]
- 7.Klonis N, Xie SC, McCaw JM, Crespo-Ortiz MP, Zaloumis SG, Simpson JA, Tilley L. 2013. Altered temporal response of malaria parasites determines differential sensitivity to artemisinin. Proc Natl Acad Sci U S A 110:5157–5162. doi: 10.1073/pnas.1217452110. [DOI] [PMC free article] [PubMed] [Google Scholar]
- 8.Saralamba S, Pan-Ngum W, Maude RJ, Lee SJ, Tarning J, Lindegardh N, Chotivanich K, Nosten F, Day NPJ, Socheat D, White NJ, Dondorp AM, White LJ. 2011. Intrahost modeling of artemisinin resistance in Plasmodium falciparum. Proc Natl Acad Sci U S A 108:397–402. doi: 10.1073/pnas.1006113108. [DOI] [PMC free article] [PubMed] [Google Scholar]
- 9.Khoury DS, Cromer D, Elliott T, Soon MSF, Thomas BS, James KR, Best SE, Aogo RA, Engel JA, Gartlan KH, Akter J, Sebina I, Haque A, Davenport MP. 2017. Characterising the effect of antimalarial drugs on the maturation and clearance of murine blood-stage Plasmodium parasites in vivo. Int J Parasitol 47:913–922. doi: 10.1016/j.ijpara.2017.05.009. [DOI] [PubMed] [Google Scholar]
- 10.Woodrow CJ, White NJ. 2017. The clinical impact of artemisinin resistance in Southeast Asia and the potential for future spread. FEMS Microbiol Rev 41:34–48. doi: 10.1093/femsre/fuw037. [DOI] [PMC free article] [PubMed] [Google Scholar]
- 11.Tilley L, Straimer J, Gnädig NF, Ralph SA, Fidock DA. 2016. Artemisinin action and resistance in Plasmodium falciparum. Trends Parasitol 32:682–696. doi: 10.1016/j.pt.2016.05.010. [DOI] [PMC free article] [PubMed] [Google Scholar]
- 12.Simpson JA, Zaloumis S, DeLivera AM, Price RN, McCaw JM. 2014. Making the most of clinical data: reviewing the role of pharmacokinetic-pharmacodynamic models of anti-malarial drugs. AAPS J 16:962–974. doi: 10.1208/s12248-014-9647-y. [DOI] [PMC free article] [PubMed] [Google Scholar]
- 13.Winter K, Hastings IM. 2011. Development, evaluation, and application of an in silico model for antimalarial drug treatment and failure. Antimicrob Agents Chemother 55:3380–3392. doi: 10.1128/AAC.01712-10. [DOI] [PMC free article] [PubMed] [Google Scholar]
- 14.Zaloumis S, Humberstone A, Charman SA, Price RN, Moehrle J, Gamo-Benito J, McCaw J, Jamsen KM, Smith K, Simpson JA. 2012. Assessing the utility of an anti-malarial pharmacokinetic-pharmacodynamic model for aiding drug clinical development. Malar J 11:303. doi: 10.1186/1475-2875-11-303. [DOI] [PMC free article] [PubMed] [Google Scholar]
- 15.Hoshen MB, Na-Bangchang K, Stein WD, Ginsburg H. 2000. Mathematical modelling of the chemotherapy of Plasmodium falciparum malaria with artesunate: postulation of ‘dormancy,’ a partial cytostatic effect of the drug, and its implication for treatment regimens. Parasitology 121:S0031182099006332. [DOI] [PubMed] [Google Scholar]
- 16.Hodel EM, Kay K, Hastings IM. 2016. Incorporating stage-specific drug action into pharmacological modeling of antimalarial drug treatment. Antimicrob Agents Chemother 60:2747–2756. doi: 10.1128/AAC.01172-15. [DOI] [PMC free article] [PubMed] [Google Scholar]
- 17.ter Kuile F, White NJ, Holloway P, Pasvol G, Krishna S. 1993. Plasmodium falciparum: in vitro studies of the pharmacodynamic properties of drugs used for the treatment of severe malaria. Exp Parasitol 76:85–95. doi: 10.1006/expr.1993.1010. [DOI] [PubMed] [Google Scholar]
- 18.Amato R, Lim P, Miotto O, Amaratunga C, Dek D, Pearson RD, Almagro-Garcia J, Neal AT, Sreng S, Suon S, Drury E, Jyothi D, Stalker J, Kwiatkowski DP, Fairhurst RM. 2017. Genetic markers associated with dihydroartemisinin-piperaquine failure in Plasmodium falciparum malaria in Cambodia: a genotype-phenotype association study. Lancet Infect Dis 17:164–173. doi: 10.1016/S1473-3099(16)30409-1. [DOI] [PMC free article] [PubMed] [Google Scholar]
- 19.Phyo AP, Ashley EA, Anderson TJC, Bozdech Z, Carrara VI, Sriprawat K, Nair S, White MM, Dziekan J, Ling C, Proux S, Konghahong K, Jeeyapant A, Woodrow CJ, Imwong M, McGready R, Lwin KM, Day NPJ, White NJ, Nosten F. 2016. Declining efficacy of artemisinin combination therapy against P. falciparum malaria on the Thai-Myanmar border (2003–2013): the role of parasite genetic factors. Clin Infect Dis 63:784–791. doi: 10.1093/cid/ciw388. [DOI] [PMC free article] [PubMed] [Google Scholar]
- 20.Stepniewska K, Ashley E, Lee SJ, Anstey N, Barnes KI, Binh TQ, D’Alessandro U, Day NPJ, de Vries PJ, Dorsey G, Guthmann J, Mayxay M, Newton PN, Olliaro P, Osorio L, Price RN, Rowland M, Smithuis F, Taylor WRJ, Nosten F, White NJ. 2010. In vivo parasitological measures of artemisinin susceptibility. J Infect Dis 201:570–579. doi: 10.1086/650301. [DOI] [PMC free article] [PubMed] [Google Scholar]
- 21.Patel K, Simpson JA, Batty KT, Zaloumis S, Kirkpatrick CM. 2015. Modelling the time course of antimalarial parasite killing: a tour of animal and human models, translation and challenges. Br J Clin Pharmacol 79:97–107. doi: 10.1111/bcp.12288. [DOI] [PMC free article] [PubMed] [Google Scholar]
- 22.Jamsen KM, Duffull SB, Tarning J, Lindegardh N, White NJ, Simpson JA. 2011. Optimal designs for population pharmacokinetic studies of oral artesunate in patients with uncomplicated falciparum malaria. Malar J 10:181. doi: 10.1186/1475-2875-10-181. [DOI] [PMC free article] [PubMed] [Google Scholar]
- 23.Ashley EA, Stepniewska K, Lindegårdh N, McGready R, Hutagalung R, Hae R, Singhasivanon P, White NJ, Nosten F. 2006. Population pharmacokinetic assessment of a new regimen of mefloquine used in combination treatment of uncomplicated falciparum malaria. Antimicrob Agents Chemother 50:2281–2285. doi: 10.1128/AAC.00040-06. [DOI] [PMC free article] [PubMed] [Google Scholar]
- 24.Tarning J, Ashley EA, Lindegardh N, Stepniewska K, Phaiphun L, Day NPJ, McGready R, Ashton M, Nosten F, White NJ. 2008. Population pharmacokinetics of piperaquine after two different treatment regimens with dihydroartemisinin-piperaquine in patients with Plasmodium falciparum Malaria in Thailand. Antimicrob Agents Chemother 52:1052–1061. doi: 10.1128/AAC.00955-07. [DOI] [PMC free article] [PubMed] [Google Scholar]
- 25.Ataide R, Ashley EA, Powell R, Chan J-A, Malloy MJ, O’Flaherty K, Takashima E, Langer C, Tsuboi T, Dondorp AM, Day NP, Dhorda M, Fairhurst RM, Lim P, Amaratunga C, Pukrittayakamee S, Hien TT, Htut Y, Mayxay M, Faiz MA, Beeson JG, Nosten F, Simpson JA, White NJ, Fowkes FJI. 2017. Host immunity to Plasmodium falciparum and the assessment of emerging artemisinin resistance in a multinational cohort. Proc Natl Acad Sci U S A 114:3515–3520. doi: 10.1073/pnas.1615875114. [DOI] [PMC free article] [PubMed] [Google Scholar]
- 26.Davis TME, Hamzah J, Ilett KF, Karunajeewa HA, Reeder JC, Batty KT, Hackett S, Barrett PHR. 2006. In vitro interactions between piperaquine, dihydroartemisinin, and other conventional and novel antimalarial drugs. Antimicrob Agents Chemother 50:2883–2885. doi: 10.1128/AAC.00177-06. [DOI] [PMC free article] [PubMed] [Google Scholar]
- 27.Cao P, Klonis N, Zaloumis S, Khoury DS, Cromer D, Davenport MP, Tilley L, Simpson JA, McCaw JM. 2017. A mechanistic model quantifies artemisinin-induced parasite growth retardation in blood-stage Plasmodium falciparum infection. J Theor Biol 430:117–127. doi: 10.1016/j.jtbi.2017.07.017. [DOI] [PubMed] [Google Scholar]
- 28.Khoury DS, Cromer D, Akter J, Sebina I, Elliott T, Thomas BS, Soon MSF, James KR, Best SE, Haque A, Davenport MP. 2017. Host-mediated impairment of parasite maturation during blood-stage Plasmodium infection. Proc Natl Acad Sci U S A 114:7701–7706. doi: 10.1073/pnas.1618939114. [DOI] [PMC free article] [PubMed] [Google Scholar]
- 29.Cao P, Klonis N, Zaloumis S, Dogovski C, Xie SC, Saralamba S, White LJ, Fowkes FJI, Tilley L, Simpson JA, McCaw JM. 2017. A dynamic stress model explains the delayed drug effect in artemisinin treatment of Plasmodium falciparum. Antimicrob Agents Chemother 61:e00618-17. doi: 10.1128/AAC.00618-17. [DOI] [PMC free article] [PubMed] [Google Scholar]
- 30.Witkowski B, Khim N, Chim P, Kim S, Ke S, Kloeung N, Chy S, Duong S, Leang R, Ringwald P, Dondorp AM, Tripura R, Benoit-Vical F, Berry A, Gorgette O, Ariey F, Barale J-C, Mercereau-Puijalon O, Menard D. 2013. Reduced artemisinin susceptibility of Plasmodium falciparum ring stages in western Cambodia. Antimicrob Agents Chemother 57:914–923. doi: 10.1128/AAC.01868-12. [DOI] [PMC free article] [PubMed] [Google Scholar]
- 31.Mok S, Ashley EA, Ferreira PE, Zhu L, Lin Z, Yeo T, Chotivanich K, Imwong M, Pukrittayakamee S, Dhorda M, Nguon C, Lim P, Amaratunga C, Suon S, Hien TT, Htut Y, Faiz MA, Onyamboko MA, Mayxay M, Newton PN, Tripura R, Woodrow CJ, Miotto O, Kwiatkowski DP, Nosten F, Day NPJ, Preiser PR, White NJ, Dondorp AM, Fairhurst RM, Bozdech Z. 2015. Population transcriptomics of human malaria parasites reveals the mechanism of artemisinin resistance. Science 347:431–435. doi: 10.1126/science.1260403. [DOI] [PMC free article] [PubMed] [Google Scholar]
- 32.Fairhurst RM, Dondorp AM. 2016. Artemisinin-resistant Plasmodium falciparum malaria. Microbiol Spectr 4:409–429. doi: 10.1128/microbiolspec.EI10-0013-2016. [DOI] [PMC free article] [PubMed] [Google Scholar]
- 33.Saunders DL, Vanachayangkul P, Lon C. 2014. Dihydroartemisinin-piperaquine failure in Cambodia. N Engl J Med 371:484–485. doi: 10.1056/NEJMc1403007. [DOI] [PubMed] [Google Scholar]
- 34.Hoare A, Regan DG, Wilson DP. 2008. Sampling and sensitivity analyses tools (SaSAT) for computational modelling. Theor Biol Med Model 5:4. doi: 10.1186/1742-4682-5-4. [DOI] [PMC free article] [PubMed] [Google Scholar]
Associated Data
This section collects any data citations, data availability statements, or supplementary materials included in this article.