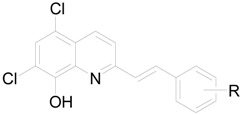
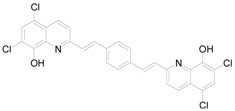
Table 1.
Comparison of the calculated lipophilicities (log P/Clog P) with the determined log k values.
 | ||||
| Comp. | R | log k | log P/Clog P | log P |
| ChemOffice | ACD/LogP | |||
| 1 | 5-NO2 | 0.5695 | 1.69 / 2.0836 | 2.00 ± 0.32 |
| 2 | 5-SO3H-7-NO2 | 0.1479 | 0.37 / -0.703 | 1.70 ± 0.88 |
| 3 | 5-SO3H-7-Br | 0.3786 | 1.72 / -0.004 | 2.39 ± 0.91 |
| 4 |

|
0.3293 | 0.61 / 1.43775 | 1.19 ± 0.81 |
| 5 | 5-SO2NHCH(CH3)2 | 0.3373 | 2.17 / 2.5697 | 1.97 ± 0.78 |
| 6 | 5-SO2NHC2H4Ph | 0.3349 | 3.17 / 3.83597 | 3.29 ± 0.79 |
| 7 | 5-SO2NHC4H8Ph | 0.3902 | 4.09 / 4.74397 | 4.18 ± 0.78 |
| 8 |

|
0.3583 | 1.33 / 0.93375 | 0.52 ± 0.73 |

| ||||
| Comp. | R | log k | log P/Clog P | log P |
| ChemOffice | ACD/LogP | |||
| 9 | 2-OH | 1.5854 | 5.07 / 5.36425 | 5.62 ± 0.35 |
| 10 | 4-OH | 1.5866 | 5.07 / 5.36425 | 6.37 ± 0.36 |
| 11 | 2,4-OH | 1.5858 | 4.68 / 4.69725 | 5.65 ± 0.37 |
| 12 | 3,5-OH | 1.5867 | 4.68 / 4.69725 | 6.20 ± 0.37 |
| 13 | 2-OH-5-OAc | 1.5864 | 4.66 / 4.89345 | 4.87 ± 0.36 |
| 14 |

|
2.5760 | 8.88 / 9.92051 | 10.50 ± 0.39 |
