Abstract
Purpose
The purpose of this study was to assess the effects of biomimetic intrafibrillar mineralized collagen (IMC) bone scaffold materials on bone regeneration and the underlying biological mechanisms.
Materials and methods
A critical-sized bone defect in the rat femur was created; then IMC, extrafibrillar mineralized collagen, and nano-hydroxyapatite bone scaffold materials were grafted into the defect. Ten weeks after implantation, micro-computed tomography and histology were applied to evaluate the bone regeneration. Furthermore, microarray technology was applied for transcriptional profile analysis at two postoperative time points (7 and 14 days). Subsequently, the critical genes involved in bone regeneration identified by transcriptional analysis were verified both in vivo through immunohistochemical analysis and in vitro by quantitative real-time transcription polymerase chain reaction evaluation.
Results
Significantly increased new bone formation was found in the IMC group based on micro-computed tomography and histological evaluation (P<0.05). Transcriptional analysis revealed that the early process of IMC-guided bone regeneration involves the overexpression of genes mainly associated with inflammation, immune response, skeletal development, angiogenesis, neurogenesis, and the Wnt signaling pathway. The roles of the Wnt signaling pathway-related factors Wnt5a, β-catenin, and Axin2 were further confirmed both in vivo and in vitro.
Conclusion
The IMC bone scaffold materials significantly enhanced bone regeneration via activation of the Wnt signaling pathway.
Keywords: mineralized collagen, bone defects reconstruction, bone regeneration, transcriptional analysis, Wnt signaling pathway
Introduction
Bone defects are a common problem encountered in clinics worldwide, affecting the quality of life of patients and causing a tremendous socioeconomic burden. At present, various grafts utilized for bone repair and reconstruction still present unsatisfactory clinical requirements due to donor-site morbidity of autologous bone grafts, potential disease transmission, and immune rejection of allografts and xenografts, and inferior biological functionality of synthetic grafts. Recently, bone tissue engineering based on biomimetic scaffold materials has developed very rapidly and has provided a promising alternative for the repair and reconstruction of bone defects. It is vital to select ideal bone scaffold materials in bone tissue engineering strategies, which mainly depend on their physical and chemical properties.1 Firstly, a sufficient initial mechanical strength and stiffness must be provided to replace lost bone and to support the proliferation and differentiation of osteoblasts. Secondly, superior biocompatibility, biodegradation, and surface properties are all important aspects required for bone scaffold materials.1,2
Mineralized collagen is recognized as the fundamental building block of bone scaffold materials as it has the hierarchically organized structure of natural bone.3–5 Many efforts have been made to develop bone-like collagen/hydroxyapatite composites. However, previous studies have mainly focused on extrafibrillar mineralized collagen (EMC) fabricated by conventional crystallization methods, in which apatite crystallites are deposited randomly around the collagen fibrils. As natural bone needs to fit the variable mechanical demands via its hierarchically staggered nanostructure, the EMC can only produce similar chemical properties rather than the surface chemistry and nanostructure of bone extracellular matrix (ECM);6 therefore, the strength of EMC is insufficient.
Intrafibrillar mineralization has been demonstrated to be a crucial factor for native bone biomechanics; in addition, fabrication of mineralized collagen with intrafibrillar HA has been determined to imitate bone ECM. Based on the biomimetic strategy principle, a hierarchical and intrafibrillar mineralized collagen (IMC) with distinct nanostructures has been fabricated in our previous work and has been shown to be an ideal alternative bone scaffold material.3,5,7,8
IMC bone scaffold materials have shown excellent capacities in promoting osteogenic differentiation and bone regeneration in previous work by us and others.7,9,10 However, most of our previous studies about this material were performed in vitro rather than in vivo. Furthermore, the exact biological processes and mechanisms involved in this IMC scaffold-guided bone regeneration (GBR) process are far from being elucidated, particularly at the cellular and molecular levels.
Therefore, the aims of this study were to evaluate the effects of IMC bone scaffold materials implanted in a critical-sized bone defect of a rat femur and to identify the biological processes and molecular mechanisms involved in this IMC-GBR process. It is expected that the present study will provide insight into the molecular mechanisms that occur during IMC-GBR, thus identifying the molecular targets that could be utilized to develop novel approaches for improving bone regeneration.
Materials and methods
Preparation of bone scaffold materials
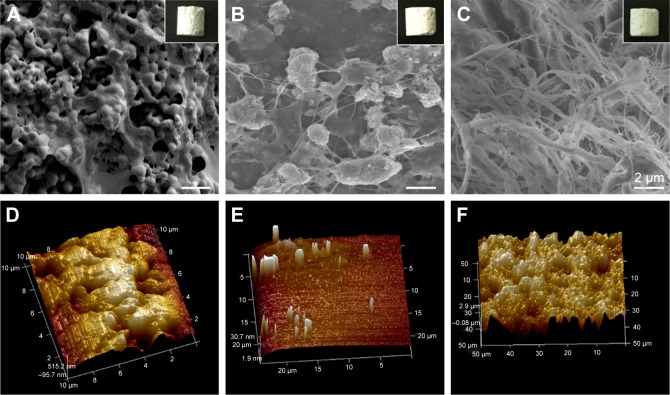
Three types of bone scaffold materials were utilized in this study: group I, nano-hydroxyapatite (HA) materials; group II, EMC materials; and group III, IMC materials. The IMC samples utilized in this study were synthesized via an in vitro biomimetic mineralization process using hierarchical self-assembled nHA and collagen composite, as described previously.5,7,11 The EMC scaffold materials were fabricated by a conventional crystallization method.6 Samples were prepared with a pore size of 100–400 µm and a porosity of 85%–95%. The scaffolds used for the in vivo study were in the shape of a cylinder that was 5 mm in height and 4 mm in diameter; while for the in vitro study, they were in the shape of discs that were 1 mm in thickness and 12 mm in diameter. The surface topography for the HA, EMC, and IMC materials was visualized by scanning electron microscopy (Inspect F, FEI, Eindhoven, the Netherlands) and atomic force microscopy (Multimode and Dimension 3100, Varian, Palo Alto, CA, USA; Figure 1). The scaffolds exhibited a typical reticular pore structure for the HA materials, a pronounced fibrous structure for the IMC materials, and a rough texture with nano-apatite clusters randomly deposited around the fibrils in the EMC materials.
Figure 1.
The macroscopic and surface topography images.
Note: HA (A, D), EMC (B, E), and IMC (C, F) visualized by SEM and AFM, individually.
Abbreviations: AFM, atomic force microscopy; EMC, extrafibrillar mineralized collagen; HA, nano-hydroxyapatite; IMC, intrafibrillar mineralized collagen; SEM, scanning electron microscopy.
All experiments using animals were performed according to the Guidelines for the Care and Use of Laboratory Animals from the US National Institutes of Health and were approved by the Animal Care and Use Committee, Shanghai Jiao Tong University, Shanghai, China.
In vivo study
Animal experimental design and surgical procedure
Male Sprague Dawley rats, weighing 280–300 g, were kept under standard conditions (controlled temperature: 22°C±2°C; humidity: 55%±5%; light–dark cycle: 12 hours/12 hours) with water and food available ad libitum, five rats per cage.
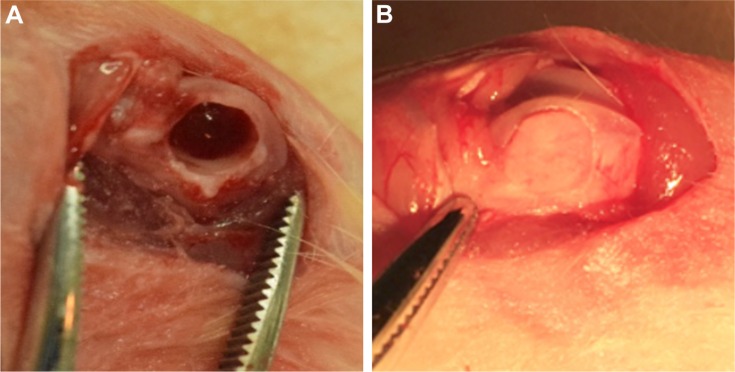
For the surgical procedure, the rats were anesthetized by an intraperitoneal injection of chloral hydrate (350 mg/kg body weight, Sigma-Aldrich Co., St Louis, MO, USA), and then the hair on the bilateral femur was removed. After exposure of the lower femoral joint, a cylindrical shape defect of 4 mm in diameter and 5 mm in depth was prepared on the distal femoral condyle.
A total of 36 animals with 72 femurs were randomly allocated into the following groups: 1) blank group (n=20); 2) nHA group (n=14); 3) EMC group (n=14); 4) IMC group (n=20); and 5) sham surgery group (n=4). For the blank group, the defect area was not filled with any graft material and was used as a blank control. For the nHA, EMC, and IMC groups, the corresponding scaffold material was implanted into the defects, respectively. For the sham group, a surgery was performed without a defect (Figure 2).
Figure 2.
Surgical procedures.
Notes: (A) Critical-sized defects created on a rat femur. (B) Bone scaffold materials implanted into the defect.
Micro-computed tomography (µ-CT) evaluation
The femurs of each group (excluding the sham group, n=6/group) were harvested 10 weeks after the surgery and fixed in 4% neutral paraformaldehyde-buffered solution for 3 days before µ-CT evaluation. Then, a µ-CT system (Scanco Medical, Bassersdorf, Switzerland) was applied to scan the samples with the following parameters: voltage, 70 kV; electric current, 114 mA; and integration time, 700 ms. Subsequently, the parameters were set for three-dimensional reconstruction with an anisotropic voxel size of 10 µm as follows: σ=1.2, support=1, bone threshold=200, and scaffold threshold=700. The definition of the region of interest was determined with a cylindrical contour, taking into consideration the size of the defect (4.0 mm in diameter), and enlarged in the vertical direction to address all of the biomaterial and newly regenerated bone. Then, the ratio of bone tissue volume to total tissue volume (BV/TV) was calculated by the µ-CT image analysis software.
Histological evaluation
After µ-CT scanning, the samples were decalcified with 14% ethylenediaminetetraacetic acid (EDTA) for 20 days and then subjected to gradual dehydration, paraffin infiltration, and embedding. Subsequently, 5-µm-thick sections were prepared, stained with HE, and visualized under a stereomicroscope (ECLIPSE E600, Nikon, Tokyo, Japan). Image-Pro Plus software (Media Cybernetics) was applied to calculate the ratio of regenerated new bone (n=6/group).
Total RNA extraction and transcriptional profiling analysis
Specimens of regenerated tissues in the IMC and blank groups at 7 and 14 days after the surgery were harvested for transcriptional analysis (n=3/group at each time point). In brief, the regenerated tissue in the defect area was harvested with a trephine and homogenized in 1 mL of TRIzol reagent (Thermo Fisher Scientific, Waltham, MA, USA). Total RNA of each sample was extracted utilizing an RNeasy Mini Kit (Qiagen NV, Venlo, the Netherlands). The RNA concentration was measured by a Nanodrop ND-2000 spectrophotometer (Thermo Fisher Scientific, Waltham, MA, USA), according to the manufacturer’s protocol. Then, the gene expression profiles were analyzed utilizing the Agilent Rat mRNA V3 (8*60K, Design ID: 062716). Differentially expressed mRNAs were identified by the fold change as well as the P-value calculated with the t-test. The threshold for overexpressed genes was a fold change >2.0 or <2.0 and a P-value<0.05. The gene functional classification tool Database for Annotation, Visualization and Integrated Discovery (DAVID) was applied for functional analysis of the differentially expressed genes by identifying the over-expressed gene ontology (GO) terms.
Immunohistochemical analysis
The femurs of each group (n=4/group) were harvested for immunohistochemical analysis at 7 and 14 days, respectively, after the surgery. The tissue specimens were fixed in 4% paraformaldehyde, washed, dehydrated, embedded in paraffin, and then cut into 5-µm-thick sections. Anti-Wnt5a (ab174963, Abcam, Cambridge, MA, USA), anti-β-catenin (ab32572, Abcam), and anti-Axin2 (ab32197, Abcam) were selected as the primary antibodies. Negative control slides were prepared by omission of the primary antibody and incubation with 1% bovine serum albumin in PBS. Images were obtained under a light microscope (Leica DMI 6000B, Leica Microsystems, Wetzlar, Germany), and the relative proportions of positively stained cells were semiquantitated by the counting procedure applying a 40× objective. The number of cells/mm2 was determined and calculated with respect to the defect region.
In vitro study
Cell culture and seeding
Rat bone marrow-derived mesenchymal stem cells (rBMSCs) were isolated from the femurs of 4-week-old Sprague Dawley rats (Animal Research Center, Shanghai Jiao Tong University, Shanghai, China) utilizing a well-established technique. rBMSCs were subsequently cultured in modified alpha-minimum essential medium (α-MEM; Hyclone, South Logan, UT, USA) supplemented with 10% fetal bovine serum in a humidified incubator containing an atmosphere of 5% CO2 at 37°C. Cells from passage 3 were used in subsequent experiments. Flow cytometric analysis was performed to confirm the immunophenotye of these cells utilizing fluorescein isothiocyanate-labeled antibodies against the rat antigens CD34, CD44, CD45, and CD90 (BioLegend, San Diego, CA, USA). Then, the cells were digested by trypsin and seeded at a density of 3×10⁴ cells/cm2 on the scaffold materials in 24-well plate (BD, Franklin Lakes, NJ, USA) for each group.
Alkaline phosphatase (ALP) activity assay
ALP activity was assayed by an ALP assay kit (Sigma-Aldrich), according to the manufacturer’s protocol, at 7 and 14 days. The activity was calculated by evaluating the absorbance at 520 nm using a microplate reader (n=5).
Alizarin red S (ARS) staining
ARS staining was applied to evaluate the ECM calcium deposition by rBMSCs on the scaffold materials of each group for 21 days. Briefly, the samples were rinsed three times with PBS, fixed with 4% paraformaldehyde, and stained with 2% ARS solution. Then, the samples were visualized under a light microscope. The amount of dye released was quantified by a spectrophotometer after the ARS stain was released from the cell matrix (n=5).
Real-time reverse transcription polymerase chain reaction for specific gene expression
After 3 and 7 days of culture, quantitative real-time transcription polymerase chain reaction (qRT-PCR) was applied to assess the mRNA expression of Wnt5a, β-catenin, and Axin2. GAPDH was used as a housekeeping gene. Real-time PCR was conducted with a SYBR® Premix Ex TaqTM II kit (Takara, Kusatsu, Shiga Prefecture, Japan) utilizing an ABI-7300 Real-time PCR system (Thermo Fisher Scientific, Foster City, CA, USA). All procedures were conducted according to the manufacturer’s protocol. Relative gene expression was calculated utilizing the 2−ΔΔCt method (n=5). The primers were designed by primer 5.0 design primer software and commercially synthesized (Table 1).
Table 1.
Primers for qRT-PCR
| Gene | Forward primer (5′–3′) | Reverse primer (5′–3′) |
|---|---|---|
|
| ||
| GAPDH | GGTGAAGGTCGGAGTCAACGG | GGTCATGAGTCCTTCCACGAT |
| Wnt5a | TCTCAGCCCAAGCAACAAGG | GCCAGCATCACATCACAACAC |
| β-Catenin | GCTACTGTTGGATTGATTCGAAATC | CCCTGCTCACGCAAAGGT |
| Axin2 | CCCCAAAGCAGCGGTGC | GCGTGGACACCTGCCAG |
Abbreviation: qRT-PCR, quantitative real-time transcription polymerase chain reaction.
Evaluation of rBMSCs on IMC scaffolds with the Wnt signaling pathway inhibitor Dkk1
The rBMSCs were seeded on IMC scaffolds as mentioned above, and then randomly divided into two groups: IMC group and IMC + Dickkofp-1 (Dkk1) group. For the IMC + Dkk1 group, 1 mL of α-MEM containing 10% fetal bovine serum and 100 ng/mL Dkk1 (recombinant mouse Dkk1 protein powder, Sigma-Aldrich) were added. While for the IMC group, α-MEM was added without Dkk1. ALP activity was assayed after coculture for 7 and 14 days, and the gene expression of Wnt5a, β-catenin, and Axin2 was evaluated by qRT-PCR at day 3, as mentioned above.
Statistical analysis
All numerical data are expressed as the mean ± standard deviation, and GraphPad Software, Inc., La Jolla, CA, USA was used for statistical analysis. The statistical analyses of the results for the µ-CT, histological evaluation, ALP activity, ARS, and PCR were conducted with analysis of variance followed by Tukey’s post hoc multiple comparison test. The analysis for ALP activity and the related gene expression between the IMC and IMC + Dkk1 groups was conducted with the unpaired Student’s t-test. Differences were considered as statistically significant when P<0.05.
For transcriptional analysis, the image data for the 12 samples were extracted utilizing BeadStudio and imported into GeneSpring for statistical analysis. Prior to statistical analysis, noisy data were discarded based on the values generated by the BeadStudio software to ensure that the gene was expressed above noise levels in any given treatment in a relatively reproducible way. Significant GO, set at P<0.05, was corrected for multiple sampling using the method of Benjamini et al.12
Results
µ-CT and histological evaluation
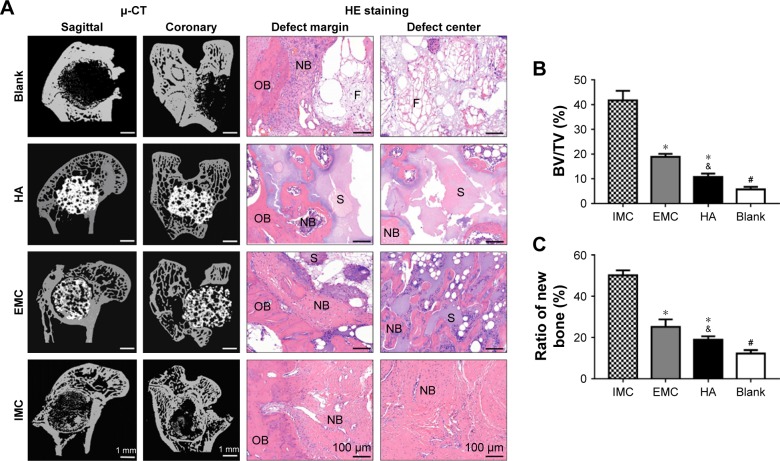
The capacities of the bone scaffold materials in promoting bone regeneration and maintaining the integrity of the defect space were assessed by µ-CT and histological evaluation. Ten weeks after implantation, reconstructed µ-CT showed that the defects were filled with fibrous bone structures, with the most material degradation in the IMC group. Whereas, in the HA and EMC groups, almost none or only a few scaffolds were degraded and a few newly formed bone structures could be observed in the pore structure of the scaffolds. In the defect group, only a few newly formed bone structures were found at the margin of the defects. The HE staining results were consistent with the µ-CT results, revealing that the defects were almost entirely filled with fibrous bone structures in the IMC group, with even the center of the defect showing obvious bone marrow formation (Figure 3A). Compared with the HA and EMC groups, more new bone formation was found in the IMC group, and the difference was significant (P<0.05), according to the statistical analysis of the BV/TV ratio based on the µ-CT and HE staining results (Figure 3B and C).
Figure 3.
Analysis of in vivo bone regeneration effects of different bone scaffold materials.
Notes: (A) Representative µ-CT and HE staining images of defect regions after implantation with blank, HA, EMC, and IMC scaffolds for 10 weeks. (B) New BV relative to the TV within the defect region from different groups based on µ-CT analysis. (C) Semiquantitative analysis of new bone based on histologic examination. *P<0.05 vs IMC; &P<0.05 vs EMC; #P<0.05 vs all of the other groups.
Abbreviations: µ-CT, micro-computed tomography; BV, bone tissue volume; EMC, extrafibrillar mineralized collagen; HA, nano-hydroxyapatite; IMC, intrafibrillar mineralized collagen; NB, new bone; OB, old bone; S, scaffold materials; TV, total tissue volume; F, fibrous tissue.
Transcriptional profiling analysis
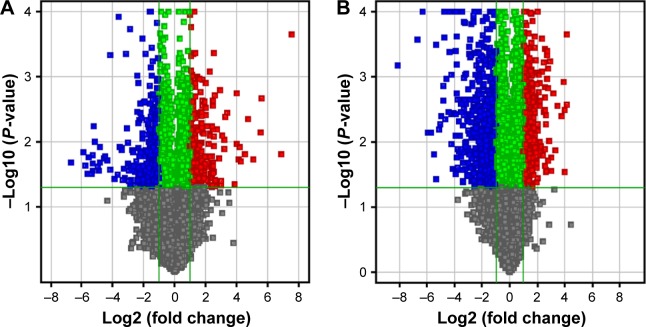
During the IMC-GBR process, at day 7, a total of 501 genes were differentially expressed, with 252 upregulated and 249 downregulated; while at day 14, a total of 1,011 genes were differentially expressed, with 507 upregulated and 504 downregulated (Table 2). The volcano plots of these statistically significant genes were built (Figure 4).
Table 2.
Numbers of differentially expressed genes at days 7 and 14
| Numbers of differentially significant genes
|
|||
|---|---|---|---|
| Upregulated | Downregulated | Total | |
|
| |||
| Day 7 | 252 | 249 | 501 |
| Day 14 | 507 | 504 | 1,011 |
Figure 4.
The volcano plots of differentially expressed genes between IMC and blank groups.
Notes: (A) At day 7. (B) At day 14. Red points indicate mRNAs with a fold change of ≥2.0 and a P-value ≤0.05. Blue points indicate mRNAs with a fold change of ≤2.0 and a P-value of ≤0.05.
Abbreviation: IMC, intrafibrillar mineralized collagen.
The functional significance of these differentially expressed genes was analyzed by GO analysis based on the DAVID tool (Tables 3 and 4). At day 7, most of the upregulated genes were related to inflammation and immune response as well as angiogenesis. At day 14, genes related to cell differentiation, developmental processes, and osteogenesis were all evidently upregulated. Furthermore, genes related to neurogenesis and Wnt signaling as well as genes related to regulation of Ras and Rho signal transduction were also found to be upregulated. Functionally, genes associated with osteogenesis and related with Wnt signaling pathways were regulated (Table 5).
Table 3.
Overexpressed GO categories of biological processes at day 7
| Term ID and description | Count | P-value |
|---|---|---|
|
| ||
| Downregulated | ||
| GO:0050731–positive regulation of peptidyl-tyrosine phosphorylation | 12 | 2.64E–06 |
| GO:0019221–cytokine-mediated signaling pathway | 10 | 2.10E–05 |
| GO:0001666–response to hypoxia | 13 | 0.000331 |
| GO:0006886–intracellular protein transport | 8 | 0.00646 |
| GO:0050918–positive regulation of protein kinase B signaling | 8 | 0.0144 |
| GO:0045779–negative regulation of bone resorption | 4 | 0.0351 |
| GO:0006508–proteolysis | 5 | 0.0419 |
| Upregulated | ||
| GO:0006954–inflammatory response | 9 | 2.04E–05 |
| GO:0009611–response to wounding | 15 | 4.73E–05 |
| GO:0002526–acute inflammatory response | 13 | 0.000158 |
| GO:0006955–immune response | 15 | 0.000827 |
| GO:0001525–angiogenesis | 11 | 0.000985 |
| GO:0019882–antigen processing and presentation | 6 | 0.00451 |
| GO:0008284–positive regulation of cell proliferation | 10 | 0.00508 |
| GO:0006953–acute-phase response | 5 | 0.00797 |
| GO:0042088–T-helper 1 type immune response | 6 | 0.0105 |
| GO:0030101–natural killer cell activation | 4 | 0.0122 |
| GO:0007155–cell adhesion | 7 | 0.0164 |
| GO:0042060–wound healing | 5 | 0.0288 |
| GO:0051092–positive regulation of NF-kappaB transcription factor activity | 5 | 0.0394 |
| GO:0007599–hemostasis | 3 | 0.0402 |
| GO:0007568–aging | 4 | 0.0413 |
Abbreviation: GO, gene ontology.
Table 4.
Overexpressed GO terms of biological processes at day 14
| Term ID and description | Count | P-value |
|---|---|---|
|
| ||
| Downregulated | ||
| GO:0071347–cellular response to interleukin-1 | 17 | 2.24E–06 |
| GO:0001913–T cell-mediated cytotoxicity | 11 | 4.51E–05 |
| GO:0070374–positive regulation of ERK1 and ERK2 cascade | 7 | 0.000271 |
| GO:0003009–skeletal muscle contraction | 4 | 0.000431 |
| GO:0002548–monocyte chemotaxis | 5 | 0.00227 |
| GO:0060389–pathway-restricted SMAD protein phosphorylation | 3 | 0.00316 |
| GO:0048535–lymph node development | 4 | 0.0164 |
| GO:0014823–response to activity | 3 | 0.0287 |
| GO:0006816–calcium ion transport | 5 | 0.0354 |
| GO:0045453–bone resorption | 3 | 0.0359 |
| GO:0034141–positive regulation of toll-like receptor 3 signaling pathway | 2 | 0.0477 |
| Upregulated | ||
| GO:0048856–anatomical structure development | 21 | 3.37E–05 |
| GO:0032502–developmental process | 18 | 8.16E–05 |
| GO:0048468–cell development | 17 | 0.000871 |
| GO:0016055–Wnt signaling pathway | 11 | 0.000960 |
| GO:0001501–skeletal system development | 13 | 0.00104 |
| GO:0007399–nervous system development | 14 | 0.00116 |
| GO:0030154–cell differentiation | 9 | 0.00189 |
| GO:005087–neurological system process | 11 | 0.0182 |
| GO:0060348–bone development | 10 | 0.00209 |
| GO:0090263–positive regulation of canonical Wnt signaling pathway | 4 | 0.00237 |
| GO:0060349–bone morphogenesis | 5 | 0.00366 |
| GO:0030316–osteoclast differentiation | 7 | 0.00482 |
| GO:0001503–ossification | 5 | 0.00578 |
| GO:0031100–organ regeneration | 5 | 0.00764 |
| GO:0016477–cell migration | 7 | 0.0103 |
| GO:0060070–canonical Wnt signaling pathway | 4 | 0.0156 |
| GO:0030111–regulation of Wnt receptor signaling pathway | 4 | 0.0211 |
| GO:0030278–regulation of ossification | 3 | 0.0225 |
| GO:0051216–cartilage development | 4 | 0.0241 |
| GO:0007218–neuropeptide signaling pathway | 3 | 0.0273 |
| GO:0007266–Rho protein signal transduction | 3 | 0.0288 |
| GO:0030282–bone mineralization | 4 | 0.0304 |
| GO:0046578–regulation of Ras protein signal transduction | 3 | 0.0417 |
Abbreviation: GO, gene ontology.
Table 5.
List of differentially expressed genes (P<0.05) belonging to functionally relevant GO terms (positive value indicates upregulated genes)
| Gene symbol | Gene name | Fold change |
|---|---|---|
|
| ||
| Skeletal development | ||
| Acan | Aggrecan 1 | 6.1 |
| Axin2 | Axin2 | 4.3 |
| Bglap | Bone γ-carboxyglutamate(gla) protein (osteocalcin) | 3.4 |
| Bmp2 | Bone morphogenetic protein 2 | 2.7 |
| Bmpr1a | Bone morphogenetic protein receptor, type IA | 3.6 |
| COL1A2 | Procollagen, type, 1 α2 | 2.8 |
| COL3A1 | Collagen, type XIII, α1 | 3.1 |
| DMP1 | Dentin matrix protein 1 | 12.4 |
| Jund | Jun D proto-oncogene | 2.2 |
| Hoxc10 | Homeo box C10 | −3.2 |
| Mmp8 | Matrix metallopeptidase 8 | 3.1 |
| Runx2 | Runt-related transcription factor 2 | 6.3 |
| Sox6 | Sry-box containing gene 6 | 3.9 |
| Sp1 | Sp1 transcription factor | 2.8 |
| Igf2 | Insulin-like growth factor 2 | 3.7 |
| Wnt5a | Wingless-type MMTV integration site family, member 5A | 4.7 |
| Zfand5 | Zinc finger, AN1-type domain | 2.1 |
| Wnt signaling pathway | ||
| Apc2 | Adenomatous polyposis coli | 2.3 |
| Axin2 | Axin2 | 4.3 |
| Ccnd1 | Cyclin D1 | 2.4 |
| Dkk1 | Dickkopf1 homolog (Xenopus laevis ) | 3.4 |
| Dvl1 | Disheveled, dsh homologue 1 (Drosophila) | 2.2 |
| Fzd1 | Frizzled-1 | 2.6 |
| Fzd6 | Frizzled-6 | 3.2 |
| Lrp5 | Low-density lipoprotein receptor-related protein 5 | 2.8 |
| Nfat5 | Nuclear factor of activated T-cells 5 | 2.4 |
| Ppp3ca | Protein phosphatase 3 (formerly 2B), catalytic subunit, a-isoform | 3.1 |
| Tcf3 | Transcription factor 3 | 2.1 |
| Sfr4 | Secreted frizzled-related protein 4 | 2.3 |
| Wnt5a | Wingless-type MMTV integration site family, member 5A | 5.7 |
| Wif1 | Wnt inhibitory factor 1 | −3.1 |
Abbreviation: GO, gene ontology.
Wnt5a, β-catenin, and Axin2 protein expressions by immunohistochemical analysis
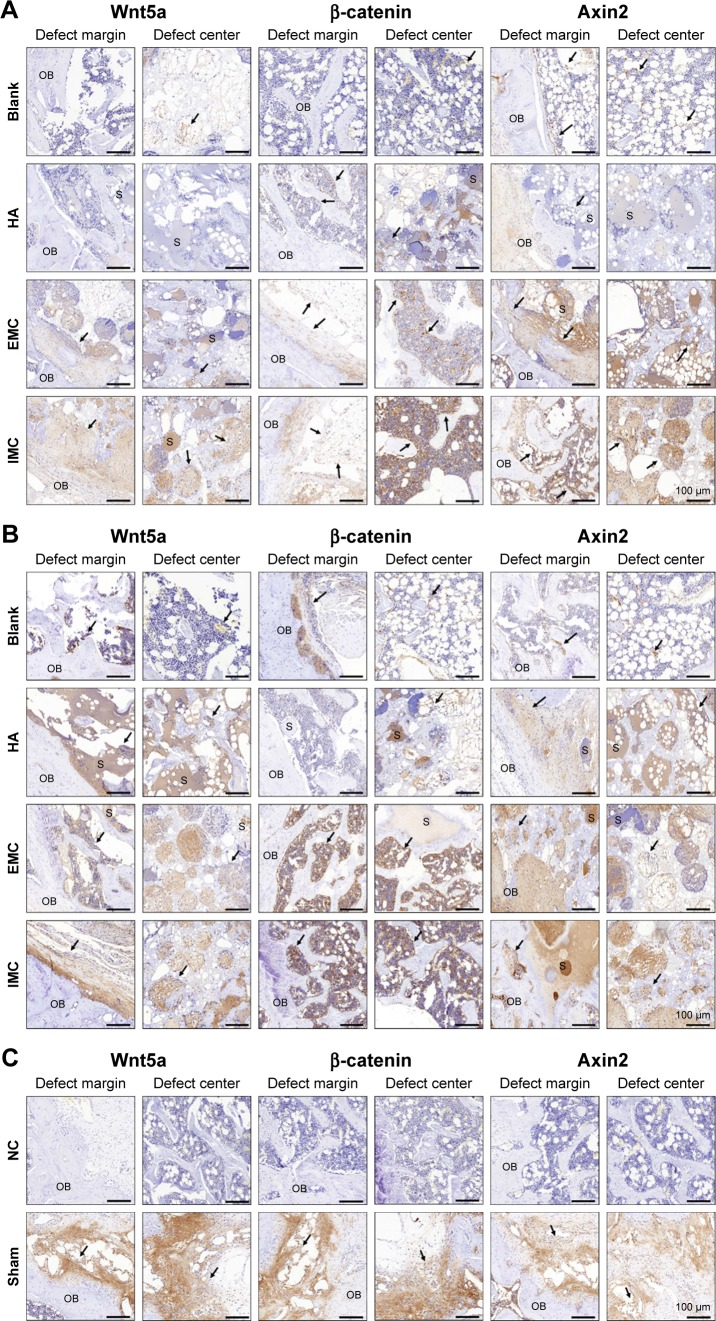
Wnt5a, β-catenin, and Axin2 expressions were the most evident in the sham surgery group, while almost no positively stained cells were observed in the negative control group. Furthermore, more positive Wnt5a-, β-catenin-, and Axin2-stained cells were detected in the IMC group compared with the other groups, both at 7 and 14 days (Figure 5 and Table 6).
Figure 5.
Immunohistochemical analysis of positively stained cells in the defect regions of different groups.
Notes: (A) At day 7. (B) At day 14. (C) The sham surgery group without primary antibody was used as a NC. Black arrows indicate positively stained cells.
Abbreviations: EMC, extrafibrillar mineralized collagen; HA, nano-hydroxyapatite; IMC, intrafibrillar mineralized collagen; NC, negative control; OB, old bone; S, scaffold materials.
Table 6.
Immunohistochemical analysis of positively stained cells in the defects region
| Blank | HA | EMC | IMC | Sham | |
|---|---|---|---|---|---|
|
| |||||
| Wnt5a | |||||
| – | +++++ | ||||
| 7 days | + | + | ++ | +++ | |
| 14 days | + | ++ | +++ | ++++ | |
| β-Catenin | |||||
| – | +++++ | ||||
| 7 days | + | + | ++ | +++ | |
| 14 days | + | + | +++ | ++++ | |
| Axin2 | |||||
| – | +++++ | ||||
| 7 days | + | + | +++ | +++ | |
| 14 days | + | ++ | +++ | ++++ | |
Notes: +, 1–100 cells/mm2; ++, 101–200 cells/mm2; +++, 201–400 cells/mm2; ++++, 401–800 cells/mm2; +++++, >800 cells/mm2.
Abbreviations: EMC, extrafibrillar mineralized collagen; HA, nano-hydroxyapatite; IMC, intrafibrillar mineralized collagen.
Verification of osteogenic potential of rBMSCs on different materials
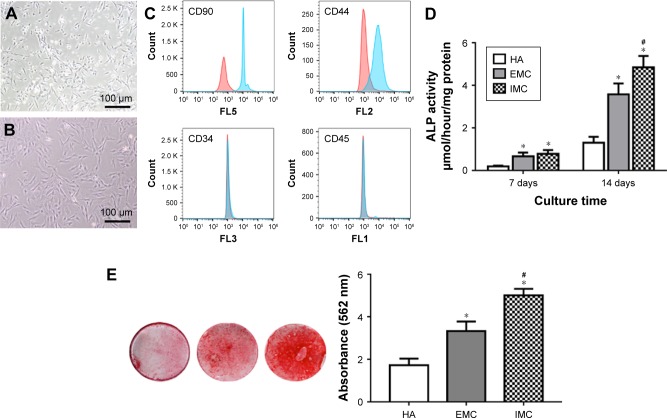
The rBMSCs in this study typically demonstrated a CD90+, CD44+, CD34−, and CD45− immunophenotype (Figure 6A–C). The ALP activity of cells was higher in the IMC group (P<0.05), compared with the HA and EMC groups after coculture for 7 days (Figure 6D). According to the ARS staining results, calcium deposition in the IMC group was evidently promoted after coculture for 21 days, compared with that in the HA and EMC groups (P<0.05; Figure 6E).
Figure 6.
In vitro osteogenic differentiation capacity of rBMSCs on different materials.
Notes: (A) Primary rBMSCs. (B) rBMSCs of passage 3. (C) Flow cytometric analysis of rBMSCs. (D) ALP activity assay after coculture for 7 and 14 days. (E) ARS staining of rBMSCs cultured on HA, EMC, and IMC for 21 days. *P<0.05 vs HA, #P<0.05 vs EMC.
Abbreviations: ALP, alkaline phosphatase; ARS, alizarin red S; EMC, extrafibrillar mineralized collagen; HA, nano-hydroxyapatite; IMC, intrafibrillar mineralized collagen; rBMSCs, rat bone marrow-derived mesenchymal stem cells.
mRNA expressions of Wnt5a, β-catenin, and Axin2
The mRNA expression levels of Wnt5a, β-catenin, and Axin2 were measured by qRT-PCR. It was shown that a consistent pattern of expression for all these genes was found, with the highest level of expression in response to IMC, followed by EMC and HA, both at days 3 and 7 (P<0.05; Figure 7).
Figure 7.
qRT-PCR for specific gene expression.
Notes: Fold change in expression of Wnt5a, β-catenin, and Axin2 on different materials after coculture for 3 and 7 days. *P<0.05 vs HA, #P<0.05 vs EMC.
Abbreviations: EMC, extrafibrillar mineralized collagen; HA, nano-hydroxyapatite; IMC, intrafibrillar mineralized collagen; qRT-PCR, quantitative real-time transcription polymerase chain reaction.
Evaluation of rBMSCs on IMC scaffolds with the Wnt signaling pathway inhibitor Dkk1
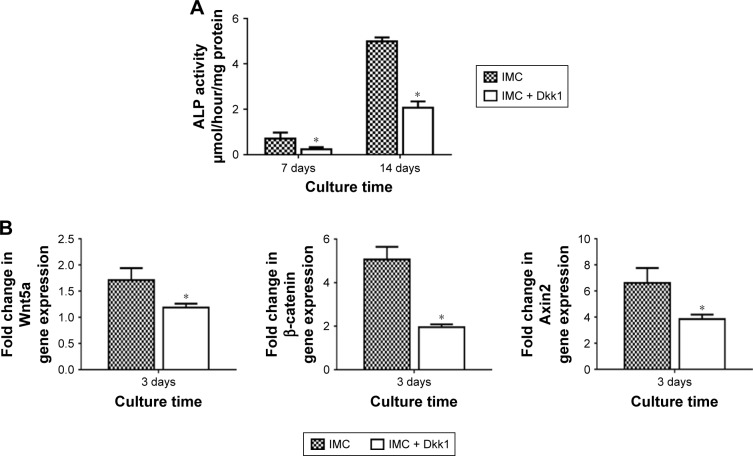
ALP activity was significantly decreased with Dkk1 in the IMC group at both 7 and 14 days (P<0.05). Furthermore, the expression levels of Wnt5a, β-catenin, and Axin2 were all significantly decreased at day 3 after coculture with Dkk1 (P<0.05; Figure 8).
Figure 8.
Evaluation of rBMSCs on IMC scaffolds with the Wnt signaling pathway inhibitor Dkk1.
Notes: (A) ALP activity assay at days 7 and 14. (B) Fold change in expression of Wnt5a, β-catenin, and Axin2 at day 3. *P<0.05 vs IMC.
Abbreviations: ALP, alkaline phosphatase; Dkk1, Dickkopf-1; IMC, intrafibrillar mineralized collagen; rBMSCs, rat bone marrow-derived mesenchymal stem cells.
Discussion
In order to develop a promising bone scaffold material that imitates natural bone in terms of both structure and biological properties, it is critical to design scaffolds with nano- and microstructures similar to that of natural bone.1,2 The IMC scaffold materials utilized in this study were fabricated by the biomimetic strategy, showing a bone-like nanostructure. This is ascribed to the critical role of dual sequestration and nucleation analogs of noncollagenous proteins in recapitulating the hierarchical apatite arrangement within collagen fibrils.5,10 Meanwhile, the EMC scaffold materials, which were prepared by the conventional crystallization method, displayed a structure in which apatite was deposited around the fibrils randomly. Our findings are consistent with previous studies performed by our group and others.4,5,10
In the present study, to assess the effects of different scaffold materials on bone regeneration, critical-sized defects were created in Sprague Dawley rat femurs with different materials grafted into them. After 10 weeks of grafting, µ-CT and HE staining analyses showed that the defects were almost entirely filled with regenerated bone in the IMC group, even at the center of the defect. This finding can be explained by the fact that the nanostructure of IMC promotes nutrients, blood supply, and osteogenic cell transfer throughout the scaffold. In comparison with the IMC group, less regenerated bone was found in the EMC and HA groups. In addition, in the group without any graft, the defect region was primarily filled with fibrous tissue with only a little new bone formation at the margin, indicating a reliable animal model. In the absence of such bone-like nanostructure, cells can only be attached to the outer margin of the scaffold, which blocks the penetration of nutrients, blood vessels, and osteogenic cells into the center of the scaffold, leading to a necrotic core.
The underlying mechanisms during this IMC-GBR process were further evaluated by the microarray technique. This technique has been applied to determine the gene expression profile and to elucidate the biological mechanisms in multiple cells or tissues, thus identifying the conserved development and regeneration processes. In our current study, 7 and 14 days were selected as the time points to explore the biological mechanisms taking place during the early regenerative process. This is a crucial period in the regenerative process for both early response mechanisms and the subsequent events involved in the initiation of osteogenesis within the defect. The selected time points are supported by the results, showing that the osteogenesis for new bones is significantly activated during this period.
At day 7, genes related to inflammatory and immune responses as well as angiogenesis were found to be overexpressed. This finding is consistent with the results from some similarly designed microarray studies of fracture healing13,14 and GBR.15–17 The function of the immunoinflammatory response in bone regeneration is not fully clarified. It has been reported that regulation of this response may result in improved bone regeneration outcomes.18 Therefore, the exact function of the immunoinflammatory response during bone regeneration requires further studies, and it may represent a therapeutic target. The upregulation of angiogenic processes is not surprising as blood vessel formation is a well-known requirement for bone regeneration. Angiogenic factors may interact with osteogenic cells to facilitate bone formation.19,20 Thus, during the regenerative process, the nanostructure and topography of IMC may influence angiogenesis within the regeneration site. At day 14, the transcriptional profile is characteristic of a regenerating bone defect with the activation of a series of osteogenesis-related processes, including osteoclast and osteoblast differentiation, ossification, bone mineralization, and morphogenesis. Genes related to bone ECM (osteocalcin, Dmp1, collagen I, and collagen XIII), osteogenesis-related growth and differentiation factors (Bmp2), and transcriptional regulators of osteoblast function (Runx2, Sox6) were all upregulated. These findings are also consistent with the increased osteogenesis-related gene expression in bone fracture healing and GBR models at this time point.14,15,17 Furthermore, neurogenesis-related genes were upregulated, accompanied with the osteogenic process. This finding is also consistent with some microarray studies of GBR models,15,17 whereby neurogenesis-related gene expression was found to be prominent during the regenerative process. Although this gene expression may reflect different rates of nerve fiber regeneration within the defect, some studies of neuropeptide modulation of osteoblast differentiation indicate that neurogenesis-related genes may take an active role in enhancing bone regeneration.21–23
The Wnt signaling pathway, which is well known to play an active role in the various stages of osteogenesis,24,25 was the major pathway that was differentially regulated in this study. The full range of signaling factors, including ligands (Wnt5a), receptors (Fzd1, Fzd6, and Lrp5), cytoplasmic signal transduction molecules (Apc2, Dvl, and Pp3ca), nuclear transcription factors (Tcf3), transcription factors (Nfat5), and antagonists (Axin2 and Wif1) were differentially expressed. Furthermore, the Ras and Rho signaling pathways, which interact with the Wnt pathway, were also found to be upregulated. Both these pathways are associated with osteogenesis. Rho is a downstream modulator of Wnt signaling,24 while Ras– MAPK signaling is related to osteoblast differentiation.26,27 The Wnt signaling pathway seems to play a central role in regulating this IMC-GBR. The effects of Wnt signaling pathways in IMC-GBR were further investigated in an effort to find possible molecular mechanisms for promoting bone regeneration. Wnt5a is one of the most important Wnt protein members and was found to be upregulated in our study, with a higher fold change. Axin2 has been demonstrated to be the most precise reporter in the Wnt pathway as it is a direct target gene of Wnt ligand binding and activation of the Wnt pathway.28,29 β-catenin is also a crucial member of the Wnt/β-catenin pathway, although its expression is not directly linked to activation of the Wnt pathway per se, but rather from posttranslational modifications that inhibit its cytoplasmic degradation as the result of the upstream activation of the pathway.30,31 Dkk1 is a member of the Dickkopf family, which can inhibit the canonical Wnt signaling pathway by preventing formation of the Wnt–Fzd–Lrp complex.32,33 In this study, IMC bone scaffolds had the effect of significantly upregulating the expression of Wnt-related factors (Wnt5a, β-catenin, and Axin2), both in vivo and in vitro, compared with the HA and EMC scaffolds. It was also shown that with the addition of Dkk1, the osteogenic differentiation capacity and the expression of Wnt-related factors of rBMSCs were significantly decreased. It appears fair to speculate that the underlying mechanism behind the enhanced bone regeneration in the presence of IMC scaffolds may be directly linked to activation of the Wnt signaling pathway.
This study demonstrated insight into the multiple biological mechanisms involved in IMC-GBR; however, there were some limitations. Particularly, it was difficult to fully identify the temporal and spatial characteristics of the transcriptional profile. First, only two time points were chosen, so the results can only be clarified in the context of overexpressed genes between these two time points. Additionally, the harvested tissue comprised various cell types, making it impractical to attribute a specific molecular mechanism to an individual cell type and difficult to localize the source of the gene expression within the defects. In order to modify the IMC scaffolds for functional bone regeneration, further identification of the specific gene functions in the regenerative process in future investigations will be considered. In addition, earlier and later time points should also be analyzed.
Conclusion
IMC bone scaffold materials can significantly enhance bone regeneration through activation of Wnt signaling pathways. This investigation suggests that IMC scaffolds can provide an ideal microenvironment to regulate osteogenic cell differentiation and to improve bone regeneration with a nanostructure similar to native bone. Therefore, IMC scaffolds have potential for use in bone tissue engineering applications. Although analysis of the underlying molecular mechanisms was preliminary and further investigations are still required, this study enhanced our knowledge of the factors required for IMC-GBR and provided us with targets for promoting bone regeneration.
Acknowledgments
This study was supported by the National Natural Science Foundation of China (81570998), the Research Grants (15411950300) from Science and Technology Commission of Shanghai Municipality and the China Postdoctoral Science Foundation (2018M642051).
Footnotes
Disclosure
Zhen Zhang and Zheyi Li are co-first authors. The authors report no conflicts of interest in this work.
References
- 1.Dinopoulos H, Dimitriou R, Giannoudis PV. Bone graft substitutes: what are the options? Surgeon. 2012;10(4):230–239. doi: 10.1016/j.surge.2012.04.001. [DOI] [PubMed] [Google Scholar]
- 2.Kim HD, Amirthalingam S, Kim SL, Lee SS, Rangasamy J, Hwang NS. Biomimetic materials and fabrication approaches for bone tissue engineering. Adv Healthc Mater. 2017;6(23):1700612. doi: 10.1002/adhm.201700612. [DOI] [PubMed] [Google Scholar]
- 3.Qiu ZY, Cui Y, Tao CS, et al. Mineralized collagen: rationale, current status, and clinical applications. Materials (Basel) 2015;8(8):4733–4750. doi: 10.3390/ma8084733. [DOI] [PMC free article] [PubMed] [Google Scholar]
- 4.Liu Y, Liu S, Luo D, et al. Hierarchically staggered nanostructure of mineralized collagen as a bone-grafting scaffold. Adv Mater. 2016;28(39):8740–8748. doi: 10.1002/adma.201602628. [DOI] [PubMed] [Google Scholar]
- 5.Liao SS, Cui FZ, Zhang W, Feng QL. Hierarchically biomimetic bone scaffold materials: nano-HA/collagen/PLA composite. J Biomed Mater Res Part B Appl Biomater. 2004;69(2):158–165. doi: 10.1002/jbm.b.20035. [DOI] [PubMed] [Google Scholar]
- 6.Hu C, Zilm M, Wei M. Fabrication of intrafibrillar and extrafibrillar mineralized collagen/apatite scaffolds with a hierarchical structure. J Biomed Mater Res A. 2016;104(5):1153–1161. doi: 10.1002/jbm.a.35649. [DOI] [PubMed] [Google Scholar]
- 7.Xu SJ, Qiu ZY, Wu JJ, et al. Osteogenic differentiation gene expression profiling of hMSCs on hydroxyapatite and mineralized collagen. Tissue Eng Part A. 2016;22(1–2):170–181. doi: 10.1089/ten.tea.2015.0237. [DOI] [PubMed] [Google Scholar]
- 8.Wang YF, Wang CY, Wan P, Wang SG, Wang XM. Comparison of bone regeneration in alveolar bone of dogs on mineralized collagen grafts with two composition ratios of nano-hydroxyapatite and collagen. Regen Biomater. 2016;3(1):33–40. doi: 10.1093/rb/rbv025. [DOI] [PMC free article] [PubMed] [Google Scholar]
- 9.Fu Y, Liu S, Cui SJ, et al. Surface chemistry of nanoscale mineralized collagen regulates periodontal ligament stem cell fate. ACS Appl Mater Interfaces. 2016;8(25):15958–15966. doi: 10.1021/acsami.6b04951. [DOI] [PubMed] [Google Scholar]
- 10.Liu Y, Luo D, Liu S, et al. Effect of nanostructure of mineralized collagen scaffolds on their physical properties and osteogenic potential. J Biomed Nanotechnol. 2014;10(6):1049–1060. doi: 10.1166/jbn.2014.1794. [DOI] [PubMed] [Google Scholar]
- 11.Lian K, Lu H, Guo X, Cui F, Qiu Z, Xu S. The mineralized collagen for the reconstruction of intra-articular calcaneal fractures with trabecular defects. Biomatter. 2013;3(4):e27250. doi: 10.4161/biom.27250. [DOI] [PMC free article] [PubMed] [Google Scholar]
- 12.Benjamini Y, Drai D, Elmer G, Kafkafi N, Golani I. Controlling the false discovery rate in behavior genetics research. Behav Brain Res. 2001;125(1–2):279–284. doi: 10.1016/s0166-4328(01)00297-2. [DOI] [PubMed] [Google Scholar]
- 13.Rundle CH, Wang H, Yu H, et al. Microarray analysis of gene expression during the inflammation and endochondral bone formation stages of rat femur fracture repair. Bone. 2006;38(4):521–529. doi: 10.1016/j.bone.2005.09.015. [DOI] [PubMed] [Google Scholar]
- 14.Bais M, McLean J, Sebastiani P, et al. Transcriptional analysis of fracture healing and the induction of embryonic stem cell-related genes. PLoS One. 2009;4(5):e5393. doi: 10.1371/journal.pone.0005393. [DOI] [PMC free article] [PubMed] [Google Scholar]
- 15.Al-Kattan R, Retzepi M, Calciolari E, Donos N. Microarray gene expression during early healing of GBR-treated calvarial critical size defects. Clin Oral Implants Res. 2017;28(10):1248–1257. doi: 10.1111/clr.12949. [DOI] [PubMed] [Google Scholar]
- 16.Donos N, Retzepi M, Wall I, Hamlet S, Ivanovski S. In vivo gene expression profile of guided bone regeneration associated with a microrough titanium surface. Clin Oral Implants Res. 2011;22(4):390–398. doi: 10.1111/j.1600-0501.2010.02105.x. [DOI] [PubMed] [Google Scholar]
- 17.Ivanovski S, Hamlet S, Retzepi M, Wall I, Donos N. Transcriptional profiling of “guided bone regeneration” in a critical-size calvarial defect. Clin Oral Implants Res. 2011;22(4):382–389. doi: 10.1111/j.1600-0501.2010.02104.x. [DOI] [PubMed] [Google Scholar]
- 18.Kolar P, Schmidt-Bleek K, Schell H, et al. The early fracture hematoma and its potential role in fracture healing. Tissue Eng Part B Rev. 2010;16(4):427–434. doi: 10.1089/ten.TEB.2009.0687. [DOI] [PubMed] [Google Scholar]
- 19.Portal-Núñez S, Lozano D, Esbrit P. Role of angiogenesis on bone formation. Histol Histopathol. 2012;27(5):559–566. doi: 10.14670/HH-27.559. [DOI] [PubMed] [Google Scholar]
- 20.Kanczler JM, Oreffo RO. Osteogenesis and angiogenesis: the potential for engineering bone. Eur Cell Mater. 2008;15:100–114. doi: 10.22203/ecm.v015a08. [DOI] [PubMed] [Google Scholar]
- 21.Nunes AF, Liz MA, Franquinho F, et al. Neuropeptide Y expression and function during osteoblast differentiation – insights from transthyretin knockout mice. FEBS J. 2010;277(1):263–275. doi: 10.1111/j.1742-4658.2009.07482.x. [DOI] [PubMed] [Google Scholar]
- 22.Yahara M, Tei K, Tamura M. Inhibition of neuropeptide Y Y1 receptor induces osteoblast differentiation in MC3T3-E1 cells. Mol Med Rep. 2017;16(3):2779–2784. doi: 10.3892/mmr.2017.6866. [DOI] [PubMed] [Google Scholar]
- 23.Franquinho F, Liz MA, Nunes AF, Neto E, Lamghari M, Sousa MM. Neuropeptide Y and osteoblast differentiation – the balance between the neuro-osteogenic network and local control. FEBS J. 2010;277(18):3664–3674. doi: 10.1111/j.1742-4658.2010.07774.x. [DOI] [PubMed] [Google Scholar]
- 24.Ling L, Nurcombe V, Cool SM. Wnt signaling controls the fate of mesenchymal stem cells. Gene. 2009;433(1–2):1–7. doi: 10.1016/j.gene.2008.12.008. [DOI] [PubMed] [Google Scholar]
- 25.Day TF, Guo X, Garrett-Beal L, Yang Y. Wnt/beta-catenin signaling in mesenchymal progenitors controls osteoblast and chondrocyte differentiation during vertebrate skeletogenesis. Dev Cell. 2005;8(5):739–750. doi: 10.1016/j.devcel.2005.03.016. [DOI] [PubMed] [Google Scholar]
- 26.Schindeler A, Little DG. Ras-MAPK signaling in osteogenic differentiation: friend or foe? J Bone Miner Res. 2006;21(9):1331–1338. doi: 10.1359/jbmr.060603. [DOI] [PubMed] [Google Scholar]
- 27.Feng L, Xue D, Chen E, et al. HMGB1 promotes the secretion of multiple cytokines and potentiates the osteogenic differentiation of mesenchymal stem cells through the Ras/MAPK signaling pathway. Exp Ther Med. 2016;12(6):3941–3947. doi: 10.3892/etm.2016.3857. [DOI] [PMC free article] [PubMed] [Google Scholar]
- 28.Yu HM, Jerchow B, Sheu TJ, et al. The role of Axin2 in calvarial morphogenesis and craniosynostosis. Development. 2005;132(8):1995–2005. doi: 10.1242/dev.01786. [DOI] [PMC free article] [PubMed] [Google Scholar]
- 29.Lohi M, Tucker AS, Sharpe PT. Expression of Axin2 indicates a role for canonical Wnt signaling in development of the crown and root during pre-and postnatal tooth development. Dev Dyn. 2010;239(1):160–167. doi: 10.1002/dvdy.22047. [DOI] [PubMed] [Google Scholar]
- 30.Huelsken J, Birchmeier W. New aspects of Wnt signaling pathways in higher vertebrates. Curr Opin Genet Dev. 2001;11(5):547–553. doi: 10.1016/s0959-437x(00)00231-8. [DOI] [PubMed] [Google Scholar]
- 31.Barker N. The canonical Wnt/beta-catenin signalling pathway. Methods Mol Biol. 2008;468:5–15. doi: 10.1007/978-1-59745-249-6_1. [DOI] [PubMed] [Google Scholar]
- 32.Olivares-Navarrete R, Hyzy S, Wieland M, Boyan BD, Schwartz Z. The roles of Wnt signaling modulators Dickkopf-1 (Dkk1) and Dickkopf-2 (Dkk2) and cell maturation state in osteogenesis on microstructured titanium surfaces. Biomaterials. 2010;31(8):2015–2024. doi: 10.1016/j.biomaterials.2009.11.071. [DOI] [PMC free article] [PubMed] [Google Scholar]
- 33.Morvan F, Boulukos K, Clément-Lacroix P, et al. Deletion of a single allele of the Dkk1 gene leads to an increase in bone formation and bone mass. J Bone Miner Res. 2006;21(6):934–945. doi: 10.1359/jbmr.060311. [DOI] [PubMed] [Google Scholar]


