
Figure 1.
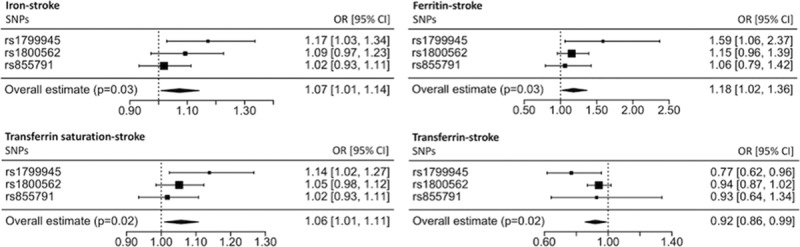
Main Mendelian randomization (MR) analysis estimates for each of the 4 biomarkers of iron status. The squares represent the individual single-nucleotide polymorphism (SNP) MR estimate, with their size proportional to the precision of the estimate and the 95% CIs represented by the horizontal lines. The diamonds represent the pooled SNP MR estimate, with the width indicating the 95% CIs. OR indicates odds ratio.