Abstract
Increasing fetal hemoglobin (HbF) levels in adult red blood cells provides clinical benefit to patients with sickle cell disease and some forms of β-thalassemia.To identify potentially druggable HbF regulators in adult human erythroid cells, we employed a protein kinase domain–focused CRISPR-Cas9–based genetic screen with a newly optimized single-guide RNA scaffold. The screen uncovered the heme-regulated inhibitor HRI (also known as EIF2AK1), an erythroid-specific kinase that controls protein translation, as an HbF repressor. HRI depletion markedly increased HbF production in a specific manner and reduced sickling in cultured erythroid cells. Diminished expression of the HbF repressor BCL11A accounted in large part for the effects of HRI depletion. Taken together, these results suggest HRI as a potential therapeutic target for hemoglobinopathies.
The human β-globin gene cluster comprises an embryonic [ε-globin (HBE)], two fetal [γ-globin (HBG1 and HBG2)], and two adult-type [δ-globin and β-globin (HBD and HBB)] genes (1). Diseases affecting the adult-type β-globin genes, such as sickle cell disease (SCD) and some types of β-thalassemia, manifest themselves after birth following the transition from fetal to adult hemoglobin production. The clinical course of these diseases is ameliorated when fetal hemoglobin (HbF) levels are elevated because of genetic causes or medical intervention (2). Genome-wide association studies have identified three major loci that are linked to natural variation in HbF levels, including that of the transcription factor BCL11A (1). Patients with heterozygous loss of BCL11A exhibit elevated HbF levels throughout adult life (3), and BCL11A depletion in cultured human erythroid precursors raises HbF production (4, 5). Loss of BCL11A in engineered mice that express human sickle hemoglobin (HbS) stimulates fetal globin expression and ameliorates the disease phenotype (6).
Strategies to achieve long-term elevation of HbF levels in patients include gene therapy to force the expression of γ-globin, as well as gene editing to impede BCL11A expression (7, 8). Current clinical risks, costs, and availability limit such therapies to a fraction of the patient population. The only FDA-approved drug to raise HbF is hydroxyurea, which benefits many patients but is limited in its efficacy (9). Hence, pharmacologic approaches to increase HbF levels are needed.
The transcription factors BCL11A and LRF (ZBTB7A) and their coregulators mediate most of g-globin transcriptional silencing in adult erythroid cells (10). However, transcription factors are inherently challenging to inhibit with small molecules. We carried out a CRISPR-Cas9 screen to target protein kinases because, in principle, protein kinases are inherently controllable by small molecules (11). It has recently been shown that targeting single-guide RNAs (sgRNAs) to functional protein domains can substantially improve genetic screening efficiency, as both inframe and frameshift mutations contribute to generating hypomorphic alleles (12). We designed a library of sgRNAs targeting 482 kinase domains (6 sgRNAs per kinase domain and 50 nontargeting sgRNAs as negative controls), which covers almost all annotated kinases in the human genome (11).
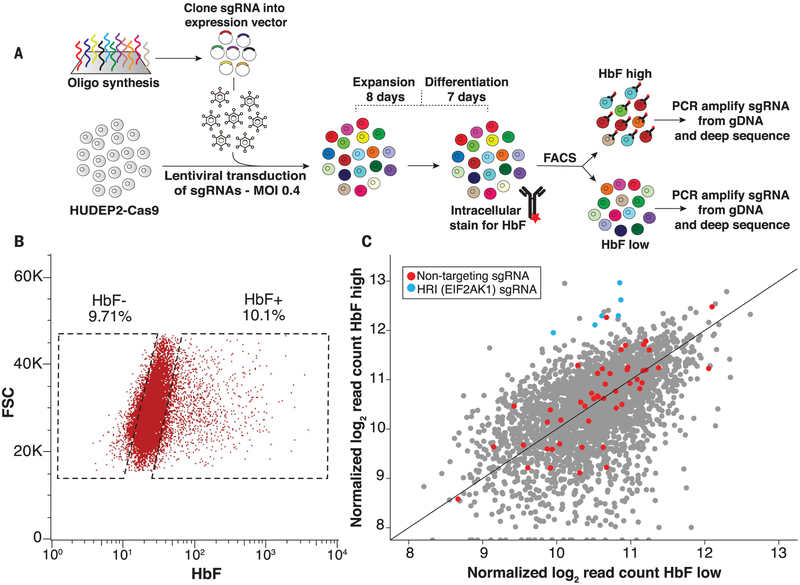
Before performing the screen, we optimized the Streptococcus pyogenes Cas9 sgRNA scaffold for on-target activity (see supplementary text for details). sgRNA2.1 emerged as the most efficient sgRNA in mutagenizing target loci in multiple cell lines, achieving up to 98% genome-editing efficiency as early as 4 days after introduction into cells (figs. S1 and S2). We cloned the kinase domain sgRNA library into the sgRNA2.1 scaffold and introduced it into HUDEP2 cells stably expressing Cas9 (Fig. 1A). HUDEP2 is an immortalized human cell line that can be induced to undergo erythroid differentiation and produce high levels of adult-type and low levels of fetal-type hemoglobins (13). We used anti-HbF fluorescence-activated cell sorting (FACS) to isolate the top 10% and bottom 10% of HbF-expressing cells (Fig. 1, A and B) and deep-sequenced sgRNAs as described previously (14). Nontargeting control sgRNAs were similarly distributed across low- and high-HbF-expression populations, indicating that the screen did not bias the enrichment in either direction (Fig. 1C).
Fig. 1. A kinase domain–focused CRISPR-Cas9 screen identifies HRI as a novel fetal globin repressor.
(A) Experimental outline. See materials and methods for a full description. Oligo, oligonucleotide; MOI, multiplicity of infection; gDNA, genomic DNA. (B) Representative HbF FACS gating strategy for sorting high-HbF and low-HbF populations for screens. FSC, forward scatter; K, thousand. (C) sgRNA representation in low-HbF versus high-HbF populations as log2-transformed normalized read counts.
Heme-regulated inhibitor HRI (also known as EIF2AK1) was the only kinase for which all targeting sgRNAs were overrepresented in the high-HbF population (Fig. 1C). HRI is one of four kinases known to phosphorylate the protein translation initiation factor eIF2α (fig. S3) (15). Phosphorylation of eIF2α generally impedes mRNA translation but enables the translation of transcripts that include one or more upstream open reading frames in their 5′ untranslated regions (15). HRI is enriched in erythroid cells, where it can be inhibited by its natural ligand heme (fig. S4, A and B). It is thought that this regulation balances heme levels with production of globin chains, as excess of either of these can be detrimental (15). The other eIF2α kinases are expressed at significantly lower levels in erythroid cells (fig. S4C). Though small molecules have been developed against other members of the eIF2α kinase family, effective HRI-specific inhibitors are lacking.
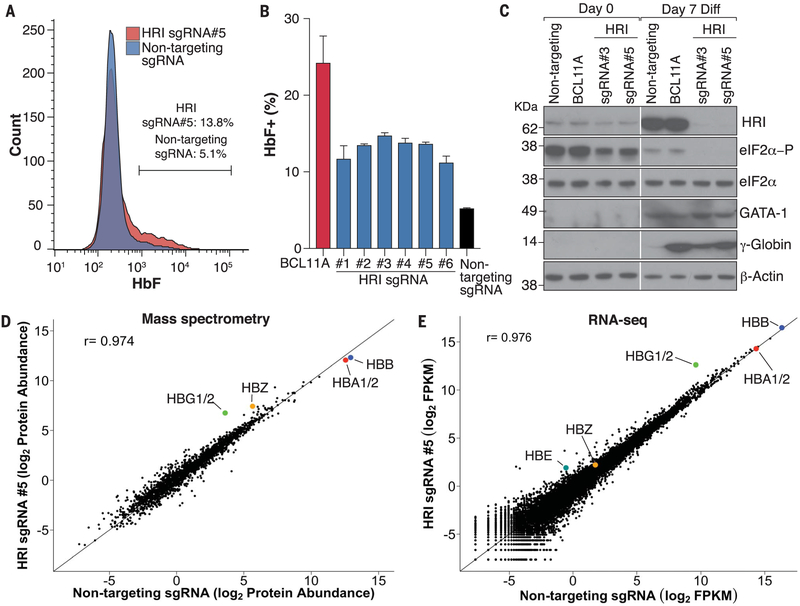
We validated HRI as an HbF regulator by expressing all six “hit” sgRNAs (fig. S5) individually in HUDEP2-Cas9 cells, along with an sgRNA against BCL11A as a benchmark and a nontargeting sgRNA as a negative control. All six HRI-targeting sgRNAs increased the fraction of HbF+ cells (Fig. 2, A and B). We studied cells expressing HRI sgRNAs 3 and 5 by Western blotting, which revealed that the sgRNAs achieved strong depletion of HRI, resulting in decreased eIF2α phosphorylation, and significantly increased γ-globin protein levels (Fig. 2C). There were no changes in GATA1 protein levels, suggesting that HRI loss did not impair cell maturation (Fig. 2C).
Fig. 2. HRI depletion elevates γ-globin in HUDEP2 cells.
(A) Representative HbF FACS for HUDEP2-Cas9 sgRNA pools. (B) Summary of HbF flow cytometry of cells expressing indicated sgRNAs. Data are means ± SD from biological replicates (n = 2). (C) Western blots with antibodies against the indicated proteins in cell pools expressing sgRNAs as indicated. Diff, differentiation. (D) Mass spectrometry for the HRI sgRNA 5 pool from biological replicates (n = 3). Data are log2 mean-normalized protein abundances in cells with HRI sgRNA 5 and nontargeting sgRNA. r is the Pearson correlation coefficient. HBZ, ζ-globin; HBA1/2, α-globins 1 and 2. (E) RNA-seq of cell pools with HRI sgRNA 5. Data are log2 numbers of fragments per kilobase of transcript per million mapped reads (FPKM) averaged from biological replicates (n = 2).
eIF2α phosphorylation is thought to broadly control protein translation, suggesting that HRI inhibition may lead to widespread changes in protein levels and secondary changes in gene expression. We measured protein abundances in undifferentiated and differentiated HRI-depleted HUDEP2 pools for sgRNAs 3 and 5 by replicate whole-cell mass spectrometry studies (fig. S6). Notably, protein amounts were changed relatively little in HRI-depleted differentiated HUDEP2 cells (Fig. 2D and fig. S7), and γ-globin was one of the most induced proteins (Fig. 2D, fig. S7A, and table S1). We did observe a modest rise in global protein levels, perhaps because of a nonspecific augmentation in protein translation resulting from lower eIF2α phosphorylation (fig. S7, A and B). Whole-cell mass spectrometry detected the ~2000 and ~2500 most abundant proteins in differentiated and undifferentiated samples, respectively. Thus, it is possible that significant changes were missed among low-abundance proteins. Nevertheless, overall the effects of HRI depletion were unexpectedly specific for γ-globin.
In parallel, we carried out replicate RNA sequencing (RNA-seq) experiments (fig. S8A) in differentiated HRI-depleted HUDEP2 pools for sgRNAs 3 and 5 and found that global transcript distributions were relatively unperturbed (Fig. 2E). γ-Globin mRNA stood out as the most significantly induced in differentiated cells (Fig. 2E, fig. S8B, and table S1). Reverse transcription quantitative polymerase chain reaction (RT-qPCR) experiments confirmed the effects on γ-globin mRNA and primary transcripts, suggesting that HRI depletion increases γ-globin transcription (fig. S9, A and B). We did not observe any noticeable changes in α-globin, ALAS2, BAND3, and GATA1 mRNAs (fig. S9C), suggesting that erythroid differentiation is essentially normal in HRI-deficient cells. These results were further validated in two independent clonal HRI-depleted cell lines generated from the HRI sgRNA 5 pool (fig. S10).
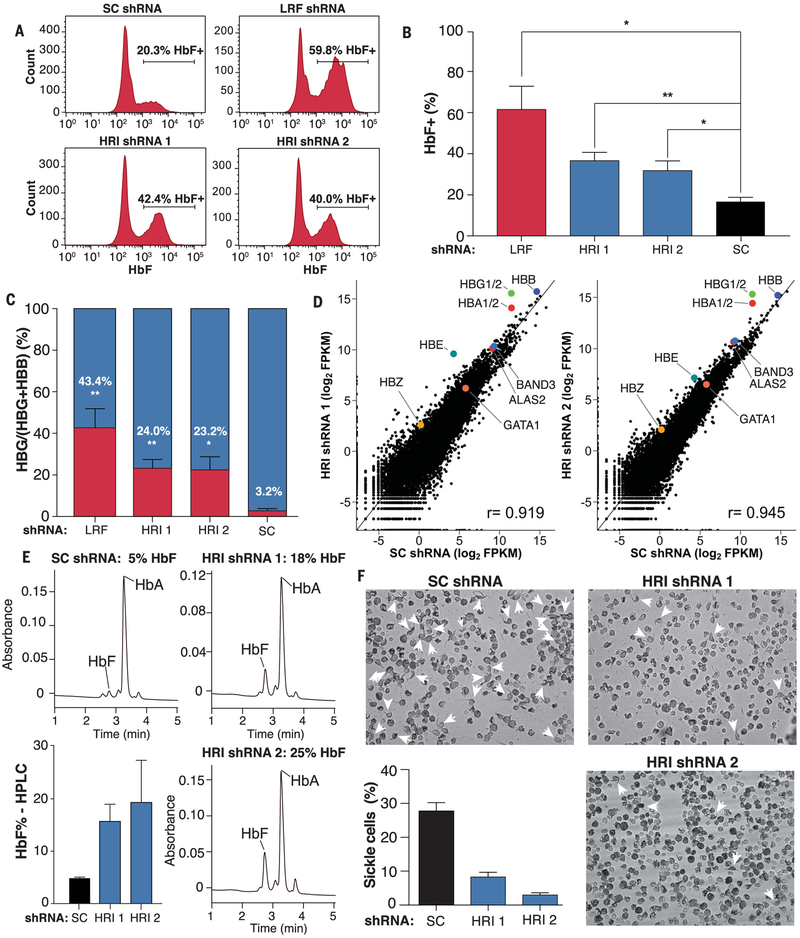
HRI’s role as an HbF repressor was further tested in primary erythroblasts derived from a three-phase human CD34+ culture system (see materials and methods). We depleted HRI with two independent short hairpin RNAs (shRNAs). For comparison, we used the stronger shRNA against LRF among two previously described (10). We verified transduction levels by green fluorescent protein (GFP) flow cytometry (fig. S11A). Both HRI shRNAs significantly increased the proportion of HbF+ cells (Fig. 3, A and B). The proportion of γ-globin mRNA as a percentage of total globin transcripts was also significantly increased upon HRI knockdown (Fig. 3C).
Fig. 3. HRI depletion elevates γ-globin in primary erythroid CD34+ cells.
(A) Representative HbF flow cytometry on day 15 of CD34+ erythroid differentiation. SC, sickle cell. (B) Summary of HbF flow cytometry experiments. Error bars represent SEM from three independent donors (*P < 0.05, **P < 0.01 from unpaired Student t tests). (C) γ-Globin mRNA as a fraction of γ-globin plus β-globin by RT-qPCR on day 13. Error bars represent SEM from three independent donors (*P < 0.05, **P < 0.01 from unpaired Student t tests). (D) RNA-seq for CD34+ cells on day 13. r is the Pearson correlation coefficient. Data were obtained from one patient donor. (E) HPLC analysis of samples from cells expressing annotated shRNAs at day 15 of differentiation. HbA, hemoglobin A (adult form). Error bars represent SD from two independent donors. (F) Images of sickle cell patient–derived erythroid cultures. Arrowheads mark cells with sickle-like morphology. The bar graph summarizes blind counts of sickle-shaped cells in three fields from one patient with SCD.
RNA-seq in cells with either shRNA demonstrated that γ-globin mRNA was among the most strongly increased (Fig. 3D), similar to the results in HUDEP2 cells, with global transcript distributions for HRI knockdown samples being strongly correlated with those from the scrambled shRNA (Fig. 3D). Similar elevation of HbF was detected at the protein level, as measured by high-performance liquid chromatography (HPLC) (Fig. 3E; note donor-to-donor variation in the human culture system). HRI depletion did not appear to delay the maturation of these cells, as evidenced by similar transcript levels for maturation markers (Fig. 3D) and cell surface markers CD71 and CD235a (fig. S11B) and similar cell morphologies (fig. S11C).
Elevated HbF levels counteract sickling of cells expressing HbS (1). To assess whether HRI depletion elicits antisickling effects, we knocked down HRI in CD34+ cells obtained from patients with SCD (fig. S12A). This led to increases in γ-globin levels comparable to those in the CD34+ cultures from healthy donors mentioned above (fig. S12, B and C) and, as before, did not seem to affect erythroid maturation (fig. S12D). When grown under low oxygen tension, cells expressing HRI shRNAs were less prone to sickling than controls (Fig. 3F), suggesting that HRI depletion may achieve therapeutically relevant levels of HbF.
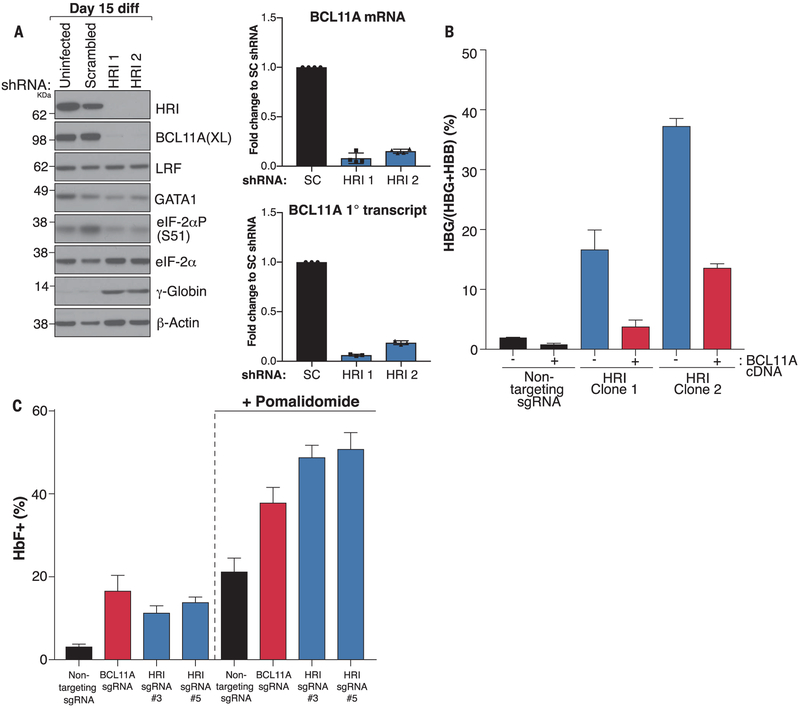
BCL11A and LRF are the major direct repressors of γ-globin transcription (10), suggesting that the effects of HRI may converge on one or both of these factors, as they are expressed during overlapping time intervals of erythroid maturation (fig. S13). We examined BCL11A and LRF protein levels by Western blotting with extracts from CD34+ cell-derived erythroblasts expressing HRI shRNAs. Notably, BCL11A but not LRF was strongly depleted in both HRI knockdown samples (Fig. 4A). Western blots confirmed the loss of HRI, the resulting reduction in phospho-eIF2α, and the increase in γ-globin (Fig. 4A). GATA1 was unaffected, in agreement with ostensibly normal cell maturation under conditions of HRI depletion.
Fig. 4. HRI regulates BCL11A levels.
(A) (Left) Western blot with the indicated antibodies in uninfected cells or cells infected with virus expressing scrambled or HRI shRNAs on day 15 of differentiation. (Right) BCL11A mRNA (n = 4 independent donors) and primary (1°) transcript (n = 3 independent donors) levels in HRI knockdown cells as a fraction of those in SC shRNA–expressing cells. Error bars represent SD from biological replicates. (B) BCL11A complementary DNA (cDNA) rescue in HRI-depleted HUDEP2 clonal cell lines. Data show RT-qPCR for γ-globin as a fraction of γ-globin plus β-globin. Error bars indicate SD from two biological replicates (C) HbF flow cytometry of indicated HUDEP2 sgRNA pools grown in the presence or absence of pomalidomide. Error bars indicate SEM of three biological replicates.
We tested whether HRI controls BCL11A levels directly by governing its translation or indirectly—for example, by controlling the translation of a nuclear factor that promotes BCL11A transcription. Both BCL11A mRNA and primary transcript levels were markedly reduced in HRI-depleted cells, indicating that most of the BCL11A loss is a result of transcription inhibition in HRI-depleted primary erythroid cells, HUDEP2 pools, and clonal lines (Fig. 4A and fig. S14). To measure a possible contribution of direct translational control of BCL11A mRNA by HRI, we performed polysome profiling. HRI depletion modestly increased overall translation efficiency, as polysomal fractions were slightly more abundant than monosomes (fig. S15A). Moreover, in HRI-depleted cells, BCL11A mRNA levels were significantly reduced across all polysomal fractions, consistent with an overall loss in mRNA levels (fig. S15B). To better visualize distribution across fractions, results were plotted as a percentage of total BCL11A mRNA, which revealed little shift in the distribution pattern (fig. S15C), suggesting that BCL11A mRNA translation plays only a minor if any role in response to HRI loss. a-Globin mRNAs tended to shift slightly to the larger polysome fractions (to the right), consistent with a subtle increase in their translation (fig. S15C).
To assess to what extent BCL11A loss accounts for the effects of HRI depletion, BCL11A expression was restored in HRI-depleted HUDEP2 clonal cell lines. This reinstated γ-globin repression by 65 to 80% (Fig. 4B and fig. S16), suggesting that BCL11A is a major HRI effector. Of note, depleting HRI in primary definitive (adult-type) erythroid cells from murine fetal livers did not reduce BCL11A levels (fig. S17), suggesting that certain pathways controlled by HRI may be species specific. In sum, BCL11A emerges as an HRI target in the control of HbF production in human adult erythroid cells.
As a proof of principle, we assessed whether HRI’s effects on HbF can be amplified with pharmacologic HbF inducers. Pomalidomide has been recently shown to induce HbF in part by reducing BCL11A transcription (16). We tested the effects of pomalidomide treatment on two HRI-depleted HUDEP2 populations and control HUDEP2 cells. For comparison, we also included HUDEP2 cells in which BCL11A transcription was reduced by an sgRNA targeting the erythroid BCL11A enhancer. These combinations did not impair cell viability or maturation (fig. S18, A to D). All conditions alone elevated the fraction of HbF+ cells and increased γ-globin transcription as expected (Fig. 4C and fig. S18, B, C, and E). The strongest cooperativity was observed when HRI depletion was combined with pomalidomide.
Using an improved CRISPR-Cas9 domain-focused screening approach, we identified the erythroid-specific kinase HRI as a potentially druggable target that is involved in HbF silencing. Our findings contrast with previous reports showing that stabilization of eIF2α phosphorylation with the drug salubrinal can stimulate HbF synthesis in cultured human erythroid cells (17, 18). Salubrinal acts downstream of HRI, and the mechanism underlying the induction of HbF remains to be fully elucidated. Hematopoietic stress can be associated with increased HbF levels. However, we believe that the effects of HRI depletion are not due to stress because HRI depletion seemingly has little adverse effect on cell viability and cell maturation, as judged by cell morphological, surface phenotyping, transcriptome, and proteome analyses. Moreover, silencing of HbF in HRI-depleted cells is largely reversed upon BCL11A reexpression, consistent with a specific function of HRI.
Mice in which the HRI gene has been knocked out appear for the most part normal and have normal hematological indices (19). This finding is in agreement with our results in human erythroid cell cultures and suggests that HRI loss is generally well tolerated. However, HRI mice displayed impaired adaptation to erythropoietic stress induced by iron deficiency and had exacerbated protoporphyria and thalassemia phenotypes (20, 21). It remains to be seen whether HRI inhibition in SCD patients would elevate HbF levels sufficiently to improve outcomes. HRI inhibition elevated HbF levels to a point at which it reduced cell sickling in culture, suggesting that pharmacologic HRI inhibitors may provide clinical benefit in SCD patients. Moreover, in light of our results, combining HRI inhibition with an additional pharmacologic HbF inducer may improve the therapeutic index.
Supplementary Material
ACKNOWLEDGMENTS
This paper is dedicated to the memory of Günter Blobel and his boundless generosity and ability to inspire. We thank C. Vakoc for providing the kinase-focused sgRNA library and members of the lab for helpful discussions. We thank the Children’s Hospital of Philadelphia flow cytometry core for experimental assistance and R. Kurita and Y. Nakamura for contributing the HUDEP2 cells.
Funding: J.D.G. was supported by T32GM008216 and 1F30DK107055-01; B.A.G. by W81XWH-113-1-0426, R01-GM110174, and R01-AI118891; R.C.H. by R56DK065806 and U54HG006998; S.A.L. by R01-HL065449; J.S. by Cold Spring Harbor Laboratory sponsored research; and G.A.B. by 5R01HL119479 and 5R37DK058044.
Footnotes
Competing interests: J.D.G., J.S., and G.A.B. are inventors on a patent (Patent Cooperation Treaty patent application PCT/US18/15918) submitted by The Children’s Hospital of Philadelphia that covers the therapeutic targeting of HRI for hemoglobinopathies.
Data and materials availability: All plasmids and reagents described in this study are available to the scientific community upon request to J.S. and G.A.B. Mass spectrometry data are deposited at https://chorusproject.org (project 1488), and RNA-seq data are available at the NCBI Gene Expression Omnibus (GEO accession number GSE115687).
SUPPLEMENTARY MATERIALS
REFERENCES AND NOTES
- 1.Sankaran VG, Orkin SH, Cold Spring Harb. Perspect Med 3, a011643 (2013). [DOI] [PMC free article] [PubMed] [Google Scholar]
- 2.Platt OS et al. , N. Engl. J. Med 330, 1639–1644 (1994). [DOI] [PubMed] [Google Scholar]
- 3.Basak A et al. , J. Clin. Invest 125, 2363–2368 (2015). [DOI] [PMC free article] [PubMed] [Google Scholar]
- 4.Sankaran VG et al. , Science 322, 1839–1842 (2008). [DOI] [PubMed] [Google Scholar]
- 5.Sankaran VG et al. , Nature 460, 1093–1097 (2009). [DOI] [PMC free article] [PubMed] [Google Scholar]
- 6.Xu J et al. , Science 334, 993–996 (2011). [DOI] [PMC free article] [PubMed] [Google Scholar]
- 7.Perumbeti A et al. , Blood 114, 1174–1185 (2009). [DOI] [PMC free article] [PubMed] [Google Scholar]
- 8.Bauer DE et al. , Science 342, 253–257 (2013). [DOI] [PMC free article] [PubMed] [Google Scholar]
- 9.Bakanay SM et al. , Blood 105, 545–547 (2005). [DOI] [PubMed] [Google Scholar]
- 10.Masuda T et al. , Science 351, 285–289 (2016). [DOI] [PMC free article] [PubMed] [Google Scholar]
- 11.Manning G, Whyte DB, Martinez R, Hunter T, Sudarsanam S, Science 298, 1912–1934 (2002). [DOI] [PubMed] [Google Scholar]
- 12.Shi J et al. , Nat. Biotechnol 33, 661–667 (2015). [DOI] [PMC free article] [PubMed] [Google Scholar]
- 13.Kurita R et al. , PLOS ONE 8, e59890–e15 (2013). [DOI] [PMC free article] [PubMed] [Google Scholar]
- 14.Canver MC et al. , Nature 527, 192–197 (2015). [DOI] [PMC free article] [PubMed] [Google Scholar]
- 15.Chen J-J, Curr. Opin. Hematol 21, 172–178 (2014). [DOI] [PMC free article] [PubMed] [Google Scholar]
- 16.Dulmovits BM et al. , Blood 127, 1481–1492 (2016). [DOI] [PMC free article] [PubMed] [Google Scholar]
- 17.Hahn CK, Lowrey CH, Blood 122, 477–485 (2013). [DOI] [PMC free article] [PubMed] [Google Scholar]
- 18.Hahn CK, Lowrey CH, Blood 124, 2730–2734 (2014). [DOI] [PMC free article] [PubMed] [Google Scholar]
- 19.Han AP et al. , EMBO J. 20, 6909–6918 (2001). [DOI] [PMC free article] [PubMed] [Google Scholar]
- 20.Liu S et al. , Br. J. Haematol 143, 129–137 (2008). [DOI] [PMC free article] [PubMed] [Google Scholar]
- 21.Liu S et al. , Haematologica 93, 753–756 (2008). [DOI] [PMC free article] [PubMed] [Google Scholar]
Associated Data
This section collects any data citations, data availability statements, or supplementary materials included in this article.


