Abstract
Poloidal ultra-low frequency (ULF) waves between 5-10 mHz were observed by multiple satellites and three high-latitude Super Dual Auroral Radar Network (SuperDARN) radars during the recovery phase of a moderate geomagnetic storm on Jan 24-27, 2016. The long-lasting ULF waves were observed in the magnetic field and energetic particle flux perturbations during three successive passes by two Geostationary Operational Environmental Satellites (GOES) through the dayside magnetosphere, during which plasmasphere expansion and refilling were observed by two Time History of Events and Macroscale Interactions during Substorms (THEMIS) probes. The radial magnetic field oscillation was in phase (~ 180° out of phase) with the northward (southward) moving proton flux oscillation at 95 keV, consistent with high-energy drift-bounce resonance signatures of protons with second harmonic poloidal standing Alfvén waves. The longitudinal extent of the waves approached 10 hours in local time on the dayside and gradually decreased with time. High-time resolution (~ 6 s) data from three high-latitude SuperDARN radars show that the wave intensification region was localized in latitude with a radial extent of ~ 135-225 km in the subauroral ionosphere. No signature of these waves were observed by ground-based magnetometers colocated with the GOES satellites suggesting that the poloidal waves were high-m mode and thus screened by the ionosphere. During this interval one of the THEMIS probes observed a bump-on-tail ion distribution at 1-3 keV which we suggest is the source of the long-lasting second harmonic poloidal ULF waves.
1. Introduction
Ultra-low frequency (ULF) oscillations in the radial magnetic field (Br) and azimuthal electric field (Eφ) are known as poloidal waves. Since the azimuthal electric field of poloidal waves is aligned with the particle drift motion, they are capable of efficiently interacting with particles in the ring current and the radiation belt [e.g., Zong et al., 2009; Murphy et al., 2014]. Among the harmonics of poloidal standing Alfvén waves, the second harmonic mode is among the most frequently observed ULF waves in the Earth’s magnetosphere [Takahashi and McPherron, 1984; Hughes and Grard, 1984]. The second harmonic standing Alfvén waves are usually observed in the Pc4 band (6.7-22.2 mHz) and are most often seen in the afternoon sector during both geomagnetically quiet and active times [Dai et al., 2015; Min et al., 2017]. Statistical surveys of these waves show that they are usually radially bounded but longitudinally extended [Anderson et al., 1990; Engebretson et al., 1992].
ULF waves with a strong toroidal component (Bφ and Er) are usually believed to be driven by external sources such as periodic variations or sudden changes in the solar wind dynamic pressure [Hudson et al., 2004] and Kelvin-Helmholtz (KH) waves at the magnetopause [e.g., Claudepierre et al., 2008; Lin et al., 2014]. Poloidal Alfvén waves with high azimuthal wave numbers (high-m) are often attributed to internal localized instabilities such as the drift-bounce resonance instability [e.g., Southwood and Hughes, 1983]. For the drift-bounce resonance instability as a source of ULF waves, free energy usually comes from two sources: (1) unstable particle populations in the ring current (bump-on-tail distribution) [Baddeley et al., 2004; Liu et al., 2013; Takahashi et al., 2018] and (2) a radial gradient of particle phase space density [Dai et al., 2013; Min et al., 2017; Oimatsu et al., 2018].
One category of poloidal ULF waves is characterized by their long lifetime from several hours to days [e.g., Sarris et al., 2009; Korotova et al., 2016; Le et al., 2017]. Most previous studies on the long-lasting poloidal ULF waves were focused on wave properties in the magnetosphere [Korotova et al., 2016; Le et al., 2017; Min et al., 2017; Takahashi et al., 2018]. Interestingly, the waves were usually monochromatic and observed during low geomagnetic activity after a geomagnetic storm or within the storm recovery phase, as summarized in Table 1. It is thought that a small convection electric field and plasmaspheric refilling during the recovery phase play key roles in the generation of the internal instabilities that drive these waves during these periods [Anderson et al., 1990; Sarris et al., 2009; Liu et al., 2013; Dai et al., 2015; Shi et al., 2018]. Generally ground-based magnetometers are unable to detect these high-m waves due to ionospheric screening effects [Hughes and Southwood, 1976]; hence, simultaneous observations of these waves in the magnetosphere and conjugate ionosphere are rare, perhaps also in part owing to their localized radial extent and low occurrence rate [Anderson et al., 1990; Shi et al., 2018].
Table 1.
Comparisons of select long-lasting poloidal ULF wave case studies
| Case study | Magnetic activity & Event duration | Wave mode & Frequency | Instrumentation & Spatial coverage | m-value | Source mechanism |
|---|---|---|---|---|---|
| This study | Recovery phase of the Jan 19-28, 2016 geomagnetic storm 2-3 days |
2nd harmonic 5-10 mHz |
THEMIS, G-13 G-15, SuperDARN dayside L~5.5-8 |
~ −258 westward postdusk | Bounce resonance through bump-on-tail unstable proton distributions at 1-3 keV |
| Takahashi et al. 2018 | After a geomagnetic storm during low geomagnetic activity 1 day |
2nd harmonic ~10 mHz |
Van Allen probes MLT~10-14 L~4.4-5.8 |
~ −200 westward near noon | Bounce resonance through bump-on-tail unstable proton distributions at 1-10 keV |
| Min et al. 2017 | After a minor geomagnetic storm during quiet time 1 day |
2nd harmonic ~7 mHz |
Van Allen probes G-15 MLT~17-02 L~6-6.7 |
~ −100 westward pre-midnight | Drift-bounce resonance through an inward radial gradient of ring current protons |
| Le et al. 2017 | Recovery phase of the 22 June 2015 geomagnetic storm 3 days |
2nd harmonic 3-30 mHz |
Van Allen probes THEMIS, Cluster G-15, G-13, MMS dayside to premidnight L~4-12 |
~ −100 westward postdusk | No observational evidence, could be drift-bounce resonance |
| Korotova et al. 2016 | After the main phase of the 1-2 May 2014 geomagnetic storm during quiet time 3 days |
2nd harmonic 10-25 mHz |
Van Allen probes THEMIS, G-15 dayside L~4-8 |
Not available | Not completely clear, attribute to bounce resonance |
| Liu et al. 2013 | After a moderate geomagnetic storm 1 day |
2nd harmonic 5-15 mHz |
THEMIS MLT~12-14 L~3.7-6.8 |
Not available | Bounce resonance through bump-on-tail unstable proton distributions at −10 keV |
| Sarris et al. 2009 | Recovery phase of the Nov 24-30, 1997 geomagnetic storm 4-5 days |
Narrowband Pc5 5-9 mHz |
G-8, G-9, Geotail LANL, ground magnetometer dayside L~6.6 |
~ 20-55 eastward prenoon | Undetermined, but exclude: external solar wind source, KH waves, ion drift-bounce resonance |
In this study, we analyze a long-lasting poloidal ULF wave using multi-point satellite and Super Dual Auroral Radar Network (SuperDARN) high frequency (HF) radars during the recovery phase of a storm on Jan 24-27, 2016. We characterize the radial and azimuthal extent of the waves observed in the magnetosphere and ionosphere and provide evidence of the wave excitation source.
2. Instrumentation and Analysis
The primary instruments used in this study are the GOES 13 (~75° west geographic longitude) and GOES 15 (~135° west geographic longitude) geostationary satellites, Time History of Events and Macroscale Interactions during Substorms (THEMIS) D and E (THD and THE, respectively) spacecraft [Angelopoulos, 2008], three high-latitude Super-DARN radars [Chisham et al., 2007], and two ground magnetometers from the Canadian Array for Realtime Investigations of Magnetic Activity (CARISMA) ground-based North America magnetometer array [Mann et al., 2008]. The solar wind and interplanetary magnetic field (IMF) data are obtained from the WIND satellite and OMNI database [King and Papitashvili, 2005]. The geomagnetic data are from the World Data Center for Geomagnetism in Kyoto.
2.1. Satellite Missions
The GOES data used in this study are the measurements of the magnetic field vector and energetic particle fluxes. The magnetic field data are from the Fluxgate Magnetometer (FGM) with a sampling rate 0.512 s [Singer et al., 1996]. The magnetic field vector is expressed in local mean-field-aligned (MFA) coordinates with components denoted as Br (outward, perpendicular to the mean magnetic field), Bφ (eastward, perpendicular to the mean magnetic field), and B// (parallel to the mean magnetic field) [Takahashi et al., 1990]. The mean magnetic field data are obtained by a boxcar running average over 30 min. After rotating into the MFA coordinates, the magnetic field perturbations in the parallel direction (ΔB//) are obtained by subtracting the 30 min-averaged mean magnetic field data. The GOES proton flux data come from the Magnetospheric Proton Detector (MAGPD) which measures protons at five differential energy channels centered at 95, 140, 210, 300, and 575 keV. We especially draw on the data collected with the detector telescopes mounted in the north/south direction with field-aligned pitch angles [Rodriguez, 2014]. In order to clearly see the ULF wave modulation in the particle flux j, we use the residual fluxes defined by δj = (j − javerage)/javerage, where javerage is the 20 min running average of j, similar to previous studies [e.g., Claudepierre et al., 2013].
The electron density inferred from THEMIS spacecraft potential data are used to provide the plasmaspheric context. Magnetic and electric field data expressed in MFA coordinates from the THD and THE spacecraft are used in this study. The magnetic field data are provided by the FGM instrument [Auster et al., 2008]. The electric field and spacecraft potential data are obtained from the Electric Field Instrument (EFI) [Bonnell et al., 2008]. The electric field data are spin-fit, 3 s-averaged vector samples constructed from the spin-plane components by assuming no electric field along the background magnetic field.
2.2. Ground-based Instruments
For ionospheric wave observations, we use the line-of-sight (LOS) velocity data from SuperDARN HF coherent scatter radars. SuperDARN is an international network consisting of more than 30 low-power radars operating at 8-20 MHz from middle to polar latitudes in both hemispheres that look into Earth’s ionosphere [Baker et al., 2007; Chisham et al., 2007]. The radars measure Doppler shifts of ionospheric irregularities at F region altitudes undergoing plasma drift. When ULF waves pass through the ionosphere, the associated electric field produces a Doppler velocity oscillation that can be measured by the radars. Normally, the SuperDARN radars are scheduled for 1-min azimuthal sweeps in the “common” mode. The step in azimuth between adjacent beams is 3.24° and the range resolution is 45 km. Sometimes the radars are scheduled to operate in higher cadence “THEMIS” mode, in which a camping beam is sampled at a higher rate of ~6 s by interleaving soundings on the camping beam with successive beams of the normal scan. For this study, THEMIS mode data from three high-latitude SuperDARN radars - Prince George (PGR), Saskatoon (SAS), and Kapuskasing (KAP) - are used to analyze ionospheric ULF wave signatures.
Two ground magnetometers with a sampling rate of 0.5 s are used in this study; one located at Fort Simpson (FSIM) from the CARISMA magnetometer array, and the other at Sanikiluaq (SNKQ) from the CANadian Magnetic Observatory System (CANMOS). In order to check on wave activity in the 5-10 mHz band, the ground magnetometer data were detrended by subtracting the 30 min running average.
2.3. Signal Processing
Dynamic power spectra of magnetic and electric field data from satellites, Doppler velocity data from SuperDARN radars, and magnetic field data from ground magnetometers are used in this study for wave analysis in the frequency domain. The dynamic power spectra are obtained by applying a running 30 min Fast Fourier Transform (FFT) with 25 min window overlap. The frequency resolution is about 0.56 mHz and the Nyquist frequency is 83.3 mHz from the lowest time resolution (~ 6 s) across all the data sets. Prior to taking the FFT, the data are interpolated for regular spacing at the specified time step and a Hanning window is applied to reduce spectral leakage.
2.4. Instrument Locations
The locations of the various space and ground instruments used in this study are shown in Figure 1. The upper panels show the locations of the GOES (black), THE (blue) and THD (red) spacecraft in the X-Y plane (Figure 1a) and X-Z plane (Figure 1b), in Solar Magnetic (SM) coordinates. The diamonds (GOES) and asterisks (THEMIS) identify the locations of the satellites at 23:00 UT on Jan 24, 2016. As can be seen in Figure 1b, all measurements from four satellites were made above the magnetic equator with GOES 15 located at about 4° and GOES 13 at ~ 10° off the magnetic equator. The lower panel (Figure 1c) shows a map in Altitude Adjusted Corrected Geomagnetic (AACGM) coordinates [Baker and Wing, 1989; Shepherd, 2014] with the positions of the spacecraft and ground instruments indicated. Included are the two selected ground magnetometers (black dots); SuperDARN radar fields of view (FOV) and camping beams of PGR (cyan), SAS (green), and KAP (orange); and ionospheric footprints of the GOES satellites (black diamonds), THE (blue asterisk) and THD (red asterisk) using the Tsyganenko 1996 (T96) magnetic field model [Tsyganenko and Stern, 1996] at 23:00 UT. The red regions inside the radar camping beams indicate the range gates where ULF wave signatures were most frequently observed in this study. Unless specified, the magnetic coordinates used hereafter are AACGM.
Figure 1.
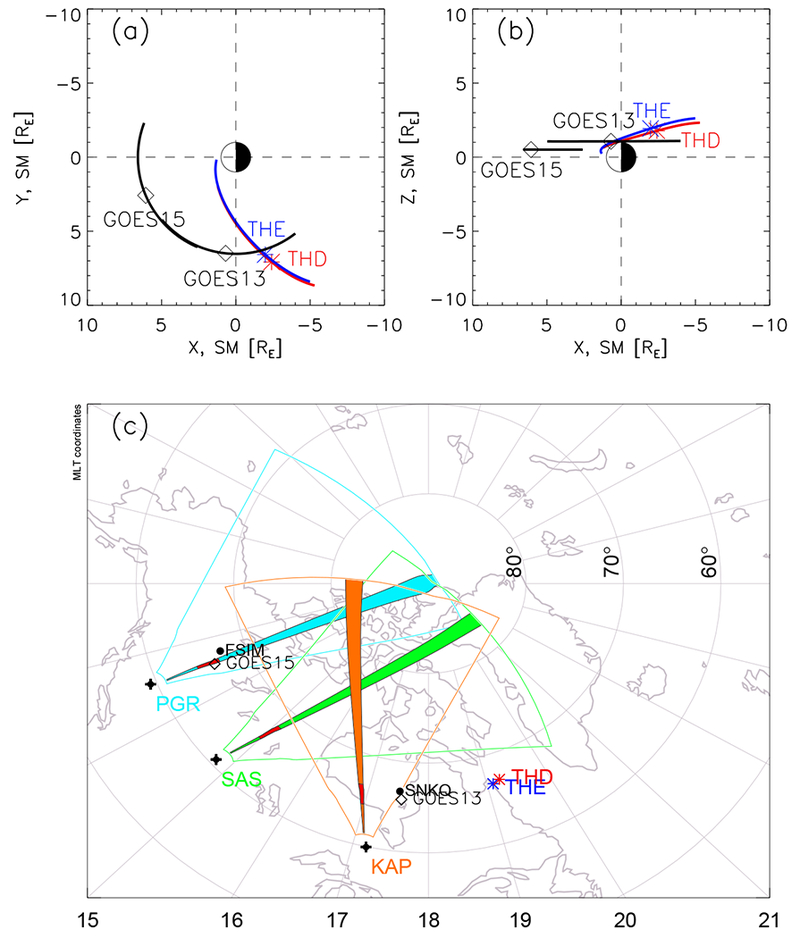
Locations of various space and ground instruments. The upper panels show the locations of GOES 13 and 15 (black curve), THE (blue curve) and THD (red curve) spacecraft in (a) the X-Y plane and (b) the X-Z plane in Solar Magnetic coordinates from 20:00 UT on 24 January 2016 to 02:00 UT on 25 January 2016. The lower panel (c) shows the locations of ionospheric footprints of GOES 13 and 15 (black diamonds), THE (blue asterisk) and THD (red asterisk), ground magnetometers (black dots), and SuperDARN radar FOV and camping beams of PGR (cyan), SAS (green), and KAP (orange) in AACGM coordinates at 23:00 UT on 24 January 2016.
3. Observations
In this section, we describe the interplanetary and geomagnetic conditions during the wave event and analyze the wave properties in the magnetosphere and ionosphere to obtain the spatial extent and spectral features of long-lasting poloidal ULF waves observed by multiple satellites and high-latitude SuperDARN radars. This event was initially identified in the ULF event data base from SuperDARN high time resolution data which was built using an automated detection method based on the Lomb-Scargle periodogram technique described by Shi et al. [2018].
3.1. Event Overview
Figure 2 provides an overview of the interplanetary and geomagnetic conditions covering the wave event during a moderate geomagnetic storm with a minimum SymH value of ~ −100 nT. The interplanetary data come from OMNI and are overlaid with 1 h-shifted data (dashed purple curves) from the Wind satellite to fill in data gaps in OMNI. The cyan shaded regions identify the time intervals of interest, when GOES satellites observed monochromatic poloidal ULF waves in the dayside magnetosphere. Note that approximately two hours before the start of the wave event there was a substorm onset at ~ 18:00 UT on 24 January 2016. The AE index reached a maximum of ~ 1000 nT at ~ 19:00 UT and gradually decreased to ~ 250 nT at 20:00 UT. The onset of the wave event appears to coincide with a solar wind dynamic pressure pulse at 20:00 UT. It was geomagnetically quiet (AE ¡ 100 nT) during the second pass of the dayside magnetosphere by the GOES satellites, the IMF was slightly northward and dominated by a positive Bx at ~ 6 nT.
Figure 2.
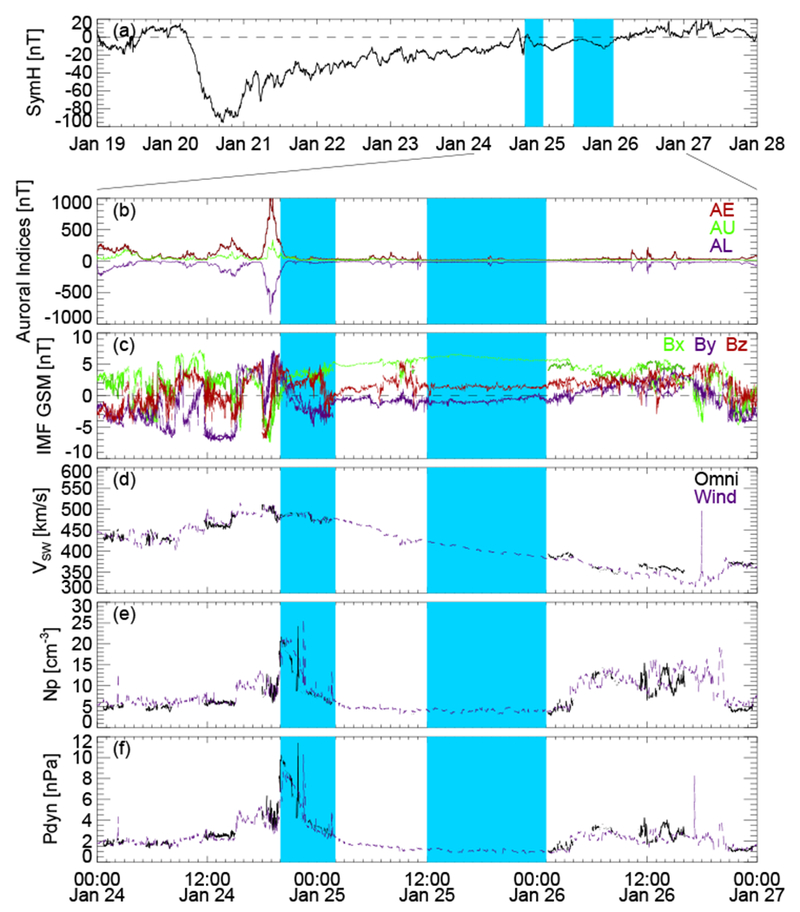
Geomagnetic indices and interplanetary parameters covering the wave event: (a) SymH index on 19-28 January 2016; (b) AE (red), AU (green), and AL (blue) indices, (c) OMNI/WIND IMF Bx, By and Bz components in the Geocentric Solar Magnetospheric coordinate system, (d) solar wind speed, (e) solar wind proton density, and (f) solar wind dynamic pressure on 24-27 January 2016. The cyan shaded regions identify the time intervals of interest.
Before we analyze ULF wave properties in the magnetosphere, it is important to know whether and how the magnetospheric plasma density varies during the course of the wave event, as changes in the plasma density will result in changes in the eigenfrequency of the magnetic field lines and the associated wave frequency. Figure 3 shows profiles of the electron density inferred from the spacecraft potential versus L shell value during four successive outbound passes from 23-27 January 2016. Figure 3 shows evidence of both plasmasphere expansion and refilling from THD (Figure 3a) and THE (Figure 3b) observations during the recovery phase of the geomagnetic storm. Plasmaspheric boundary layer (PBL) or plume structure was observed during the second outbound pass on Jan 24-25, 2016 (red curve) by both satellites as a bump in the electron density profile reaching ~ 100 cm−3 around L ~ 5.5.
Figure 3.
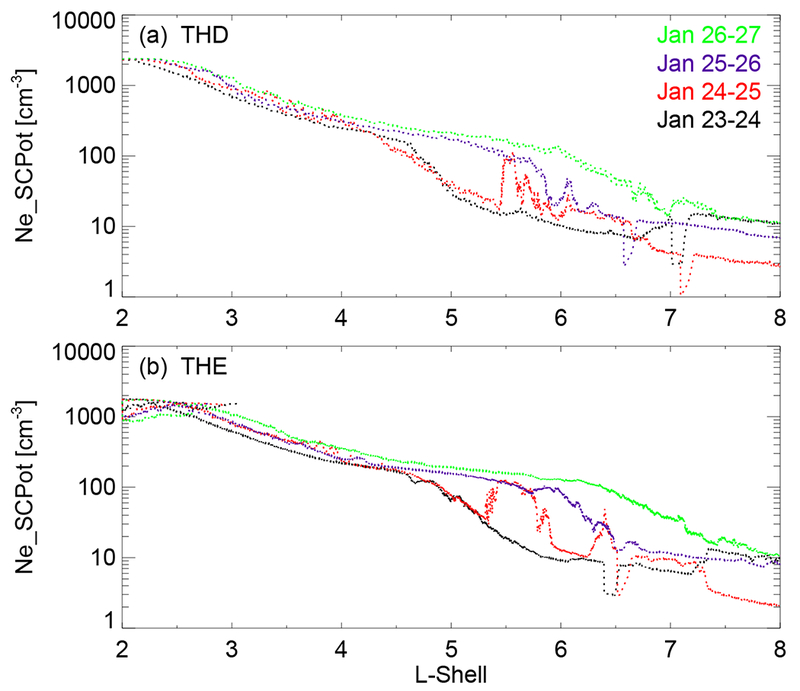
Plasmaspheric context from two THEMIS spacecraft during the recovery phase of the geomagnetic storm. Each panel shows profiles of electron density inferred from spacecraft potential versus L shell value during four successive outbound passes of (a) THD and (b) THE from 23 to 27 January 2016.
3.2. Wave Properties in the Magnetosphere
We first examine waves observed by geostationary satellites as shown in Figure 4 (GOES 13) and Figure 5 (GOES 15). The red (black) vertical lines identify local noon (midnight). The green (yellow) vertical lines identify local dawn (dusk). Episodes of monochromatic ULF waves between 5-10 mHz were observed in the dayside magnetosphere by both satellites over 2-3 days. The wave power is strongest in the radial magnetic field (Br) consistent with a poloidal mode. At the onset of this wave event (~ 20:00 UT), GOES 13 was located in the afternoon sector and GOES 15 was located at ~ 10.5 MLT. The azimuthal extent of these waves was up to 10 hours in MLT on the dayside as can be seen from the second pass on 25-26 January and gradually decreased to a few hours around noon in the third pass. The wave frequency generally decreases as the satellites move from the morning sector and into the noon and dusk sectors and from the first pass to the third pass of the dayside magnetosphere. Both the diurnal and daily frequency decreases can be explained by the mass density change. The afternoon sector often has a higher plasma density than the morning sector. In addition, in this event plasmaspheric plume structure was observed around dusk (Figure 3). The refilling of the plasmasphere evident in Figure 3 resulted in an increase in electron density which may account for the steady decrease in wave frequency. While heavy ion mass loading during plasmasphere refilling may also contribute to the wave frequency change [Fraser et al., 2005], the mass loaded plasma density data is not available from spacecraft measurements in this study.
Figure 4.
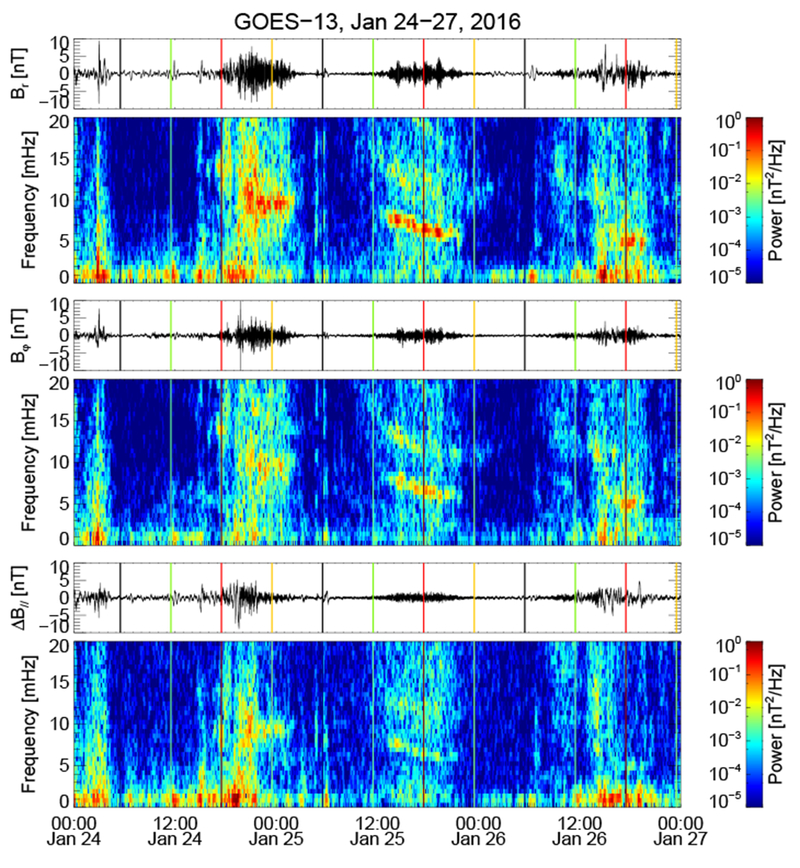
The magnetic field data from GOES 13 in the Mean-Field-Aligned coordinate system and the dynamic power spectra from 24 to 27 January 2016. The red (black) vertical lines identify local noon (midnight). The green (yellow) vertical lines identify local dawn (dusk).
Figure 5.
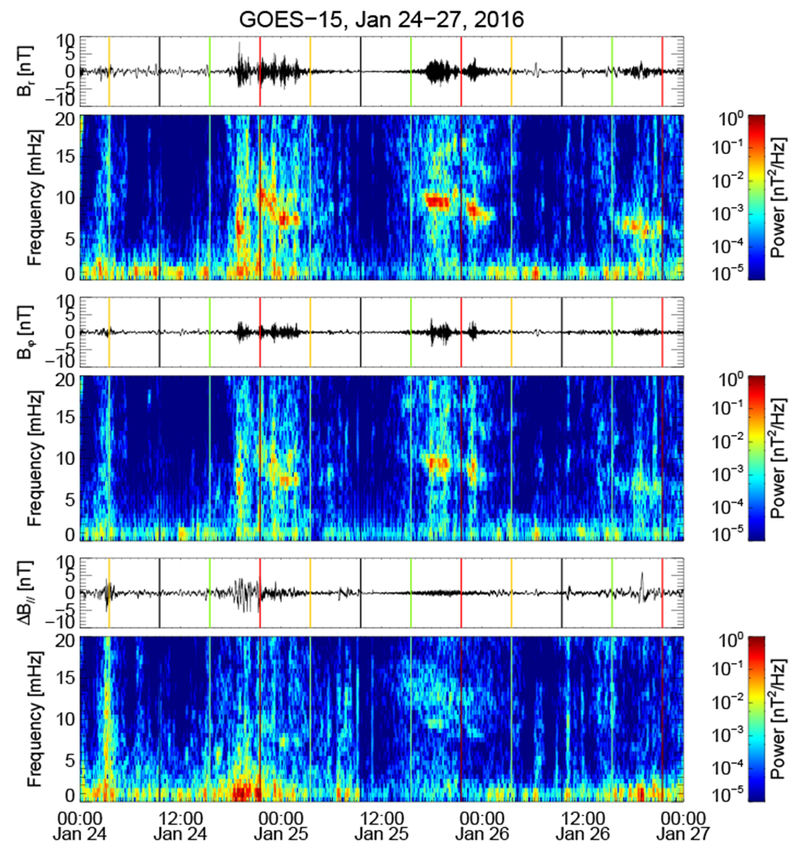
The magnetic field data from GOES 15 in the Mean-Field-Aligned coordinate system and the dynamic power spectra from 24 to 27 January 2016.
Note that a higher harmonic was observed during the second pass of GOES 13 and is more clearly seen in the toroidal component (Bφ). The fact that the azimuthal magnetic field has strong wave power at similar frequencies to the radial magnetic field suggests coupling of the poloidal and toroidal modes, which is common in the inhomogeneous media of the Earth’s magnetosphere. The differences in wave frequency and spatial extent of the monochromatic poloidal waves observed by GOES 13 and GOES 15 are probably due to their different orbits, recalling that GOES 15 was closer to the magnetic equator than GOES 13 (Figure 1b).
We now consider the waves observed by the two THEMIS satellites near dusk. During the outbound pass of THD and THE, both satellites observed monochromatic ULF waves in the radial and azimuthal electric field components at 6-8 mHz. Note that the ULF electric field perturbation amplitudes, periods, and phases measured by the THEMIS EFI short and long booms agree well, suggesting that the THEMIS double probe electric field measurement is not affected by contamination during this interval. The waves lasted for several wave cycles around 19 MLT (vertical red lines in Figure 6). THD (left column), located closer to the magnetic equator, passed through the wave active region a few minutes before THE, and observed a stronger wave power in the radial electric field (Er) while THE (right column) observed a stronger electric field power in the azimuthal component (Eφ). Since both satellites were located off the magnetic equator, the wave power at the same frequency from the radial magnetic field (Br) is very weak. We will demonstrate later in the Discussion that the observations in the magnetosphere are consistent with a second harmonic standing Alfvén wave.
Figure 6.
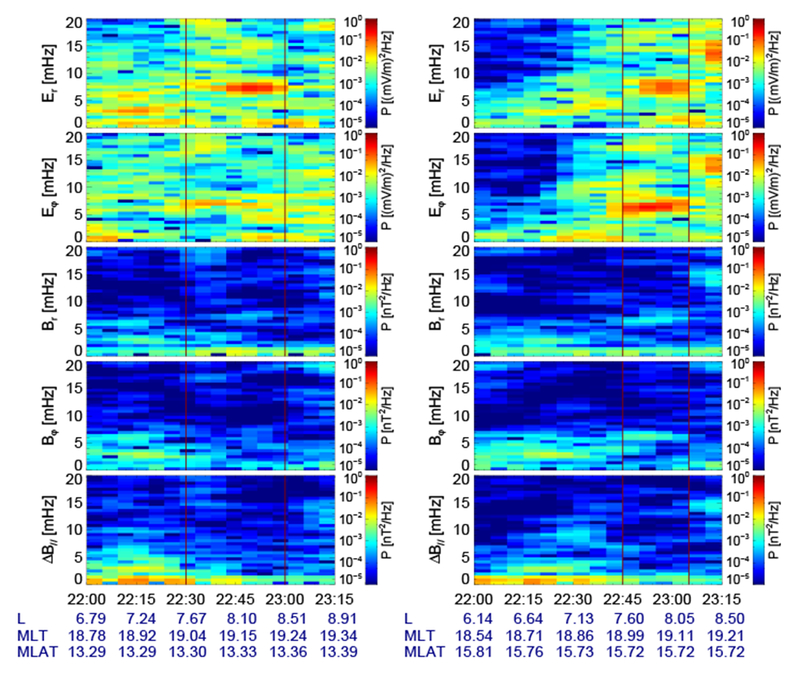
The dynamic power spectra of electric and magnetic field components in the Mean-Field-Aligned coordinate system from THD (left) and THE (right) at 22:00-23:15 UT on 24 January 2016.
Unlike the GOES satellites which observed wave activity during three successive passes of the dayside magnetosphere, THEMIS only observed wave activity during the first outbound pass near the dusk flank. Figure 1 shows that during the wave event THD and THE were located ~ 1.5 h eastward of GOES 13 which continued observing monochromatic poloidal waves until after ~ 21 MLT. By contrast, GOES 15 located ~ 4 h eastward of GOES13 did not see the waves after 18 MLT during the first pass. Neither GOES 13 or GOES 15 observed wave signatures between 5-10 mHz after dusk on either the second or third passes. Hence, the wave active region extended past dusk only during the first pass and thus THD and THE could only observe the wave during this initial period of wave activity.
3.3. Wave Properties in the Ionosphere
After examining wave properties in the magnetosphere, we now analyze wave signatures in the ionosphere observed by ground-based SuperDARN radars and magnetometers. Figure 7 shows ionospheric ULF wave signatures observed by the PGR radar in the camping beam 12 from 2016-01-24/23:00 UT to 2016-01-25/02:00 UT. The alternating green and yellow stripes starting at about 23:10 UT on January 24 over range gate 10-15 were signatures of flow velocity modulations by ULF waves in the ionosphere as shown in the Range-Time Intensity (RTI) plot (Figure 7a). An enhancement in flow velocity (300 m/s) at 01-02 UT on January 25 was localized within 3-5 range gates (135-225 km) and merged with lower frequency (¡ 5 mHz) waves at higher latitudes, probably Pc5 pulsations in the auroral region. Time series of LOS velocity from range gate 12 is shown in Figure 7b and its dynamic power spectrum is shown in Figure 7c. Monochromatic waves at ~ 7-8 mHz with weaker wave power were observed before 2016-01-25/01:00 UT, waves with stronger power were seen after 2016-01-25/01:00 UT at similar frequencies. Figure 7d shows time series of LOS velocity from successive range gates. The progression from top to bottom panel corresponds to decreasing magnetic latitude (first number in the square brackets) at similar magnetic longitude (second number in the square brackets). Wave intensifications are isolated to a few range gates, the location of the intensification varies with time generally propagating to lower latitudes.
Figure 7.
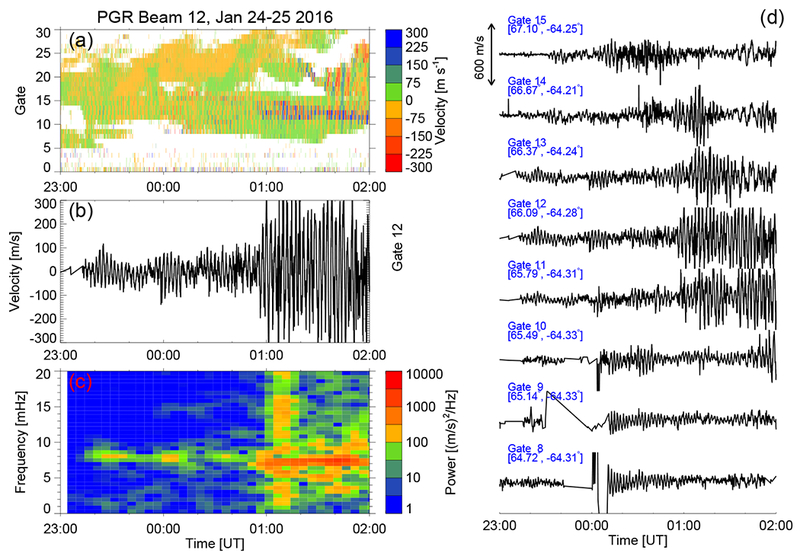
Ionospheric ULF signatures observed by the PGR radar in the camping beam 12 from 2016-01-24/23:00 UT to 2016-01-25/02:00 UT. (a) The range-time intensity plot; (b) Doppler velocity time series from range gate 12 of beam 12; (c) Dynamic power spectrum of data from panel (b); (d) Doppler velocity time series from range gate 8-15 of beam 12.
Besides the PGR radar, the SAS and KAP radars observed monochromatic ionospheric ULF wave signatures between 5-10 mHz, as shown in Figure 8. RTI plots in Figure 8 (left) show that these monochromatic ULF waves were mostly observed equatorward of lower frequency Pc5 waves at higher latitudes and lasted for a few hours as long as ionospheric backscatter persisted. Time series of LOS velocity in 0.5 h intervals incremented by 7.5 min from individual radar and range gate were analyzed separately for spectral power from 2016-01-24/20:00 UT to 2016-01-25/04:00 UT, using the Lomb-Scargle periodogram technique reported in Shi et al. [2018]. Figure 8d shows the frequency of wave events from the three radars as a function of MLT. Wave events were mostly observed in the afternoon sector and the wave frequency did not show a clear variation with MLT. A clear trend of wave frequency decrease with increasing magnetic latitude is observed in Figure 8e, which is a prominent feature of the field line eigenfrequency variation with latitude.
Figure 8.
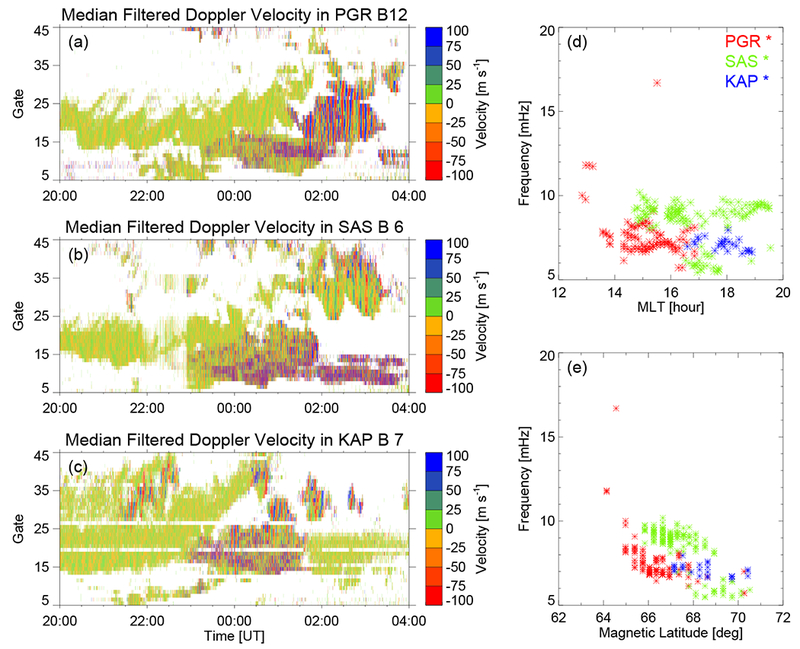
(Left) The range-time intensity plot for (a) PGR, (b) SAS, and (c) KAP radar from 2016-01-24/20:00 UT to 2016-01-25/04:00 UT. (Right) Frequency versus (d) MLT and (e) magnetic latitude distribution of wave events.
Knowledge of the azimuthal wave number is important for understanding the ULF wave excitation mechanism and wave interactions with the ambient plasma. Data from individual SuperDARN radars can be analyzed for information on m number by comparing measurements across multiple beam directions. In standard operation mode, a scan repeats once a minute. In THEMIS mode, a scan repeats once every two minutes while the THEMIS beam is sample every 6 s. Thus, high-time resolution data are available in one beam direction but this is unsuitable for resolving m value. There is scope for combing THEMIS beam data from multiple radars provided the sampling is dense enough in longitude.
We thus investigate the azimuthal wave number using data from the SNKQ and FSIM ground magnetometers near the ionospheric footprint of GOES 13 and GOES 15. Radially polarized (poloidal) Alfvén waves should be observed in the Y component by ground magnetometers due to the 90° polarization rotation by the ionosphere [Hughes and Southwood, 1976]. However, no long-lasting ULF waves between 5-10 mHz were observed on the dayside by either ground magnetometer in the Y component, as seen in Figure 9. This suggests that monochromatic ULF waves between 5-10 mHz observed by the satellites in the dayside magnetosphere and by SuperDARN HF radars in the dayside ionosphere were high-m mode waves which were screened by the ionosphere from detection by ground magnetometers. Note that we do see higher harmonic waves between 10-15 mHz on the dayside from 2016-01-25/12:00 UT to 2016-01-26/00:00 UT at the SNKQ station, which is consistent with observations from GOES 13 (Figure 4). These waves are probably low-m higher harmonic toroidal waves which are less affected by screening and can be detected on the ground. We applied the cross-phase analysis (not shown) of Waters et al. [1991] using the Bx components from two closely spaced meridional ground magnetometers. Preliminary results do indicate the existence of higher harmonic toroidal modes. Detailed consideration of the toroidal mode in this event is left to future work.
Figure 9.
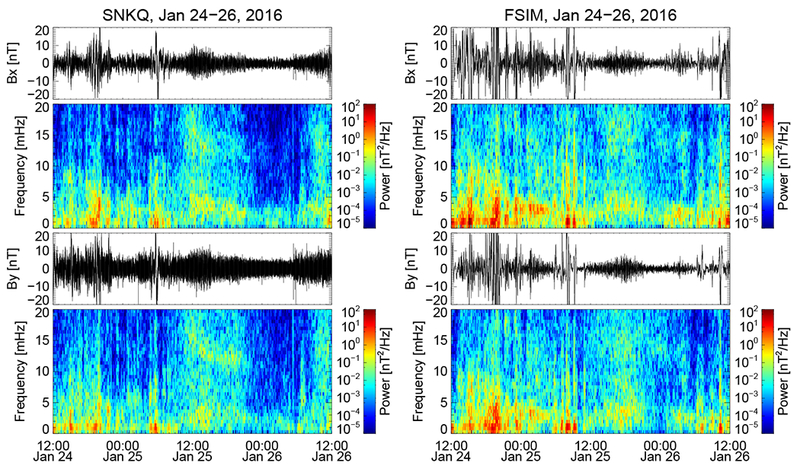
Time series and dynamic power spectra of ground magnetic field northward (Bx) and eastward (By) components observed at the SNKQ (left) and FSIM (right) stations from 24 to 26 January 2016.
3.4. Wave Spatial and Spectral Characteristics
To characterize the wave spatial extent and spectral properties, the wave frequency distribution as a function of MLAT and MLT from the SuperDARN radars, GOES satellites and THEMIS spacecraft from 2016-01-24/20:00 UT to 2016-01-25/04:00 UT are shown in Figure 10. Each symbol represents the frequency of the spectral peak power from 0.5 h interval satellite and radar data. The wave activities are mainly localized at ~ 64-70° MLAT in the afternoon sector in the subauroral region, as indicated by the Special Sensor Ultraviolet Spectrographic Imager (SSUSI) data from the Defense Meteorological Satellite Program (DMSP) satellites (not shown). The wave frequency from GOES 13 (diamond) stays stable at ~ 10 mHz from 14-22 MLT and is consistent with the SAS (triangle) radar measurements just poleward of GOES 13. The ionospheric footprint of GOES 15 (square) was located close to the PGR (x) radar camping beam measurements and they recorded similar wave frequencies at 6-8 mHz at ~ 66° MLAT and 14-16 MLT. The THD (asterisk) and THE (circle) spacecraft observed ULF waves at a lower frequency (~ 6.5 mHz) which is closer with the KAP (cross) and SAS radar measurements at higher latitudes. Despite the uncertainties in mapping of radar backscatter and of spacecraft measurements to the ionosphere, the 2D wave frequency distribution shows the consistency of space and ground-based observations of the monochromatic ULF waves in the dayside magnetosphere and ionosphere. It also illustrates the importance of using multipoint coordinated satellite and radar observations to obtain information about the radial and azimuthal extent of the waves at the time of occurrence. In this case the long-lasting high-m ULF waves were localized in the radial direction but extended in the azimuthal direction across the dayside.
Figure 10.
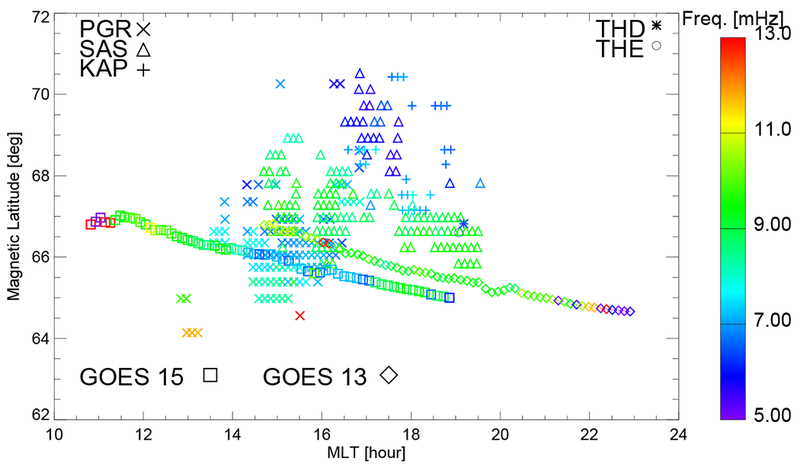
Frequency distribution as a function of magnetic latitude and MLT for ULF wave events from three high latitude SuperDARN radars, GOES and THEMIS satellites from 2016-01-24/20:00 UT to 2016-01-25/04:00 UT.
4. Discussion
In this section, we summarize the observed wave properties and discuss possible mechanisms for wave excitation and the impact these waves have on magnetospheric plasma via wave-particle interactions.
The very strong wave power in the radial magnetic field observed by GOES 13 and GOES 15 near the magnetic equator suggests these waves were second harmonic poloidal mode (antisymmetric). As shown in Figure 1 from Dai et al. [2013], the fundamental poloidal mode (symmetric) with a magnetic node near the magnetic equator is not detectable as a magnetic field oscillation. Furthermore, THD and THE located 13°-16° off the magnetic equator observed very strong electric field oscillations but very weak magnetic field oscillations (Figure 6). This suggests the THEMIS satellites were located close to the magnetic field node of the second harmonic wave.
Although the observed ULF waves share similarities with giant pulsations (Pgs) [Chisham, 1996; Wright et al., 2001; Motoba et al., 2015], (i.e. localized in latitude, monochromatic waveform, high-m, poloidal mode, usually observed during geomagnetically quiet times, driven by internal instabilities), the ULF waves observed in this study are not likely Pgs which are more often observed in the morning sector in the auroral zone and can be detected by ground magnetometers with |m| ~ 20 – 40. Our observed ULF waves are generally constrained to the dayside and extended to post-dusk in the subauroral region on the first day; there is also no clear signature of the wave in ground-based magnetometer observations (Figure 9). Fortunately, high-latitude SuperDARN HF radars detected the ionospheric signatures of these high-m waves and the latitudinal extent of the wave active region is estimated to be 135-225 km in the ionosphere (Figure 7). With the aid of SuperDARN observations, we are also able to distinguish waves with different sources, e.g., lower frequency waves from the auroral region and long-lasting higher frequency waves in the subauroral region (Figure 7a). In addition, multiple radar observations provide information on the wave azimuthal extent and wave property variations with magnetic latitude and longitude (Figure 8d-e and Figure 10). In summary, we conclude that the observations of narrowband ULF waves in the magnetosphere and ionosphere are consistent with a high-m mode second harmonic standing Alfvén wave with a wide longitudinal extent but narrow radial extent.
As mentioned in the Introduction, high-m poloidal standing Alfvén waves are often driven by internal instabilities, such as the drift-bounce resonance. To gain insights into internal sources of free energy for wave excitation, we examine the ion phase space density (f) as a function of energy (W) to determine if a bump-on-tail distribution exists [e.g., Baddeley et al., 2005]. The Electrostatic Analyzer (ESA) [McFadden et al., 2008] measures phase space density as functions of energy, pitch angle and time. We obtained omnidirectional (pitch angle averaged) ion phase space density from THE ESA measurements and present in Figure 11 (bottom panels). The azimuthal electric field measured by the THE spacecraft is shown in Figure 11a. The positive energy slope (∂f/∂W > 0) marked between blue dashed lines in the ion distribution function identifies a bump-on-tail structure which contains “free energy” in the “bump” that can be fed to a wave when the drift frequency (ωd) and bounce frequency (ωb) of ions match the wave frequency (ω) through the drift-bounce resonance condition [e.g., Southwood, 1976]:
| (1) |
where m is the azimuthal wave number and N is an integer (0, ±1, ±2, …) representing the harmonic mode of the wave. We estimate proton ωd and ωb based on the following formulas given by Hamlin et al. [1961] and Chisham [1996]:
| (2) |
| (3) |
where W is the proton energy, mp is the proton mass, L is the proton’s L-shell, RE is the radius of the Earth, αeq is the proton equatorial pitch angle, Bs is the equatorial surface magnetic field strength, Kp is the planetary magnetic activity index, φ is the azimuthal angle of the particle measured anticlockwise from local midnight (φ = mlt/24. × 360.). The first term on the right hand side of equation (3) represents gradient-curvature drift and the second if drift under a model magnetospheric potential [Maynard and Chen, 1983; Yeoman et al., 2001].
Figure 11.
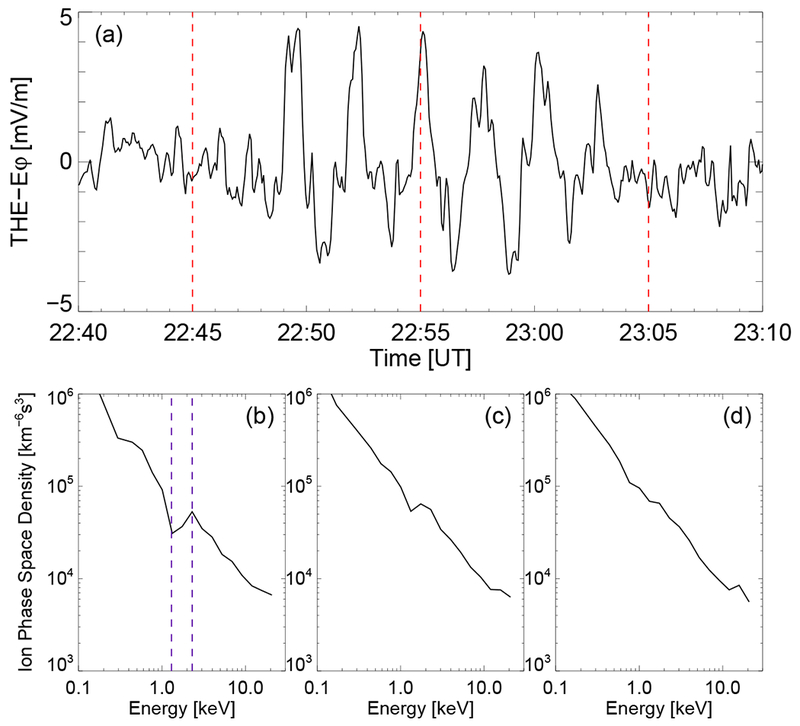
(a) The azimuthal electric field from 22:40 UT to 23:10 UT on 24 January 2016 and ion phase space density as a function of energy measured at about (b) 22:45 UT, (c) 22:55 UT, and (d) 23:05 UT by the THE spacecraft.
The proton bounce and drift frequencies at the location of the bump W = 2 keV are estimated to be ωb = 0.0196739 rad/s (fb = ωb/2π = 3.13119 mHz), ωd = −8.19879 × 10⁻⁵ rad/s (fd = ωd/2π = −0.0130488 mHz), using L = 7.6, αeq = 30°, Kp = 1, mlt = 19 for THE observed the bump-on-tail distribution at 2016-01-24/22:45 UT. For low-energy ions interacting with the second harmonic poloidal wave through drift-bounce resonance, we have N = 1 and the m value is estimated to be −258 (negative value represents westward propagation) based on equation (1) and wave frequency ω = 2πf = 0.04084 rad/s (f = 6.5 mHz). Takahashi et al. [2018] reported Van Allen Probes observations of second harmonic poloidal standing Alfvén waves propagating westward with m ~ −200. The proton phase space density in their study also exhibited a bump-on-tail structure occurring in the 1-10 keV energy range. Seen from Table 1, a similar event has been reported by Liu et al. [2013] in the plasmasphere boundary layer. Since the high-m modes are usually observed with |m| ~ 100, previous studies seldom observed any ground signatures due to ionospheric screening effects. Baddeley et al. [2005] examined the cause and effect relationship between the unstable magnetospheric particle populations and conjugate ionospheric high-m ULF waves measured by the DOppler Pulsation Experiment (DOPE) HF sounder. In this study, multiple ground-based SuperDARN HF radars provide 2D wave properties in the ionosphere (Figure 10) and nicely fill the gap between observations from space-based satellites and ground-based magnetometers.
High-m poloidal mode waves may also be excited via high-energy ion drift-bounce resonance with an inward radial gradient of ion phase space density, e.g., ∂f/∂L < 0. Previous studies [e.g., Takahashi et al., 1990] show that the radial magnetic field oscillation should be 180° (0°) out of phase with the southward (northward) moving proton flux oscillations in the resonant energy associated with a second harmonic poloidal standing Alfvén wave observed at the magnetic equator. At energies away from the resonance, the cross phase of ion flux oscillation and the radial magnetic field oscillation should approach +/−90°. Signatures of drift-bounce resonance in ion flux oscillations at 95-300 keV with field-aligned pitch angles (α) from GOES 13 are shown in Figure 12. Namely, ~ 180° phase shift between Br (Figure 12a), southward moving (α ~ 140°) ion residual flux at 95 keV (red line in Figure 12b), ~ 90 ° phase shift for 140 keV ions (green line in Figure 12b). Also, the amplitude of ion residual flux oscillations peaks at 95 keV energy channel. For ions moving nearly parallel to the magnetic field (α ~ 2°) from the detector telescope 7 (Figure 12c), the 95 keV residual flux leads Br by a few degrees which is consistent with the pitch angle dependence reported by Takahashi et al. [2018] in Figure 12. Another approach to estimate m value draws on assuming the 95 keV ions are in drift-bounce resonance (N=−1) with the observed poloidal wave. The m number is estimated to be −152 in this case, which is still consistent with a high-m mode wave. However, we are unable to check the radial phase space density profile at the resonant energy using GOES satellite measurements. Thus, we cannot exclude or confirm the possibility of wave excitation involving drift-bounce resonance at high energy with an inward radial gradient of ring current protons.
Figure 12.
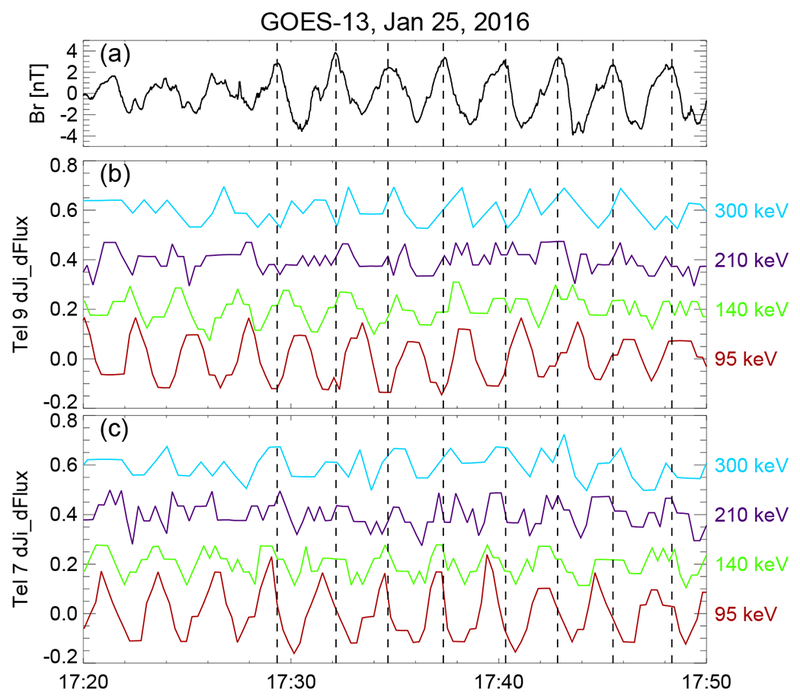
Time series of magnetic field and energetic ion residual flux data from GOES 13 between 17:20 and 17:50 UT on Jan 25, 2016: (a) radial magnetic field; (b) southward moving energetic ion residual fluxes at ~ 140° pitch angle from detector telescope 9; (c) northward moving energetic ion residual fluxes at ~ 2° pitch angle from detector telescope 7.
Finally, we discuss possible explanations for why these high-m poloidal waves could last for days and are observed on the dayside with a wide azimuthal extent but a localized radial extent. Both event analysis and statistical studies suggest these waves are mostly observed during low geomagnetic times within the recovery phase of a geomagnetic storm [e.g., Engebretson et al., 1992; Sarris et al., 2009; Le et al., 2017; Shi et al., 2018]. Previous investigations also indicate a connection between the occurrence of these waves with prior substorm activity (followed by sharp AE drops) and the decay of the ring current [Anderson et al., 1990; Shi et al., 2018; Oimatsu et al., 2018]. For low energy ions (¡ 10 keV), the convection electric field becomes significant and can cause these particles to drift out of the magnetosphere and form unstable bump-on-tail distribution occurring ~ 0.5-2 days after particle injections as proposed by Ozeke and Mann [2001]. However, it is difficult to identify the source of these low energy particles which may be associated with prior substorm activity or other magnetospheric processes [Wright et al., 2001; Liu et al., 2013]. The bump-on-tail distribution might last for a few days and cover some longitudinal extent on the dayside. The cold background plasma density during the plasmaspheric refilling would change the local field line eigenfrequency and thus control the location of ULF wave excitation through the drift-bounce resonance condition [Liu et al., 2013; Min et al., 2017].
5. Conclusions
Using multiple spacecraft and high-latitude SuperDARN radars, we have analyzed a long-lasting (2-3 days) second harmonic poloidal ULF wave during the recovery phase of the geomagnetic storm on 24-27 January 2016. These narrowband waves between 5-10 mHz are very localized radially but extended azimuthally (up to 10 hr) in the dayside magnetosphere and ionosphere. The waves are westward propagating high-m (~ −258) mode and thus cannot be detected by ground magnetometers due to ionospheric screening effects. The source of wave excitation is suggested to be bump-on-tail ion distributions at 1-3 keV. These waves could impact magnetospheric particle dynamics through drift-bounce resonance, including modulation and acceleration/deceleration of ring current energetic particles and cold plasmaspheric particles. This study emphasizes the role of conjugate satellite-SuperDARN observations in high-m ULF wave study as well as multi-point SuperDARN high-time resolution data in estimating the wave spatial extent and ionospheric electric fields/flow for Pc4-5 waves in the radiation belts/ring current (i.e., sub-auroral region). The relatively recent mid-latitude SuperDARN radars and high-time resolution radar data (e.g., THEMIS mode) open up several possibilities for ULF wave studies and make it possible to study global waves at higher frequency and lower latitude as shown in this study.
Keypoints:
Coordinated satellite-SuperDARN observations of long-lasting (2-3 days) ULF waves during the recovery phase of a moderate geomagnetic storm
Monochromatic ULF waves between 5-10 mHz are second harmonic poloidal mode with a localized radial extent in the dayside magnetosphere and ionosphere
These waves are likely generated by drift-bounce resonance with bump-on-tail ion distributions
Acknowledgments.
Work at Virginia Tech was supported by National Aeronautics and Space Administration (NASA) Headquarters under the NASA Earth and Space Science Fellowship Program - Grant 80NSSC17K0456 P00001, National Science Foundation (NSF) grant AGS-1341918 and ICER-1541007. M. D. Hartinger was supported by NASA grant NNX17AD35G. K. R. Murphy is partially funded by NSF grant 1602403. J. V. Rodriguez was supported by National Center for Environmental Information (NCEI) through NOAA Cooperative Agreement NA17OAR4320101. The authors acknowledge the use of SuperDARN data, which are freely available through the SuperDARN website at Virginia Polytechnic Institute and State University (http://vt.superdarn.org/). SuperDARN is a collection of radars funded by national scientific funding agencies of Australia, Canada, China, France, Italy, Japan, Norway, South Africa, the United Kingdom and the United States. SuperDARN Canada radar operations are supported by the Canada Foundation for Innovation, the Province of Saskatchewan, and the Canadian Space Agency. The GOES magnetic field and energetic particle data are publicly available from NOAA National Centers for Environmental Information (formerly the National Geophysical Data Center). We acknowledge NASA contract NAS5-02099 and V. Angelopoulos for use of data from the THEMIS Mission (http://themis.ssl.berkeley.edu/). Specifically J. W. Bonnell and F. S. Mozer for use of EFI data; K. H. Glassmeier, U. Auster and W. Baumjohann for the use of FGM data provided under the lead of the Technical University of Braunschweig and with financial support through the German Ministry for Economy and Technology and the German Center for Aviation and Space (DLR) under contract 50 OC 0302; J. McFadden for the use of THEMIS/ESA data; I.R. Mann, D.K. Milling and the rest of the CARISMA team for use of GMAG data (http://carisma.ca/). CARISMA is operated by the University of Alberta, funded by the Canadian Space Agency. The SNKQ ground magnetometer data are obtained by the CANMOS network, maintained and operated by the Geological Survey of Canada. Dst and AE indices are obtained at the World Data Center Kyoto University (http://wdc.kugi.kyoto-u.ac.jp/dstdir/).
Footnotes
Publisher's Disclaimer: This article has been accepted for publication and undergone full peer review but has not been through the copyediting, typesetting, pagination and proofreading process, which may lead to differences between this version and the Version of Record. Please cite this article as doi: 10.1029/2018JA026003
References
- Anderson BJ, Engebretson MJ, Rounds SP, Zanetti LJ, and Potemra TA (1990). A statistical study of Pc3–5 pulsations observed by the AMPTE/CCE magnetic field experiment, 1. Occurrence distributions. Journal of Geophysical Research, 95(A7), 10,495–10,523. [Google Scholar]
- Angelopoulos V (2008). The THEMIS Mission. Space Science Reviews, 141, 5–34. https://doi.org/10.1007/s11214-008-9336-1 [Google Scholar]
- Auster HU, et al. (2008). The THEMIS Fluxgate Magnetometer. Space Science Reviews, 141, 235–264. https://doi.org/10.1007/s11214-008-9365-9 [Google Scholar]
- Baddeley LJ, Ye oman TK, Wright DM, Trattner KJ, & Kellet BJ (2004). A statistical study of unstable particle populations in the global ring current and their relation to the generation of high m ULF waves. Annales Geophysicae, 22 (12), 4229–4241. https://doi.org/10.5194/angeo-24-3027-2006 [Google Scholar]
- Baddeley LJ, Yeoman TK, Wright DM, Trattner KJ, and Kellet BJ (2005). On the coupling between unstable magnetospheric particle populations and resonant high m ULF wave signatures in the ionosphere. Annales Geophysicae, 23, 567–577. https://doi.org/10.5194/angeo-23-567-2005 [Google Scholar]
- Baker JBH, Greenwald RA, Ruohoniemi JM, Oksavik K, Gjerloev JW, Paxton LJ, and Hairston MR (2007). Observations of ionospheric convection from the Wallops SuperDARN radar at middle latitudes. Journal of Geophysical Research, 112, A01303 https://doi.org/10.1029/2006JA011982 [Google Scholar]
- Baker KB, and Wing S (1989). A new magnetic coordinate system for conjugate studies at high latitudes. Journal of Geophysical Research, 94 (A7), 9139–9143. https://doi.org/10.1029/JA094iA07p09139 [Google Scholar]
- Bonnell JW, et al. (2008). The Electric Field Instrument (EFI) for THEMIS. Space Science Reviews, 141, 303–341. https://doi.org/10.1007/s11214-008-9469-2 [Google Scholar]
- Chisham G (1996). Giant pulsations: An explanation for their rarity and occurrence during geomagnetically quiet times. Journal of Geophysical Research, 101 (A11), 24,755–24,763. https://doi.org/10.1029/96JA02540 [Google Scholar]
- Chisham G, et al. (2007). A decade of the Super Dual Auroral Radar Network (Super-DARN): Scientific achievements, new techniques and future directions. Surv. Geophys., 28(1), 33–109. https://doi.org/10.1007/s10712-007-9017-8 [Google Scholar]
- Claudepierre SG, Elkington SR, and Wiltberger M (2008). Solar wind driving of magnetospheric ULF waves: Pulsations driven by velocity shear at the magnetopause. Journal of Geophysical Research, 113, A05218 https://doi.org/10.1029/2007JA012890 [Google Scholar]
- Claudepierre SG, et al. (2013). Van Allen Probes observation of localized drift resonance between poloidal mode ultra-low frequency waves and 60 keV electrons. Geophysical Research Letters, 40, 4491–4497. https://doi.org/10.1002/grl.50901 [Google Scholar]
- Dai L, et al. (2013). Excitation of poloidal standing Alfvén waves through drift resonance wave-particle interaction. Geophysical Research Letters, 40, 4127–4132. https://doi.org/10.1002/grl.50800 [Google Scholar]
- Dai L, et al. (2015). Storm time occurrence and spatial distribution of Pc4 poloidal ULF waves in the inner magnetosphere: A Van Allen Probes statistical study. Journal of Geophysical Research: Space Physics, 120, 4748–4762, https://doi.org/10.1002/2015JA021134 [Google Scholar]
- Engebretson MJ, et al. (1992). The spatial extent of radial magnetic pulsation events observed in the dayside near synchronous orbit. Journal of Geophysical Research, 97(A9), 11–13758. https://doi.org/10.1029/92JA00992 [Google Scholar]
- Fraser BJ, Horwitz JL, Slavin JA, Dent ZC, and Mann IR (2005). Heavy ion mass loading of the geomagnetic field near the plasmapause and ULF wave implications. Geophysical Research Letters, 32(4). https://doi.org/10.1029/2004gl021315 [Google Scholar]
- Hamlin DA, Karplus R, Vik RC, & Watson KM (1961). Mirror and azimuthal drift frequencies for geomagnetically trapped particles. Journal of Geophysical Research, 66(1), 1–4. https://doi.org/10.1029/JZ066i001p00001 [Google Scholar]
- Hudson MK, Denton RE, Lessard MR, Miftakhova EG, and Anderson RR (2004). A study of Pc–5 ULF oscillations. Annales Geophysicae, 22, 289–302. https://doi.org/10.5194/angeo-22-289-2004 [Google Scholar]
- Hughes WJ, & Southwood DJ (1976). The screening of micropulsation signals by the atmosphere and ionosphere. Journal of Geophysical Research, 81 (19), 3234–3240. https://doi.org/10.1029/JA081i019p03234 [Google Scholar]
- Hughes WJ, and Grard RJL (1984). A second harmonic geomagnetic field line resonance at the inner edge of the plasma sheet: GEOS 1, ISEE 1, and ISEE 2 observations. Journal of Geophysical Research, 89(A5), 2755–2764. https://doi.org/10.1029/JA089iA05p02755 [Google Scholar]
- King JH, and Papitashvili NE (2005). Solar wind spatial scales in and comparisons of hourly Wind and ACE plasma and magnetic field data. Journal of Geophysical Research, 110, A02104 https://doi.org/10.1029/2004JA010649 [Google Scholar]
- Korotova G, Sibeck D, Engebretson M, Wygant J, Thaller S, Spence H, … Redmon R (2016). Multipoint spacecraft observations of long-lasting poloidal Pc4 pulsations in the dayside magnetosphere on 1-2, May 2014. Annales Geophysicae, 34 (11), 985–998. https://doi.org/10.5194/angeo-34-985-2016 [Google Scholar]
- Le G, et al. (2017). Global observations of magnetospheric high-m poloidal waves during the 22 June 2015 magnetic storm. Geophysical Research Letters, 44, 3456–3464. https://doi.org/10.1002/2017GL073048 [DOI] [PMC free article] [PubMed] [Google Scholar]
- Lin D, Wang C, Li WY, Tang BB, Guo XC, and Peng Z. (2014). Properties of Kelvin-Helmholtz waves at the magnetopause under northward interplanetary magnetic field: Statistical study. Journal of Geophysical Research: Space Physics, 119 (9), 7485–7494. https://doi.org/10.1002/2014JA020379 [Google Scholar]
- Liu W, Cao JB, Li X, Sarris TE, Zong QG, Hartinger M, … Angelopoulos V (2013). Poloidal ULF wave observed in the plasmasphere boundary layer. Journal of Geophysical Research: Space Physics, 118, 4298–4307. https://doi.org/10.1002/jgra.50427 [Google Scholar]
- Mann IR, et al. (2008). The upgraded CARISMA magnetometer array in the THEMIS era. Space Science Reviews, 141, 413–451. https://doi.org/10.1007/s11214-008-9457-6 [Google Scholar]
- Maynard NC, & Chen AJ (1975). Isolated cold plasma regions: Observations and their relation to possible production mechanisms. Journal of Geophysical Research, 80(7), 1009–1013. https://doi.org/10.1029/JA080i007p01009 [Google Scholar]
- McFadden JP, Carlson CW, Larson D, Ludlam M, Abiad R, Elliott B, … Angelopoulos V (2008). The THEMIS ESA plasma instrument and in-flight calibration. Space Science Reviews, 141, 277–302. https://doi.org/10.1007/s11214-008-9440-2 [Google Scholar]
- Min K, Takahashi K, Ukhorskiy AY, Manweiler JW, Spence HE, Singer HJ, … Cohen RJ (2017). Second harmonic poloidal waves observed by Van Allen Probes in the dusk-midnight sector. Journal of Geophysical Research: Space Physics, 122, 3013–3039. https://doi.org/10.1002/2016JA023770 [Google Scholar]
- Motoba T, Takahashi K, Rodriguez JV, & Russell CT (2015). Giant pulsations on the afternoonside: Geostationary satellite and ground observations. Journal of Geophysical Research: Space Physics, 120, 8350–8367. https://doi.org/10.1002/2015JA021592 [Google Scholar]
- Murphy KR, Mann IR, & Ozeke LG (2014). A ULF wave driver of ring current energization. Geophysical Research Letters, 41 (19), 6595–6602. https://doi.org/10.1002/2014GL061253 [Google Scholar]
- Oimatsu S, Nose M, Takahashi K, Yamamoto K, Keika K, Kletzing CA, et al. (2018). Van Allen Probes observations of drift-bounce resonance and energy transfer between energetic ring current protons and poloidal Pc4 wave. Journal of Geophysical Research: Space Physics, 123, 3421–3435. https://doi.org/10.1029/2017JA025087 [Google Scholar]
- Ozeke LG, and Mann IR (2001). Modeling the properties of high-m Alfvén waves driven by the drift-bounce resonance mechanism. Journal of Geophysical Research, 106(A8), 15583–15597. https://doi.org/10.1029/2000JA000393 [Google Scholar]
- Rodriguez JV (2014). GOES 13–15 MAGE/PD pitch angles algorithm theoretical basis document, version 1.0. Boulder, CO: NOAA National Geophysical Data Center. Retrieved from http://www.ngdc.noaa.gov/stp/satellite/goes/documentation.html [Google Scholar]
- Sarris T, Li X, & Singer HJ (2009). A long-duration narrowband Pc5 pulsation. Journal of Geophysical Research, 114, A01213 https://doi.org/10.1029/2007JA012660 [Google Scholar]
- Shepherd SG (2014). Altitude-adjusted corrected geomagnetic coordinates: Definition and functional approximations. Journal of Geophysical Research: Space Physics, 119, 7501–7521. https://doi.org/10.1002/2014JA020264 [Google Scholar]
- Shi X, Ruohoniemi JM, Baker JBH, Lin D, Bland EC, Hartinger MD, & Scales WA (2018). Survey of ionospheric Pc3–5 ULF wave signatures in Super-DARN high time resolution data. Journal of Geophysical Research: Space Physics, 123, https://doi.org/10.1029/2017JA025033 [DOI] [PMC free article] [PubMed] [Google Scholar]
- Singer HJ, Matheson L, Grubb R, Newman A, & Bouwer SD (1996). Monitoring space weather with the GOES magnetometers. Proceedings of SPIE The International Society for Optical Engineering, 2812, 299–308. [Google Scholar]
- Southwood DJ (1976). A general approach to low-frequency instability in the ring current plasma. Journal of Geophysical Research, 81 (19), 3340–3348. https://doi.org/10.1029/JA081i019p03340 [Google Scholar]
- Southwood DJ, & Hughes WJ (1983). Theory of hydromagnetic waves in the magnetosphere. Space Science Reviews, 35(4), 301–366. https://doi.org/10.1007/bf00169231 [Google Scholar]
- Takahashi K, and McPherron RL (1984). Standing hydromagnetic oscillations in the magnetosphere. Planetary and Space Science, 32(11), 1343–1359. https://doi.org/10.1016/0032-0633(84)90078-3 [Google Scholar]
- Takahashi K, McEntire RW, Lui ATY, and Potemra TA (1990). Ion flux oscillations associated with a radially polarized transverse Pc5 magnetic pulsation. Journal of Geophy.sica,l Research, 95(A4), 3717–3731. https://doi.org/10.1029/JA095iA04p03717 [Google Scholar]
- Takahashi K, Oimatsu S, Nose M, Min K, Claudepierre SG, Chan A, … Kim H (2018). Van Allen Probes observations of second-harmonic poloidal standing Alfvén waves. Journal of Geophysical Research: Space Physics, 123, 611–637. https://doi.org/10.1002/2017JA024869 [Google Scholar]
- Tsyganenko NA, and Stern DP (1996). Modeling the global magnetic field of the large-scale Birkeland current systems. Journal of Geophysical Research, 101 (A12), 27,187–27,198. https://doi.org/10.1029/96JA02735 [Google Scholar]
- Waters CL, Menk FW, and Fraser BJ (1991). The Resonance Structure of Low Latitude Pc3 Geomagnetic-Pulsations. Geophysical Research Letters, 18(12), 2293–2296. https://doi.org/10.1029/91gl02550 [Google Scholar]
- Wright DM, Yeoman TK, Rae IJ, Storey J, Stockton-Chalk AB, Roeder JL & Trattner KJ (2001). Ground-based and Polar spacecraft observations of a giant (Pg) pulsation and its associated source mechanism. Journal of Geophysical Research, 106, 10,837–10,852. https://doi.org/10.1029/2001JA900022 [Google Scholar]
- Yeoman TK, & Wright DM (2001). ULF waves with drift resonance and drift-bounce resonance energy sources as observed in artificially-induced HF radar backscatter. Annales Geophysicae, 19(2), 159–170. https://doi.org/10.5194/angeo-19-159-2001 [Google Scholar]
- Zong Q-G, Zhou X-Z, Wang YF, Li X, Song P, Baker DN, Fritz TA, Daly PW, Dunlop M, and Pedersen A (2009). Energetic electron response to ULF waves induced by interplanetary shocks in the outer radiation belt. Journal of Geophysical Research, 114, A10204 https://doi.org/10.1029/2009JA014393 [Google Scholar]


