

Abstract
A previous genome-wide association study (GWAS) identified common variation at the BARD1 locus as being highly associated with susceptibility to high-risk neuroblastoma, but the mechanisms underlying this association have been not extensively investigated.
Here, we performed a fine mapping analysis of BARD1 locus (2q35) using GWAS data from 556 high-risk neuroblastoma patients and 2,575 controls of European-American ancestry, and identified two independent genome-wide neuroblastoma-associated loci. Functional single-nucleotide polymorphism (SNP) prioritization identified two causative variants that independently contributed to neuroblastoma risk, and each replicated robustly in multiple independent cohorts comprising 445 high-risk cases and 3,170 controls (rs17489363: combined P=1.07×10⁻³¹, OR:1.79, 95% CI:1.62–1.98 and rs1048108: combined P=7.27×10⁻¹⁴, OR:0.65, 95% CI:0.58–0.73). Particularly, the risk allele T of rs17489363 in the canonical promoter region of full-length BARD1 altered binding sites of the transcription factor HSF1 and correlated with low expression of full-length BARD1 mRNA and protein. Low-level expression of full-length BARD1 associated with advanced neuroblastoma. In human neuroblastoma cells, attenuating full-length BARD1 increased proliferation and invasion capacity.
In conclusion, we have identified two potentially causative SNPs at the BARD1 locus associated with predisposition to high-risk neuroblastoma, and have shown that full-length BARD1 may act as tumor suppressor.
Keywords: neuroblastoma, BARD1, SNP, GWAS, fine mapping
Introduction
Genome-wide association studies (GWASs) have revolutionized the approach to identify genomic regions associated with complex diseases. In oncology, almost all common malignancies have been studied by GWAS and several genetic variants associated with increased risks have been identified 1. These discoveries have suggested that much of the genetic architecture of cancer susceptibility is explained by polygenic inheritance. One of the most relevant deliverables from GWAS is also that the identification of causative variants of genes in specific pathways would provide new insights into cancer biology as previously demonstrated 1, 2. However, variants identified within the above mentioned studies are usually markers and not represent the causative variants themselves. As a consequence, GWAS design does not lead necessarily to the identification of causative variants, since the tested single nucleotide polymorphisms (SNPs) are merely tagging SNPs in linkage disequilibrium (LD) with the causal variants. Post-GWAS strategies are trying to solve these problems using different approaches such as imputation analyses, meta-analysis and next generation sequencing. A recent study reports that epigenomic annotations can pinpoint locations of biochemical activity indicative of cis-regulatory functions 3. Indeed, comparison with genome-wide annotations of putative regulatory elements has shown enrichment of GWAS variants in enhancer-associated histone modifications, regions of open chromatin, and conserved non-coding elements 3, 4, indicating they may play gene-regulatory roles. The integration of post-GWAS approaches with epigenomic annotations might facilitate the detection of causal mutations that are hidden within LD blocks encompassing the surrogate markers from GWAS.
We have previously demonstrated by GWAS and candidate gene approaches that genetic variants within the CASC15, BARD1, LMO1, DUSP12, HSD17B12, TP53, HACE1, LIN28B, MLF1, CPZ, NEFL and CDKN1B 5–13 genes are highly associated with neuroblastoma, a pediatric tumor that arises from the sympathetic nervous system 14. Most neuroblastomas occur sporadically and about 50% of patients are categorized, based on genomic and clinical markers, as “high-risk” with survival rates below 50% despite dose-intensive chemo-radiotherapy 14. All of these genetic associations have been replicated in an Italian population 15. However, these risk variants only explain a small proportion of neuroblastoma heritability and additional predisposing variants to neuroblastoma remain unsolved.
One of the most significant and robustly replicated association signals enriched in the high-risk subset of neuroblastoma resides at BARD1 (BRCA1-associated RING domain protein 1) locus at chromosome 2q35 6, 15. Common genetic variants have been replicated in Chinese population and associated to other tumors 16, 17. Full-length (FL) BARD1 is an important regulator of the tumor-suppressor function of BRCA1 (Breast Cancer 1), as well as acting as a tumor-suppressor itself 18. On the contrary, aberrant isoforms of BARD1 have tumor promoting functions. In line with this dualistic role of BARD1 in cancer, our GWAS has shown that the genetic variant rs6435862, located in the intron 3 of BARD1, was strongly associated with high-risk neuroblastoma 6, 15 and its risk allele correlated with high expression of the oncogenic BARD1β isoform, with an increased tumorigenicity of neuroblastoma cell lines 19; while the rs7585356 variant, located in 3′ downstream of BARD1, was found to be an additional and independent risk factor for neuroblastoma and its risk allele correlated with a decreased expression of FL BARD1 15. These findings have suggested that, at same locus (2q35), there could be specific risk alleles that correlate with high expression of oncogenic BARD1 isoforms and other independent risk alleles associated with low expression of tumor-suppressor FL BARD1 form. However, the above-mentioned variants are markers and could not represent the causative variants themselves.
Here, to identify causative variants associated with high-risk neuroblastoma at the BARD1 locus, we performed fine-mapping and we found diverse highly correlated candidate variants for functional follow up. By investigating this set of genetic variants that are most strongly associated with high-risk neuroblastoma, we identified two independent genome-wide neuroblastoma-associated loci. Our functional SNP prioritization identified two potentially causative SNPs (rs17489363 C>T and rs1048108 G>A) in two different loci with opposite effect on the neuroblastoma risk. Additional in vitro and in silico analyses have demonstrated that the T risk allele of the rs17489363 SNP in the promoter of BARD1 correlated with a decreased expression of FL BARD1 suggesting its role as tumor-suppressor in neuroblastoma which has been experimentally confirmed in neuroblastoma cell lines.
Materials and Methods
Genome-wide SNP genotyping and genotype imputation
This study was approved by the Ethics Committee of the Medical University of Naples and the Children’s Hospital of Philadelphia.
This study included a GWAS dataset of 595 high-risk neuroblastoma patients (Supplementary Table S1) registered through the North American-based Children’s Oncology Group (COG) and 2,575 controls cancer-free children of self-reported Caucasian ancestry who were recruited and genotyped by the Center for Applied Genomics at the Children’s Hospital of Philadelphia (CHOP) using Illumina Infinium II BeadChip and HumanHap550 v1 and v3 arrays (Illumina, San Diego, CA, USA) according to methods detailed elsewhere 6, 8. Samples were assigned into high-risk group based on the COG risk assignment 14. For the 479,810 SNPs included in this dataset, the total genotyping rate in all individuals was 0.996 and the minor allele frequency was equal or greater than 0.05. None SNP markers deviated from Hardy-Weinberg Equilibrium (P>0.001). The genomic control inflation factor for this data set was 1.06. SHAPEIT 20 and IMPUTE2 21 were applied to infer genotypes at the 2q35 locus using data from the 1000Genomes Phase 3 NCBI build:b37 Haplotype release date oct 2014 (Supplementary Information). Genotypes for a previously described African-American replication cohort (African-American set 1) of 159 high-risk cases 2,095 controls 10 were imputed and tested for neuroblastoma association using the same analytic pipeline (Supplementary Information). An additional African-American cohort (African-American set 2) comprised 60 high-risk cases and 273 controls was the only one genotyped on the Illumina OmniExpress 770 array and not previously published (Supplementary Information). Genotypes for African-American set 2 were imputed and tested for neuroblastoma association using the same analytic pipeline (Supplementary Information).
Replication in Italian and Spanish cohorts.
Genotyping the SNP rs17489363 and rs1048108 was performed using TaqMan SNP genotyping assays (Life Technology). The Italian cohort was of a total of 187 high-risk neuroblastoma cases and 749 controls. The replication cohort from Spain included 39 high-risk cases and 60 controls in total. Part of the Italian samples (137 high-risk cases and 749 controls) was genotyped for rs1048108 in a previously published paper 15.
Definition of independent genome-wide associated loci
We divided the 198 genome-wide significant SNPs in 2 independent loci according to the following algorithm. The SNPs were first sorted according to their association P value. Then, the lead SNP, considered as the most significant SNP in a given genomic locus, was removed from this list and assigned to an independent locus together with all other SNPs which have a r2 value less than or equal to 0.2 with this SNP. This procedure was recursively applied to the remaining SNPs in the list, so that each SNP could be assigned to a locus and no SNPs were left in the original list.
Identification of causal functional variants
A detailed description of SNP filtering strategy (Fig. 1A) designed to identify causal functional variants is reported in Supplementary Information.
Fig. 1. Fine mapping of the 2q35 locus.
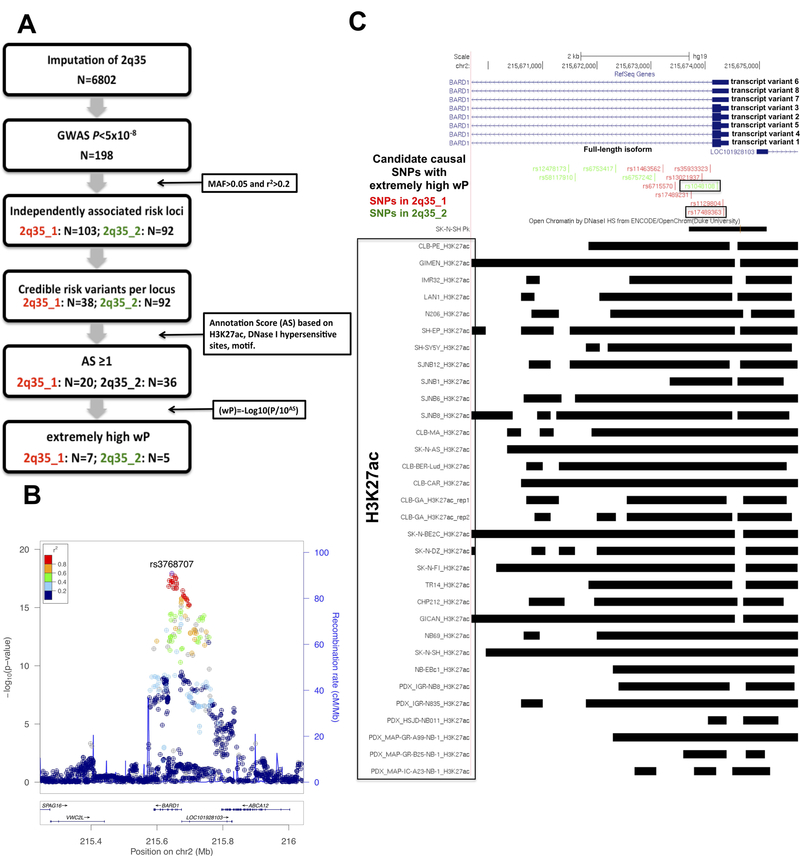
A) Filtration strategy employed to refine list of imputed SNPs at the 2q35 locus for functional variants (“N” indicates the number of SNPs). We identified 2 independent risk loci SNPs in 198 GWAS SNPs (P<5× 10⁻⁸). Only the SNPs (credible risk variants) with P value within two orders of magnitude of the most significant SNP in each locus were filtered. A score based on epigenetic annotations (derived neuroblastoma and PDX cell lines) and motif predictions were assigned to remaining SNPs. Further refinement based on weighted (w)P value identified 12 potential causal variants (full tables of SNP attributes are given in Table S4 and S5). B) Regional association plots of genotyped and imputed SNPs at 2q35 locus. Plots were generated using LocusZoom. Y-axes represent the significance of association (-log10 transformed P values) and the recombination rate. SNPs are color-coded based on pair-wise linkage disequilibrium (r2) with indicated SNP rs3768707. C) Active chromatin denoted by H3K27ac signal in 26 human derived-neuroblastoma and 6 patient derived xenograft cell lines, and by DNAse hypersensitive sites in SKNSH cell lines. The green colored SNPs belong to the locus 1 (2q35_1) whereas those red colored to the locus 2 (2q35_1). The SNPs in the boxes are the most significant functional SNPs in each locus. The gene transcript variants are retrieved from UCSC Genes track (www.ucsc.edu).
SNP-gene expression correlation analysis in tumor and healthy tissues
The influence of SNPs on FL BARD1 gene expression was evaluated using data from genome-wide mRNA expression (GSE16476) and RNA sequencing (RNA-seq) profiling (http://target.nci.nih.gov/dataMatrix/TARGET_DataMatrix.html) on neuroblastoma samples and from QRT-PCR and protein analysis on lymphoblastoid cell lines. A detailed description of the analysis is reported in Supplementary Information and in TARGET Project Experimental Methods web page (https://ocg.cancer.gov/programs/target/target-methods#3216). Manny-Whitney test was used to compare the differences in the mRNA and protein expression levels.
Association analysis of FL BARD1 expression with neuroblastoma phenotypes.
We used the above-mentioned RNA-seq data from clinically annotated neuroblastomas analyzed through TARGET project (see Supplementary Information). The COG risk and INSS stage clinical data were available for 127 and 147 samples, respectively. We also used RNA expression profiles of 105 and 493 clinically annotated primary neuroblastomas derived from two independent 4 × 44k oligonucleotide microarray datasets (Agilent Technologies) (GEO ID: GSE73517 and GSE49710) and of 4 micro dissected ganglioneuromas and 5 neuroblastomas derived from Affymetrix Human Genome U133A Array (GEO ID: GSE7529). The significant difference of gene expression among the tumor phenotypes was evaluated with Mann-Whitney test.
Cell culture
The human SHSY5Y, SKNSH, SKNAS and HEK293T cell lines were obtained from the American Type Culture Collection (respectively ATCC #CRL-2266, HTB-11, and #CRL-11268); the human IMR32 cell line was obtained from SIGMA (86041809). SHSY5Y, SKNAS, SKNSH, and HEK293T cell lines were grown in Dulbecco’s Modified Eagle Medium (DMEM; Sigma); IMR32 cell line was grown in Minimal Essential Eagle Medium (MEM; Sigma). The medium was supplemented with 10% heat-inactivated FBS (Sigma), 1 mmol/L L-glutamine, penicillin (100 U/mL), and streptomycin (100mg/mL;Invitrogen). The cells were cultured at 37° C, 5% CO2 in a humidified atmosphere. The cell lines used for all the experiments were reauthenticated and tested as mycoplasma-free. Early-passage cells were used and cumulative culture length was less than 3 months after resuscitation.
In vitro functional analysis
A detailed description of the luciferase assay, chromatin immunoprecipitation (ChIP) and other experiments performed as previously described 22 to evaluate the FL BARD1 effect on neuroblastoma cell line phenotype is reported in Supplementary Information.
Statistical analysis
Hardy-Weinberg equilibrium was evaluated using the goodness-of-fit chi-square test in control subjects. For genotyped SNPs, two-sided chi-square tests were used to evaluate differences in the distributions of allele frequencies between all patients and controls. Odds ratios (ORs) and 95% confidence intervals (CIs) were calculated to assess the relative disease risk conferred by a specific allele. Meta-analysis was performed using the inverse-variance method within the METAL 23 software package, and a fixed-effects model was assumed. Interactions between variants were tested by logistic regression analysis. Conditional analysis was performed with GCTA software 24. QRT-PCR data were analyzed by 2^-Δct method as described in our previous paper 25. Student’s t -test was used to compare the differences between means in vitro functional studies.
Results
Two functional SNPs are independently associated with high-risk neuroblastoma
We employed the following fine mapping strategy (Fig. 1A) to identify the causative SNPs. We performed imputation of the 2q35 neuroblastoma risk locus (originally marked by rs6435862 in BARD1) using the GWAS dataset of 595 high-risk neuroblastoma (Supplementary Table S1) and 2,575 controls with European American origins and imputation reference dataset 1000Genomes Phase 3 NCBI build:b37 Haplotype release date oct 2014. We imputed 6,802 SNPs and identified 2 independent loci (here named: 2q35_1 and 2q35_2) in 198 genome-wide significant SNPs (P<5×10⁻⁸) (see Methods, Fig. 1B, Supplementary Table S2 and S3). To investigate whether more than one association signal may exist at 2q35_1 and 2q35_2, we conditioned our analysis of locus 2q35_1 on the lead SNP (rs3768707) and our analysis of 2q35_2 on the lead SNP (rs1048108). No evidence for a separate association signal was observed at 2q35_1 locus (Supplementary Fig. S1A) but a potential independent second signal (rs7588888) was observed at 2q35_2 locus (Supplementary Fig. S1B). Then, to define a set of credible risk variants (CRVs) at these two loci, we selected variants with P values within two orders of magnitude of the most significant SNPs in each region (see Supplementary Information, Supplementary Table S4 and S5). Across the two defined regions, we identified 130 CRVs. H3K27 acetylation (H3K27ac) is linked to the activation of enhancers and promoters 26. Therefore, in order to highlight potentially functional variants, we annotated each CRVs with histone marker H3K27ac by using ChIPseq data derived form 26 human derived-neuroblastoma and 6 patient-derived xenograft (PDX cell) lines deposited in GEO database (GSE90683) (Supplementary Table S4 and S5, Supplementary Fig. S2). Moreover, to annotate the CRVs, we also used the computational predictions of potential binding motif alterations of nucleotide variants implemented in RegulomeDB 27 database and the open chromatin sites in SKNSH cell lines (ENCODE project). To prioritize causal functional variants, we calculated a log10 transformed weighted P value (wP) for each CRVs which is adjusted according to the functional annotation score (see Supplementary Information, Supplementary Table S4 and S5). We then identified those SNPs with extremely high wPs (see Supplementary Information, Supplementary Table S4 and S5). In the locus 2q35_1, we found 7 SNPs with extremely high wPs and the top 5 of these were also annotated with the open chromatin site in SKNSH cell lines (Fig. 1C, Supplementary Table S4). The SNP rs17489363 was the most significant (wP=50.22), predicted to alter the binding site of two transcription factors and located in the promoter of FL BARD1 (Fig. 1C, Supplementary Table S4). Looking at the SNPs at 2q35_2, five of these showed extreme wPs (Fig. 1C, Supplementary Table S5) and only the most significant SNP rs1048108 (wP=41.96) was annotated with the open chromatin site in SHNSH cell lines while two SNPs (rs6757242 and rs6753417) were predicted to alter the binding site of transcription factors: Mrf-2 and Sp1, respectively (Fig. 1C and Supplementary Table S5). None was located in the promoter of FL BARD1. Interestingly, the 12 prioritized SNP variants (7 in 2q35_1 and 5 in 2q35_2) of the two independent GWAS associated loci are very close to each other but not in LD (Supplementary Fig. S3) Indeed, the most significant functional causal SNPs rs17489363 (2q35_1) and rs1048108 (2q35_2) (Supplementary Table S4 and S5) showed opposite odds ratios (Table 1) and interaction analysis between the two SNPs revealed no interaction (P=0.40, OR=1.04), suggesting that these loci may contribute independently to neuroblastoma risk.
Table 1.
Statistically significant and replicate associations of rs17489363 and rs 1048108 SNPS
| SNP | Major Allele | Minor Allele | *Cohort | MAF Hight-risk cases (N=1040) |
MAF controls (N=5,745) |
^P-value | OR (95% cl) |
|---|---|---|---|---|---|---|---|
| rs17489363 | C | T | European American | 0.43 (n=595) | 0.03 (n=2,575) | 1.90 × 10⁻¹⁶ | 1.72 (1.51–1.96) |
| °African American set 1 | 0.38 (n=159) | 0.24 (n=2,095) | 4.25×10⁻⁸ | 1.90 (1.50–2.41) | |||
| °African American set 2 | 0.30 (n=60) | 0.30 (n=273) | 0.02 | 1.69 (1.07–2.63) | |||
| Italian | 0.045 (n=187) | 0.31 (n=60) | 2.96×10⁻⁸ | 1.91 (1.52–2.42) | |||
| Spanish | 0.46 (n=39) | 0.03 | 1.92 (1.06–3.47) | ||||
| Combined | 1.07×10⁻³¹ | 1.79 (1.62–1.98) | |||||
| rs1048108 | G | A | European American | 0.27 (n=595) | 0.37 (n=2,575) | 3.49 × 10⁻¹⁰ | 0.63 (0.55–0.73) |
| African American set 1 | 0.14 (n=159) | 0.21 (n=2095) | 0.004 | 0.61 (0.44–0.85) | |||
| African American set 2 | 0.14 (n=60) | 0.26 (n=273) | 0.05 | 0.57 (0.33–0.98) | |||
| Italian | 0.36 (n-151) | 0.37 (n=749) | 0.03 | 0.74 (0.57–0.97) | |||
| Spanish | 0.26 (n=39) | 0.33 (n=56) | 0.27 | 0.70 (0.37–1.33) | |||
| Combined | 7.27×10⁻¹⁴ | 0.65 (0.58–0.73) | |||||
MAF: Minor Allele Frequency
CI: Confidence Interval
OR: Odds Ratio With respect to the minor (risk) allele
No deviation from Hardy-Weinberg equilibrium were observed (P>0.001) in all cohorts
Allelic P-values; combined P-values from meta-analysis using METAL
Typed by two diefferent SNP arrays.
In bold the significant genetic associaition
Overall, the results of this functional SNP prioritization led us to further validate the genetic associations of rs17489363 and rs1048108 in four independent sets of cases and controls. However, there are other variants that warrant further study.
Replication study for the SNPs rs17489363 and rs1048108
The minor T allele of rs17489363 SNP (in the promoter region of FL BARD1) was associated with risk of development a clinically aggressive (high-risk) neuroblastoma (European American: P=1.90×10⁻¹⁶; OR: 1.72, 95% CI: 1.51–1.96); whereas the minor A allele of rs1048108 (in exon 1 of FL BARD1) was inversely associated (European American: P=3.49×10⁻¹⁰; OR: 0.63, 95% CI: 0.55–0.73) in our discovery set of 595 high risk cases and 2,575 controls (Table 1). We next sought to replicate these genetic associations in four independent cohorts. First, we analyzed an African-American set 1 of 159 neuroblastoma high-risk cases and 2,095 genetically matched controls genotyped on the Illumina HumanHap550 or Quad-610 bead chips and an additional African-American set 2 of 60 neuroblastoma high-risk cases and 273 genetically matched controls genotyped on Illumina OmniExpress 770 array. SHAPEIT 20 and IMPUTE2 21 were applied to infer genotypes at the 2q35 locus using data from the 1000Genomes Phase 3 NCBI build:b37 Haplotype release date oct 2014 in a manner similar to the European American cohort. Utilizing the proportion of African admixture as a covariate to correct for varying degrees of admixture among our samples, we confirmed the association of rs17489363 (African-American set 1: P=4.25×10⁻⁸; OR: 1.90, 95% CI: 1.50–2.41; African-American set 2: P=0.02; OR: 1.69, 95% CI: 1.07–2.63; Table 1) and of rs1048108 (African-American set 1: P= 0.004; OR: 0.61, 95% CI: 0.44–0.85; African-American set 2: P=0.05; OR: 0.57, 95% CI: 0.33–0.98; Table 1). Next, we performed PCR-based genotyping in two additional independent cohorts. We genotyped an Italian cohort of 187 high-risk neuroblastoma cases and 742 controls and a Spanish cohort of 39 high risk cases and 60 controls and confirmed the association of rs17489363 (Italians: P=2.96×10⁻⁸, OR: 1.91, 95% CI: 1.52–2.42; Spanish: P=0.03, OR: 1.92, 95% CI: 1.06–3.47; Table 1). In contrast, the association of rs1048108 was confirmed only in the Italian cohort (Italians: P=0.03, OR: 0.74, 95% CI: 0.57–0.97; Spanish: P=0.27, OR: 0.70, 95% CI: 0.37–1.33; Table 1). Meta-analysis using the inverse-variance method within METAL 23 resulted in highly significant associations with high-risk neuroblastoma (rs17489363: P=1.07×10⁻³¹, OR: 1.79, 95% CI:1.62–1.98 and rs1048108: P=7.27×10⁻¹⁴, OR: 0.65, 95% CI:0.58–0.73; Table 1).
The results of our genetic and functional prioritization analyses have indicated the rs17489363 SNP as the most significant; we thus decided to focus on the functional investigation of this SNP. However, additional studies to dissect the function of rs1048108 SNP in affecting alternative isoforms of BARD1 are warranted.
The T risk allele of rs17489363 correlates with low expression of FL BARD1
To investigate if rs17489363 variant functions as expression quantitative trait loci (eQTLs) for FL BARD1, we tested for SNP-gene expression associations. The analysis of gene expression variation using genome-wide expression and SNP arrays of neuroblastoma tumors suggested that the SNP might affect expression of FL BARD1. In particular, the presence of the risk allele T correlated with decreased BARD1 mRNA expression in a set of 84 tumors (Fig. 2A; P=0.036). This result was confirmed when we measured the FL BARD1 levels in a set of 75 high-risk tumors profiled by RNA-seq (Fig. 2B; P=0.005) and in 28 and 16 lymphoblastoid cell lines derived from healthy individuals analyzed by QRT-PCR and western blotting assay, respectively (Supplementary Fig. S4A: P=0.04, Supplementary Fig. S4B: P=0.027). We next explored data from the Genotype-Tissue Expression (GTEx) project available through the GTEx Portal. Notable, rs17489363 was identified as cis-QTL for BARD1 in adrenal gland tissues (Supplementary Fig. S4C, P=7.6×10⁻⁸,) from which commonly neuroblastoma arises. The induction of promoter activity of the construct containing rs17489363 -T allele was lower than that of the construct containing C alleles as assessed by luciferase report gene assay in HEK293T cells (Fig. 2C, P=5.4×10⁻⁸).
Fig. 2. Functional analysis of rs17489363.
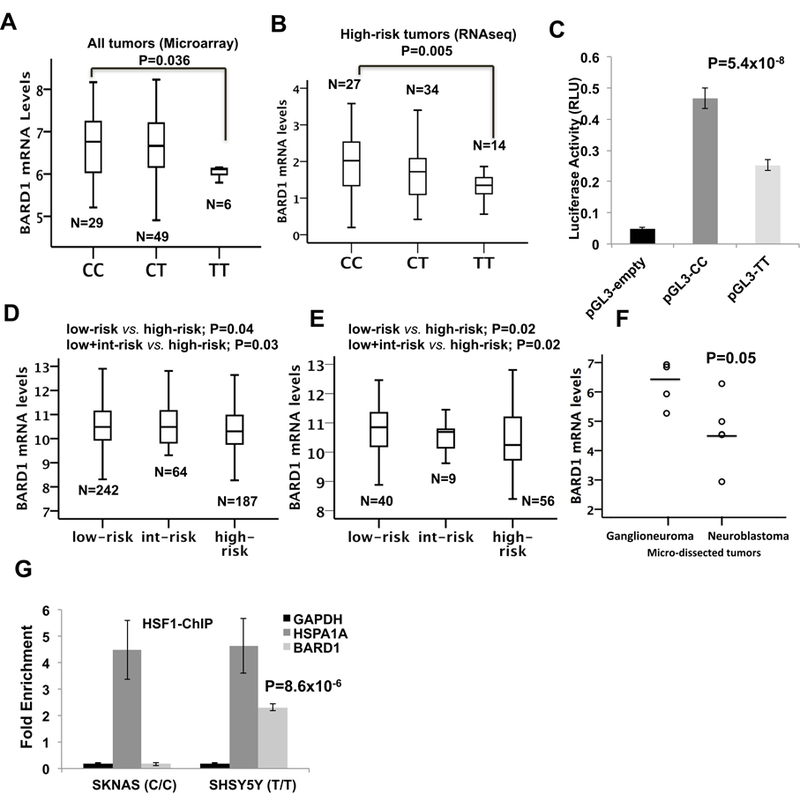
Microarray-based expression profiling on primary tumors demonstrates that lower BARD1 expression correlates with TT risk genotypes. B) RNA-seq profiling of high-risk neuroblastoma tumors confirms the association between rs17489363 TT genotype and lower expression of FL BARD1. C) Luciferase report gene assay carried out in HEK293T cells confirms that the T risk alleles correlate with a lower luciferase activity. Data shown are the mean ± standard deviation from nine independent transfection experiments, each done in triplicate and compared with promoter less control. D) Gene expression microarray from clinically annotated primary neuroblastoma tumors obtained at diagnosis reveals that high-risk neuroblastomas (n = 242) have significantly lower expression of FL BARD1 than low (n=187) and intermediate-risk tumors (n = 64). E) Gene expression microarray data shows that high-risk neuroblastomas (n = 40) have significantly lower expression of BARD1 than low (n=56) and intermediate-risk tumors (n= 9). F) Gene expression microarray data shows that micro dissected neuroblastomas (n=5) have significantly lower expression of BARD1 than ganglioneuromas (n=4). “Int-risk” indicates intermediate-risk. G) HSF1 preferentially binds to the T risk allele of rs17489363, as determined by ChIP assay.
Because the rs17489363 homozygous risk genotype is associated with aggressive neuroblastoma and with decreased transcriptional activity, we postulated that patients with high-risk disease would have reduced FL BARD1 expression. Indeed, we observed significantly lower FL BARD1 expression in high-risk patient tumors compared with low and intermediate risk patient tumors (Fig. 2D). In addition, patients with favorable tumors (Stage 4s) again showed higher expression of FL BARD1 when compared to metastatic tumors (Stage 4) (Supplementary Fig. S5A and S5B). These results were validated in two independent cohorts of neuroblastomas (Fig. 2E and Supplementary Fig. S5C) and of micro dissected ganglioneuromas and neuroblastomas (Fig. 2F) profiled using two different microarray platforms. Taken together, these data indicate that low FL BARD1 expression correlates with a more aggressive phenotype in neuroblastoma.
SNP rs17489363 affects protein-DNA interaction
Bioinformatic analysis suggested allele-specific transcription factor binding for rs17489363. The tool RegulomeDB 27 predicted a high binding affinity of the risk allele T to heat shock factor (HSF)1 and Ewing sarcoma breakpoint region 1 (EWSR1) fusion with Friend leukemia integration 1 transcription factor (FLI1) (EWSR1-FLI1). TRAP 28 confirmed the Regulome DB prediction only for HSF1. To examine transcription factor binding in vivo by ChIP, the SHSY5Y (T/T risk homozygote) and SKNAS (C/C not risk homozygote) were chosen. In HSF1-ChIP assays, the T/T alleles of rs17489363 present in SHSY5Y were strongly enriched compared to a negative control (GAPDH) from the BARD1 locus (Fig. 2G). However, the C/C alleles present in SKNAS were enriched compared to a negative control (GAPDH) but were less enriched compared to T/T alleles present in SHSY5Y (Fig. 2G). HSF1 binding of HSAPA1 locus was used as positive control of ChIP assays for both cell lines. HSF1 preferentially binding to the T risk allele of rs17489363 has been confirmed in additional neuroblastoma cell lines: IMR32 (C/C not risk homozygote) and in SKNSH (T/T risk homozygote), as determined by ChIP assay (Supplementary Fig. S6). This finding further underlines the functional role of rs17489363.
FL BARD1 has tumor-suppressor function
Our genetic analysis has suggested FL BARD1 as tumor-suppressor in neuroblastoma. We thus examined the consequence of FL BARD1 knock down by using short hairpin RNA (shRNA) against BARD1 delivered by lentiviral particles in SKNSH and SHSY5Y cells which have shown the protein expression of FL BARD1 (Supplementary Fig. S7). A non-silencing shRNA was delivered using the lentivirus in the control cells (shCTR). We have performed all the experiments by using two different shRNA against BARD1. The efficiency of FL BARD1 (97kDa) knockdown was verified on western blots probed with anti-BARD1 (Fig. 3A). Knockdown of FL BARD1 markedly increased cell vitality in both cell lines (shBARD1#A and shBARD1#B) compared to the control cells (shCTR) (Fig. 3B, SKNSH: T24 shBARD1#A P=0.005 and shBARD1#B P>0.05; T48 shBARD1#A P=0.002 and shBARD1#B P=0.006; T72 shBARD1#A P=0.03 and shBARD1#B P=0.00006; SHSY5Y: T24 shBARD1#A P>0.05 and shBARD1#B P=0.03; T48 shBARD1#A P=0.03 and shBARD1#B P=0.0000002; T72 shBARD1#A P=0.007 and shBARD1#B, P=0.00002). To further investigate the effects of FL BARD1 on neuroblastoma cells oncogenicity we evaluated how FL BARD1 influenced cell growth through colony formation assay and cell invasion. The results revealed that downregulation of FL BARD1 dramatically increased the growth of both SKNSH and SHSY5Y (shBARD1#A and shBARD1#B) cells (Fig. 3C) and invasive ability of both SKNSH and SHSY5Y (shBARD1#A and shBARD1#B) cells (Fig. 3D) compared to control shCTR cells. Importantly, these findings indicate that FL BARD1 functions as tumor-suppressor and the lack of its expression may contribute to neuroblastoma progression by promoting cell proliferation and invasion.
Fig. 3. FL BARD1 has a tumor-suppressor function in neuroblastoma.
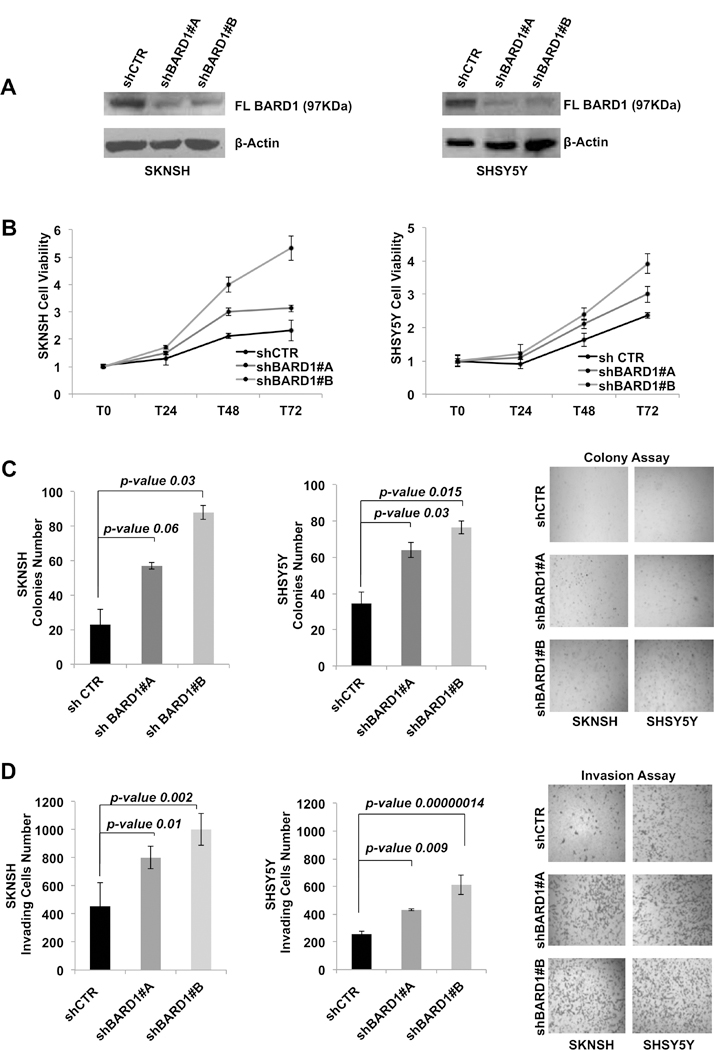
A) The knock-down of BARD1 FL protein expression is shown by western blotting in both cell lines SKNSH and SHSY5Y. B) The decrement of FL BARD1 enhances the cell viability, (C) cells growth in soft agar and (D) the number of invading cells in 2-dimentional invasion assay in both SKNSH and SHSY5Y cells depleted of FL BARD1 (shBARD1#A and shBARD1#B) and control unsilenced cells (shCTR). Microscope magnification is 4x. Experiments were performed in triplicate and repeated two times.
Discussion
BARD1 locus (2q35) has been previously identified as susceptibility locus of high-risk neuroblastoma 6. However, the most of the functional variant(s) at this locus and biological mechanisms accounting for the risk remains unknown. To identify what variants in BARD1 locus may be functionally responsible for the occurrence of disease we have performed a fine mapping analysis of locus 2q35 in 556 high-risk neuroblastoma and 2,575 controls with European-American origins. We developed a specific strategy based on genotype imputation and epigenomic annotations of a large number of neuroblastoma cell lines to identify variants located in regulatory regions of BARD1 which may affect its mRNA expression. We have generated a list of putative functional SNPs, in two independently neuroblastoma-associated loci, that can be further functionally studied. The most significant prioritized SNPs in each locus rs17489363 (not identified in our previous GWAS 6) and rs1048108 showed an opposite odds ratios. The SNP rs17489363 is located in the promoter of FL BARD1 and affects its expression, whereas the SNP rs1048108 might affect non full-length isoforms of BARD1 as is located in exon 1 of FL BARD1 but in the promoter of other 3 isoforms of BARD1. In accord with this latter hypothesis, the aminoacid change (Pro24Ser) generated by rs1048108 is predicted as “Tolerated” by SIFT tool (http://sift.jcvi.org/) and “Probable non pathogenic” by ClinVar database (www.ncbi.nlm.nih.gov/clinvar/). We thus provide evidence that at the same locus 2q35 coexist functional SNPs that independently contribute to determine the risk of neuroblastoma development and may affect different BARD1 isoforms.
In particular, the T risk allele of rs17489363 correlated with low expression of FL BARD1 mRNA in neuroblastoma tumors and the decreased FL BARD1 expression correlated with low-risk patient tumors, suggesting a potential tumor-suppressor role of FL BARD1 in neuroblastoma.
We have also predicted, in silico, and validated, in vitro, that the T-rs17489363 risk allele increased the binding affinity of HFS1 that is a transcriptional factor that seems to mediate carcinogenesis by altering the normal mechanisms of DNA repair 29, 30. FL BARD1 can act as tumor-suppressor by maintaining the normal function of DNA repair mechanisms 18. We thus hypothesize that HSF1 can repress the FL BARD1 tumor-suppressor form and that the T-rs17489363 risk allele plays a relevant role in modulating this mechanism. Further experimental investigations are warranted to validate this hypothesis.
The results of our fine mapping analysis have highlighted a tumor-suppressor role of FL BARD1 in neuroblastoma. FL BARD1 can function as tumor-suppressor in both BRCA1 dependent and BRCA1 independent manner and whereas BRCA1 functions have been extensively studied in cancer 31, FL BARD1 function still remains uncharacterized 18. Here, we demonstrated that alteration of normal FL BARD1 functions is relevant in promoting cell proliferation and invasion in neuroblastoma cells, suggesting mechanistic insights into why the GWAS signal at this locus is associated with clinically aggressive neuroblastoma.
In conclusion, we have demonstrated that at 2q35 locus diverse functional independent variants can confer risk for high-risk neuroblastoma development. FL BARD1 may act as tumor-suppressor gene in neuroblastoma tumorigenesis and its low expression due to a functional variant can predispose to high-risk neuroblastoma development. This study has also demonstrated that our post-GWAS strategy is a useful tool for identifying causal functional variants at previous identified cancer risk loci and for increasing basic knowledge of tumor biology. These biological insights can be translated to clinical benefits, including reliable biomarkers and effective strategies for screening and disease prevention.
Supplementary Material
Novelty & Impact Statements:
These data begin to unravel the underlying biology of genetic predisposition to high-risk neuroblastoma due to common variation at the BARD1 gene locus. Indeed, potentially causative risk variants have been identified and tumor suppressor role for full-length BARD1 has been demonstrated.
Acknowledgments:
We thank Dr Gian Paolo Tonini and Dr Maria Rosaria Esposito for providing us with HEK293T cell lines.
Financial Support: This study was supported by grants from Associazione Italiana per la Ricerca sul Cancro (Grant no. 19255 to M.C.); Ministero della Salute (GR-2011-02348722 to MC), Fondazione Italiana per la Lotta al Neuroblastoma (to M.C.); Associazione Oncologia Pediatrica e Neuroblastoma (to M.C.) and Fondazione Umberto Veronesi (to F.C.); NIH HHS/United States: R01 CA124709/CA/NCI, R01 CA180692 and R35 CA220500 (to J.M.). Spanish Ministry of Health (FIS PI14/00040), Fundació Cellex (CdT).
Footnotes
Conflict of Interest Statement: The authors declare no conflict of interest
References
- 1.Sud A, Kinnersley B, Houlston RS. Genome-wide association studies of cancer: current insights and future perspectives. Nat Rev Cancer 2017;17: 692–704. [DOI] [PubMed] [Google Scholar]
- 2.Sur IK, Hallikas O, Vaharautio A, Yan J, Turunen M, Enge M, Taipale M, Karhu A, Aaltonen LA, Taipale J. Mice lacking a Myc enhancer that includes human SNP rs6983267 are resistant to intestinal tumors. Science 2012;338: 1360–3. [DOI] [PubMed] [Google Scholar]
- 3.Ernst J, Kheradpour P, Mikkelsen TS, Shoresh N, Ward LD, Epstein CB, Zhang X, Wang L, Issner R, Coyne M, Ku M, Durham T, et al. Mapping and analysis of chromatin state dynamics in nine human cell types. Nature 2011;473: 43–9. [DOI] [PMC free article] [PubMed] [Google Scholar]
- 4.Maurano MT, Humbert R, Rynes E, Thurman RE, Haugen E, Wang H, Reynolds AP, Sandstrom R, Qu H, Brody J, Shafer A, Neri F, et al. Systematic localization of common disease-associated variation in regulatory DNA. Science 2012;337: 1190–5. [DOI] [PMC free article] [PubMed] [Google Scholar]
- 5.Maris JM, Mosse YP, Bradfield JP, Hou C, Monni S, Scott RH, Asgharzadeh S, Attiyeh EF, Diskin SJ, Laudenslager M, Winter C, Cole KA, et al. Chromosome 6p22 locus associated with clinically aggressive neuroblastoma. N Engl J Med 2008;358: 2585–93. [DOI] [PMC free article] [PubMed] [Google Scholar]
- 6.Capasso M, Devoto M, Hou C, Asgharzadeh S, Glessner JT, Attiyeh EF, Mosse YP, Kim C, Diskin SJ, Cole KA, Bosse K, Diamond M, et al. Common variations in BARD1 influence susceptibility to high-risk neuroblastoma. Nat Genet 2009;41: 718–23. [DOI] [PMC free article] [PubMed] [Google Scholar]
- 7.Wang K, Diskin SJ, Zhang H, Attiyeh EF, Winter C, Hou C, Schnepp RW, Diamond M, Bosse K, Mayes PA, Glessner J, Kim C, et al. Integrative genomics identifies LMO1 as a neuroblastoma oncogene. Nature 2011;469: 216–20. [DOI] [PMC free article] [PubMed] [Google Scholar]
- 8.Nguyen le B, Diskin SJ, Capasso M, Wang K, Diamond MA, Glessner J, Kim C, Attiyeh EF, Mosse YP, Cole K, Iolascon A, Devoto M, et al. Phenotype restricted genome-wide association study using a gene-centric approach identifies three low-risk neuroblastoma susceptibility Loci. PLoS Genet 2011;7: e1002026. [DOI] [PMC free article] [PubMed] [Google Scholar]
- 9.Diskin SJ, Capasso M, Schnepp RW, Cole KA, Attiyeh EF, Hou C, Diamond M, Carpenter EL, Winter C, Lee H, Jagannathan J, Latorre V, et al. Common variation at 6q16 within HACE1 and LIN28B influences susceptibility to neuroblastoma. Nat Genet 2012;44: 1126–30. [DOI] [PMC free article] [PubMed] [Google Scholar]
- 10.McDaniel LD, Conkrite KL, Chang X, Capasso M, Vaksman Z, Oldridge DA, Zachariou A, Horn M, Diamond M, Hou C, Iolascon A, Hakonarson H, et al. Common variants upstream of MLF1 at 3q25 and within CPZ at 4p16 associated with neuroblastoma. PLoS Genet 2017;13: e1006787. [DOI] [PMC free article] [PubMed] [Google Scholar]
- 11.Capasso M, McDaniel LD, Cimmino F, Cirino A, Formicola D, Russell MR, Raman P, Cole KA, Diskin SJ. The functional variant rs34330 of CDKN1B is associated with risk of neuroblastoma. J Cell Mol Med 2017;21: 3224–30. [DOI] [PMC free article] [PubMed] [Google Scholar]
- 12.Capasso M, Diskin S, Cimmino F, Acierno G, Totaro F, Petrosino G, Pezone L, Diamond M, McDaniel L, Hakonarson H, Iolascon A, Devoto M, et al. Common genetic variants in NEFL influence gene expression and neuroblastoma risk. Cancer Res 2014;74: 6913–24. [DOI] [PMC free article] [PubMed] [Google Scholar]
- 13.Diskin SJ, Capasso M, Diamond M, Oldridge DA, Conkrite K, Bosse KR, Russell MR, Iolascon A, Hakonarson H, Devoto M, Maris JM. Rare variants in TP53 and susceptibility to neuroblastoma. J Natl Cancer Inst 2014;106: dju047. [DOI] [PMC free article] [PubMed] [Google Scholar]
- 14.Maris JM. Recent advances in neuroblastoma. N Engl J Med 2010;362: 2202–11. [DOI] [PMC free article] [PubMed] [Google Scholar]
- 15.Capasso M, Diskin SJ, Totaro F, Longo L, De Mariano M, Russo R, Cimmino F, Hakonarson H, Tonini GP, Devoto M, Maris JM, Iolascon A. Replication of GWAS-identified neuroblastoma risk loci strengthens the role of BARD1 and affirms the cumulative effect of genetic variations on disease susceptibility. Carcinogenesis 2013;34: 605–11. [DOI] [PMC free article] [PubMed] [Google Scholar]
- 16.Fu W, Zhu J, Xiong SW, Jia W, Zhao Z, Zhu SB, Hu JH, Wang FH, Xia H, He J, Liu GC. BARD1 Gene Polymorphisms Confer Nephroblastoma Susceptibility. EBioMedicine 2017;16: 101–5. [DOI] [PMC free article] [PubMed] [Google Scholar]
- 17.He J, Zou Y, Wang T, Zhang R, Yang T, Zhu J, Wang F, Xia H. Genetic Variations of GWAS-Identified Genes and Neuroblastoma Susceptibility: a Replication Study in Southern Chinese Children. Transl Oncol 2017;10: 936–41. [DOI] [PMC free article] [PubMed] [Google Scholar]
- 18.Cimmino F, Formicola D, Capasso M. Dualistic Role of BARD1 in Cancer. Genes 2017;8: 375. [DOI] [PMC free article] [PubMed] [Google Scholar]
- 19.Bosse KR, Diskin SJ, Cole KA, Wood AC, Schnepp RW, Norris G, Nguyen le B, Jagannathan J, Laquaglia M, Winter C, Diamond M, Hou C, et al. Common variation at BARD1 results in the expression of an oncogenic isoform that influences neuroblastoma susceptibility and oncogenicity. Cancer Res 2012;72: 2068–78. [DOI] [PMC free article] [PubMed] [Google Scholar]
- 20.Delaneau O, Marchini J, Zagury JF. A linear complexity phasing method for thousands of genomes. Nat Methods 2011;9: 179–81. [DOI] [PubMed] [Google Scholar]
- 21.Howie B, Fuchsberger C, Stephens M, Marchini J, Abecasis GR. Fast and accurate genotype imputation in genome-wide association studies through pre-phasing. Nat Genet 2012;44: 955–9. [DOI] [PMC free article] [PubMed] [Google Scholar]
- 22.Cimmino F, Pezone L, Avitabile M, Acierno G, Andolfo I, Capasso M, Iolascon A. Inhibition of hypoxia inducible factors combined with all-trans retinoic acid treatment enhances glial transdifferentiation of neuroblastoma cells. Sci Rep 2015;5: 11158. [DOI] [PMC free article] [PubMed] [Google Scholar]
- 23.Willer CJ, Li Y, Abecasis GR. METAL: fast and efficient meta-analysis of genomewide association scans. Bioinformatics 2010;26: 2190–1. [DOI] [PMC free article] [PubMed] [Google Scholar]
- 24.Yang J, Lee SH, Goddard ME, Visscher PM. GCTA: a tool for genome-wide complex trait analysis. Am J Hum Genet 2011;88: 76–82. [DOI] [PMC free article] [PubMed] [Google Scholar]
- 25.Capasso M, Avvisati RA, Piscopo C, Laforgia N, Raimondi F, de Angelis F, Iolascon A. Cytokine gene polymorphisms in Italian preterm infants: association between interleukin-10 −1082 G/A polymorphism and respiratory distress syndrome. Pediatr Res 2007;61: 313–7. [DOI] [PubMed] [Google Scholar]
- 26.Atlasi Y, Stunnenberg HG. The interplay of epigenetic marks during stem cell differentiation and development. Nat Rev Genet 2017;18: 643–58. [DOI] [PubMed] [Google Scholar]
- 27.Boyle AP, Hong EL, Hariharan M, Cheng Y, Schaub MA, Kasowski M, Karczewski KJ, Park J, Hitz BC, Weng S, Cherry JM, Snyder M. Annotation of functional variation in personal genomes using RegulomeDB. Genome Res 2012;22: 1790–7. [DOI] [PMC free article] [PubMed] [Google Scholar]
- 28.Thomas-Chollier M, Hufton A, Heinig M, O’Keeffe S, Masri NE, Roider HG, Manke T, Vingron M. Transcription factor binding predictions using TRAP for the analysis of ChIP-seq data and regulatory SNPs. Nat Protoc 2011;6: 1860–9. [DOI] [PubMed] [Google Scholar]
- 29.Huang J, Nueda A, Yoo S, Dynan WS. Heat shock transcription factor 1 binds selectively in vitro to Ku protein and the catalytic subunit of the DNA-dependent protein kinase. J Biol Chem 1997;272: 26009–16. [DOI] [PubMed] [Google Scholar]
- 30.Li Q, Martinez JD. Loss of HSF1 results in defective radiation-induced G(2) arrest and DNA repair. Radiat Res 2011;176: 17–24. [DOI] [PMC free article] [PubMed] [Google Scholar]
- 31.Irminger-Finger I, Siegel BD, Leung WC. The functions of breast cancer susceptibility gene 1 (BRCA1) product and its associated proteins. Biol Chem 1999;380: 117–28. [DOI] [PubMed] [Google Scholar]
Associated Data
This section collects any data citations, data availability statements, or supplementary materials included in this article.