

SUMMARY
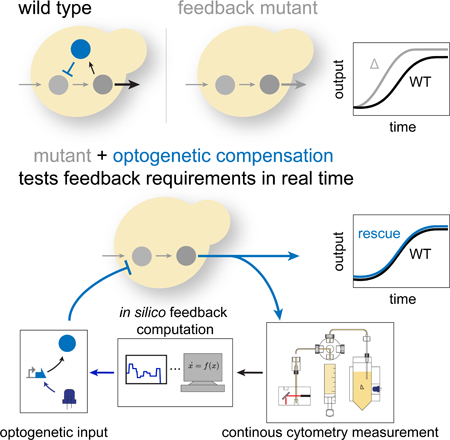
Biological signaling networks use feedback control to dynamically adjust their operation in real time. Traditional static genetic methods such as gene knockouts or rescue experiments often can identify the existence of feedback interactions, yet are unable to determine what feedback dynamics are required. Here, we implement a new strategy, closed loop optogenetic compensation (CLOC), to address this problem. Using a custom-built hardware and software infrastructure, CLOC monitors in real time the output of a pathway deleted for a feedback regulator. A minimal model uses these measurements to calculate and deliver— on the fly—an optogenetically-enabled transcriptional input designed to compensate for the effects of the feedback deletion. Application of CLOC to the yeast pheromone response pathway revealed surprisingly distinct dynamic requirements for three well-studied feedback regulators. CLOC, a marriage of control theory and traditional genetics, presents a broadly applicable methodology for defining the dynamic function of biological feedback regulators.
eTOC Summary:
An optogenetic-based method is developed to explore the temporal requirements for a gene product to produce a dynamic phenotype.
Graphical Abstract
INTRODUCTION
The classical genetic complementation experiment tests whether phenotypes produced by a mutation can be rescued by the wild-type allele (Collins et al., 2006). This experiment, however, does not reveal whether the time-dependent regulation of the corresponding gene or gene product is important for maintaining the wild-type phenotype. Such knowledge is particularly germane to feedback regulation in signaling and transcriptional networks where the dynamic interplay between pathway activity and feedback activation enables cells to monitor and adjust the activity of upstream components in real time. Feedback regulation is a widespread cellular strategy that underlies diverse cellular behaviors including perfect adaptation (Leibler et al., 1999), multi-stability (Xiong and Ferrell, 2003) and oscillations (Tsai et al., 2008). In these contexts, feedback plays a dominant qualitative role that can be assessed by inference since its loss usually induces visible disruption of a phenotype—for example loss of oscillations (Lahav et al., 2004) or perfect adaptation (Muzzey et al., 2009). However, the majority of feedback loops seem to play quantitative roles, fine tuning the operation of cellular pathways to demands and fluctuations in the environment (Nevozhay et al., 2009). Such regulation is challenging to understand quantitatively because the input-output relationship of many interconnected signaling components must be measured and modeled mathematically (Garmendia-Torres, Goldbeter and Jacquet, 2007; Howell et al., 2012; Werner et al., 2008). Mathematical predictions need then to be iteratively tested in painstaking fashion (Harreman et al., 2004; Cirit, Wang and Haugh, 2010; Dixit et al., 2014).
We describe here a general method to study cellular feedback regulation that employs and updates the conceptual framework of genetic compensation experiments (Figure 1A). In this approach, we define a quantitative, dynamic phenotype associated with the loss of a pathway-controlled regulator: the time-dependent difference between the output of the wild type and mutant pathways. We use this information and a minimal mathematical model to compute continuously, for every time point at which the output is measured, how much of the missing regulator needs to be added back into the cell in order to rescue this phenotype and restore wild-type output dynamics. We then inject the computed level of the regulator into the mutant cell using an optogenetic construct that controls its transcription. In this closed loop optogenetic compensation (CLOC) approach, both fully and partially compensatory inputs produce focused hypotheses about the temporal demands on the feedback regulator. Below we describe how we have applied CLOC to three well-studied negative regulators of the yeast pheromone response MAPK pathway, the dual-specificity MAPK phosphatase Msg5, the DEP-RGS protein Sst2, and the Gα protein Gpa1. Our studies reveal distinct dynamic requirements for each of these pheromone-induced regulatory factors and reveals the power of elucidating the time scales of gene function, which cannot be fully interrogated by compensation with static genetic alleles.
Figure 1 |. Mutants of SST2, MSG5, and GPA1, three pheromone-induced negative regulators of the yeast mating pathway have different signaling dynamics phenotypes.
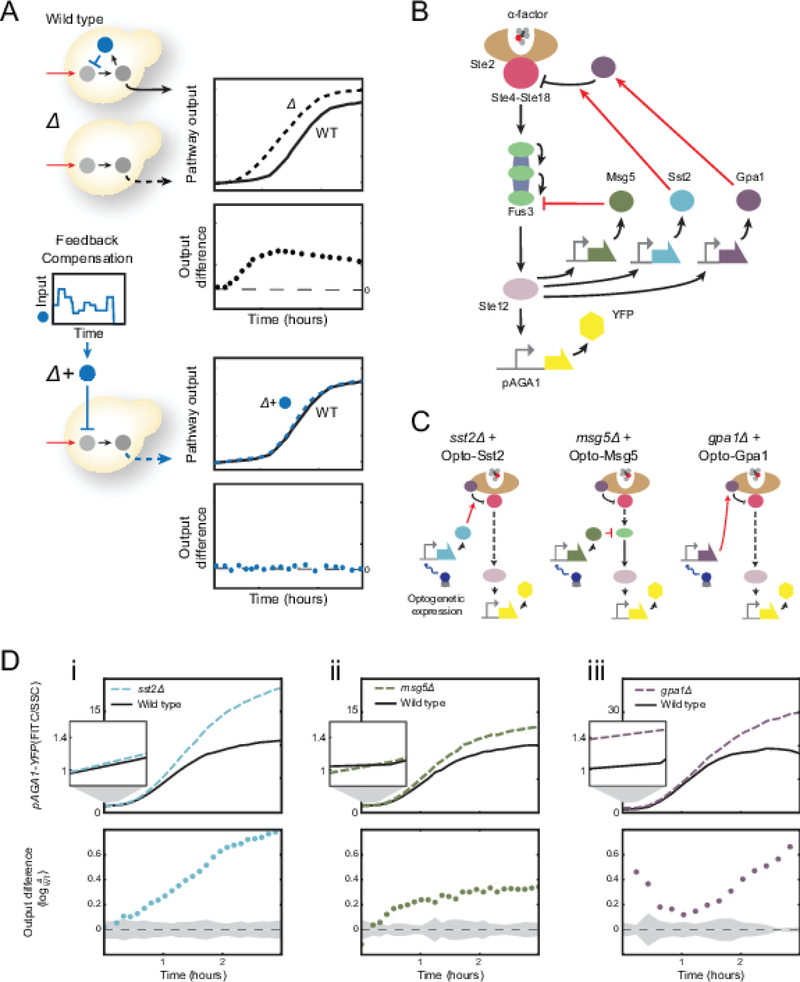
(A) Illustration of the concept of time dependent genetic compensation. Deletion of a feedback regulator causes a difference in the pathway output of the mutant as compared to the wildtype. This difference is time-varying. As a result, rescue of this quantitative dynamic phenotype requires the time-varying exogenous expression of the missing gene. (B) Schematic of the wild type pheromone response pathway. (C) The different mutants for pheromone responsive regulators (Sst2, Msg5 and Gpa1). Rescue of these mutations will be carried out using an optogenetic construct. (D) The α-factor response for sst2∆ (i), msg5∆ (ii), and gpa1∆ (iii) strains compared to the wild type response. Top panels: Fold change pAGA1-YFP expression as a function of time for the wild type and feedback deficient strain after pathway induction with 0.5nM α-factor. Bottom Panels: Difference of pAGA1-YFP expression between the wild type and feedback deficient strains. Zero indicates no difference. Shaded region represents the standard deviation when comparing three biological repeats of wild type signaling. This region will help us define successful compensation to wild type given experimental error and biological variability.
RESULTS
In silico feedback control of yeast mating pathway dynamics by automated optogenetic expression of negative regulators
The yeast mating pheromone response pathway is a model signal transduction network (Bardwell, 2005) where extensive work mapping pathway components and interactions has identified numerous feedback regulators (Kaffman, Rank and O’Shea, 1998; Ren et al., 2000; Gruhler et al., 2005). In this pathway, the binding of mating pheromone to the G-protein-coupled receptor Ste2 (a cells) or Ste3 (α cells), is transduced by a MAP kinase cascade into the activation of the transcription factor Ste12. Ste12 drives the expression of genes required for mating as well as genes encoding for pathway components that regulate upstream signaling. We investigated three such negative regulators whose transcription is stimulated by pheromone: Sst2 (Dietzel and Kurjan, 1987), Msg5 (Doi et al., 1994), and Gpa1 (Nakayama et al., 1988) (Figure 1B). Gpa1 is α subunit of the receptor-controlled G protein that inhibits the Gβγ complex (Ste4-Ste18), which, once freed from inhibition, is the key activator of the MAPK cascade. Msg5 is the dual specificity phosphatase that dephosphorylates and inactivates the MAPK Fus3. Sst2 is the DEP-RGS protein that enhances GTP hydrolysis by Gpa1, terminating signaling and promoting receptor down-regulation. While these three negative regulators are well-studied, how their temporal regulation by the MAPK pathway shapes signaling dynamics is not well-understood.
To study the dynamic requirements of these pheromone controlled pathway regulators, we constructed feedback deficient mutants (sst2∆, msg5∆, gpa1∆) in which the endogenous Ste12 inducible copy of each gene is knocked out and replaced with a corresponding optogenetically inducible copy (Figure 1C). This effectively replaces the native Ste12-activated expression of the feedback regulators with expression that can be experimentally activated with light. Light-based inputs, which can be easily varied in time and magnitude, are particularly well suited for fine, dynamic control of gene expression. We used a modified version of a previously reported cryptochrome based optogenetic expression system(Kennedy et al., 2010) in which the cytochrome protein Cry2phr is fused to the Gal4 DNA binding domain and its interacting partner Cib1 is fused to the activation domain of Rtg3 (Rothermel, Thornton and Butow, 1997). Upon stimulation by blue light, Cry2phr-Gal4DBD undergoes a conformational change that enables it to bind Cib1-Rtg3AD and drive expression from the pGAL1 promoter of either Sst2 (Opto-Sste2), Msg5 (Opto-Msg5), or Gpa1 (Opto-Gpa1). The Cry2phr-Gal4DBD optogenetic construct was effective at expressing these proteins, and we observed robust and dose dependent repression of pathway output upon exposure to blue light, as measured by a pheromone-responsive pAGA1-YFP reporter (McCullagh et al., 2010) (Figure S1-S3)
To assess the impact of removing Sst2, Msg5 or Gpa1 on mating pathway-signaling dynamics, we used α-factor to induce each feedback deficient mutant in the dark (with no induction of Opto-Msg5, Opto-Sst2, or Opto-Gpa1) and compared its pathway output to that of the wild type (Figure 1D). In sst2∆ cells, the difference in pathway output relative to wild-type increases steadily over time while in msg5∆ cells this difference remains roughly constant for the duration of the experiment after an initial rise. Unlike the other mutants, gpa1∆ cells display a quantitative and reproducible increase in basal signaling prior to pheromone addition. This initial difference in pathway activity decreases during early induction and then increases as gpa1∆ reaches a higher maximum pathway activity than wild type.
One strategy for restoring wild type pathway dynamics in the feedback deficient mutants would be to iteratively test predetermined optogenetic inputs until one that restores wild type output is found. This strategy, referred to in engineering as open-loop control, requires a predictive understanding of how pathway output changes as a function of optogenetic input and can therefore be unreliable if this function is affected by day to day variation in pathway behavior (Milias-Argeitis et al., 2011, 2016; Del Vecchio et al., 2017; Rullan et al., 2017). The alternative ‘closed-loop’ approach would leverage the same strategy that endogenous cellular feedback loops use to produce robust signaling dynamics, namely to monitor the pathway output in real time and correspondingly adjust the activity of the feedback regulators (Figure 2). In our case, this entails real-time, in silico adjustment of the optogenetic input to change in vivo regulator expression and in this fashion, staple the output of the mutant to that of the wild type. Similar closed loop control schemes have recently been used to control intracellular processes in live cells (Milias-Argeitis et al., 2011; Toettcher et al., 2011; Uhlendorf et al., 2012; Lugagne et al., 2017). Historically, they form the basis of patch clamp studies in neurobiology (Hodgkin and Huxley, 1952) where a controller-supplied current that is updated in real-time to compensate for neuron voltage changes serves as a proxy for measuring endogenous neuron currents.
Figure 2 |. Synthetic optogenetic compensation control (CLOC).
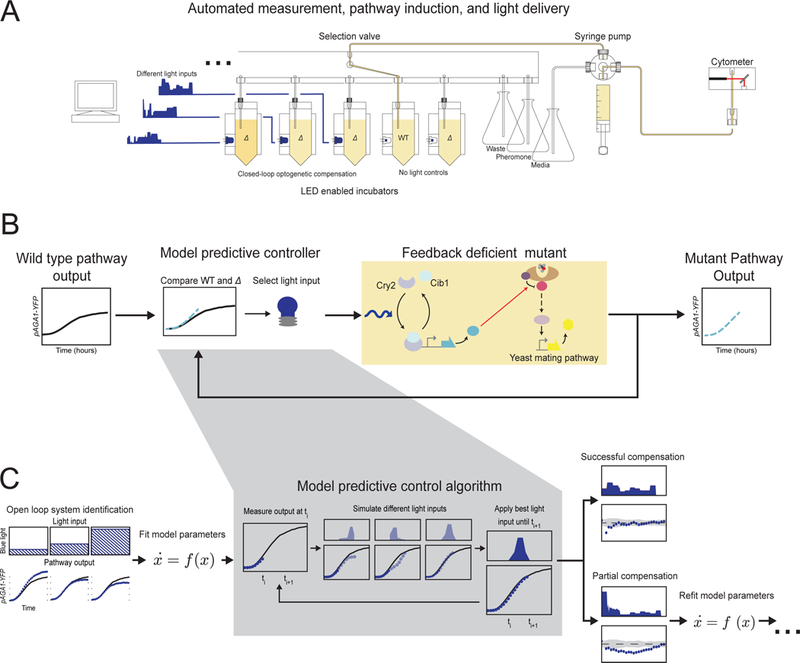
(A) Schematic showing the LED-enabled yeast incubation array and liquid handling device used for real time cytometry measurement and light delivery. (B) Block diagram showing the design of the closed control strategy used to implement CLOC. An in silico computational controller continuously compares desired pathway output to mutant pathway output and determines the appropriate optogenetic expression of a pathway regulator to carry out the genetic compensation of the mutant output. (C) Schematic of model identification and model predictive control used in in silico computations. The output of the mutant pathway in response to constant light input is used to parameterize an initial model. In an initial set of CLOC experiments, model predictive control uses this model to determine appropriate light inputs in order to carry out the dynamic compensation. If compensation is not satisfactory, model identification is repeated with all generated data, including suboptimal CLOC trials. Eventually, CLOC trials converge on a satisfactory dynamic compensation strategy. (See Table S4)
To accomplish closed-loop control, we designed and fabricated an automated yeast culturing, light delivery, and cytometric measurement device (Figure 2A). The device consists of eight temperature-controlled and aerated yeast incubators with individually addressable and integrated blue light-emitting diodes (LED) for light delivery. A selection valve and syringe pump is used to automate the addition of fresh media and α-factor to the cultures as well as the injection of culture into a flow cytometer to measure pathway activity. The device is controlled via customized code that allows the user to set experimental parameters including measurement frequency and the timing of α-factor introduction (Supplemental Information).
The device uses a particular closed loop control strategy, model predictive control (MPC) (Borrelli, Bemporad and Morari, 2017), to determine the appropriate optogenetic input for CLOC from real-time output measurements of the mating pathway (Figure 2B). Although MPC requires the construction of a rudimentary model of the system, it has the advantage over system-agnostic control schemes such as the classical proportional-integral-derivative method in that it is better suited for systems with significant delays such as those inherent to transcription and translation (Fiore et al., 2016). MPC is better able to circumvent these delays since by design it considers what input is needed now to adequately guide the system in the future. We chose a two-state ordinary differential equation (ODE) model that yielded a simplified description of how pAGA1-YFP expression responds to both mating pheromone (α-factor) and light in the feedback deficient mutants (Supplemental Information). The two variables described in the model represent the dynamics of light induced expression of the feedback regulator and the measured fluorescent output in response to this regulator. This model is a parsimonious and generic description, and we chose it with the explicit intent of developing a generalized approach without the need for detailed mechanistic models. During a typical CLOC experiment, we induce signaling using α-factor and measure the pAGA1-YFP output via flow cytometry. The MPC controller uses this measurement to estimate the states of the ODE model and then selects a light input that the model predicts minimizes the future difference between the activity of the mutant pathway and the desired wild type pathway (Figure 2C). This light input is then applied to the mutants for 15 minutes, at which point the operation is repeated. The states of the model are re-estimated based on the current measurements of pAGA1-YFP and a new light input is selected and administered.
Using our automated closed-loop control device, we performed time-dependent genetic compensation of sst2∆, msg5∆, and gpa1∆ strains with Opto-Sst2, Opto-Msg5, and Opto-Gpa1 respectively. In each case, we initially tested constant-light induction of the negative regulator in open loop—that is without changing light input as a function of pAGA1-YFP measurements—for a range of light intensities. The open loop response of the mutants was then used for the initial parameterization of the controller ODE model (Figures S1-S3). In cases where this parameterization was insufficient for obtaining satisfactory CLOC, we adopted a procedure in which we iteratively refit the model parameters using data from CLOC experiments that only achieved partial compensation (Figures S2-S3). This is akin to closed-loop system identification (Ljung, 1999), a procedure used to ensure that a low resolution empirical model still captures the properties of a system (such as important time-scales) required for efficient closed loop control. Examination of iterative trials, that achieved either satisfactory or partial compensation revealed striking differences for the dynamic requirements for each of the three regulators.
Constant Opto-Sst2 induction rescues wild-type dynamics
We first attempted to rescue wild-type signaling dynamics in an sst2∆ mutant using constant open loop induction of Opto-Sst2. Given the often-assumed canonical role of SST2 as a feedback regulator (Chasse et al., 2006), we were surprised to find that constant induction of Opto-Sst2 at an appropriate light intensity was sufficient to rescue wild type signaling dynamics in sst2∆ (Figure 3B). Constant induction above or below this level achieved partial compensation, initially driving signaling to wild type levels before eventually resulting in pathway over attenuation or over activation compared to wild type (Figure 3C trials 1–5). These data strongly indicate that constant pheromone-induced expression of SST2 suffices to program the wild-type response to mating pheromone and that this response does not require a dynamic transcriptional feedback mechanism. This is further corroborated by the light inputs used in CLOC, which resemble fluctuations about a constant light intensity (Figure 3C trial 6). Constant induction of Opto-Sst2 was similarly sufficient in rescuing wild type dynamics for experiments performed at a higher concentration of α-factor (Figure S4A).
Figure 3 |. CLOC experiments indicate that there are no dynamic requirements for compensation of SST2.
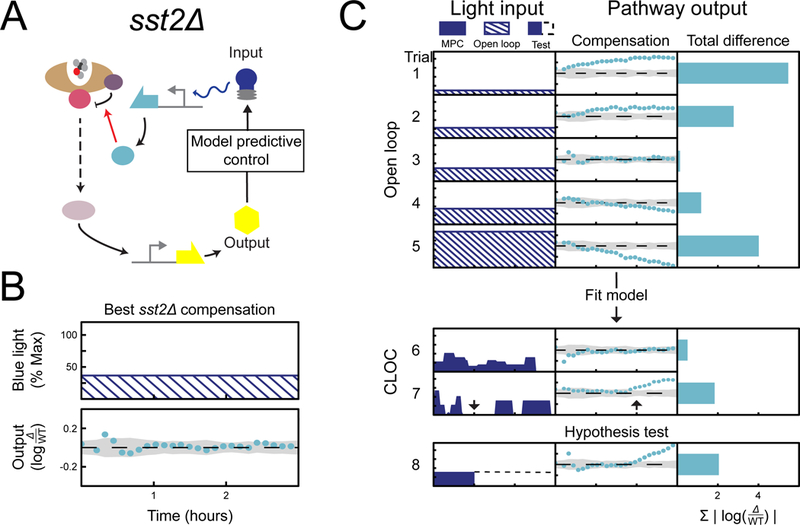
(A) Simplified schematic of a CLOC experiment where compensation of the mutant is carried out through optogenetic expression of Sst2. (B) The optogenetic input resulting in the best compensation along with its compensation error is shown on the left. This plot also shows the numerical values of the axes. The same scale and values are used in panel C. (C) For all trials, mutant strains are induced with 0.5 nM α-factor at time 0 hours and pAGA1-YFP is then measured for 3 hours. Compensation of mutants is carried out through optogenetic expression of Sst2. Results of different trials are shown as rows in tables with three columns. The first column shows the light input as a function of time, the second column shows the resulting difference in signaling output between compensated mutant and wild type as a function of time, and the third column shows the sum of the differences shown in the second column. Light inputs were given in either open loop (input is dashed), closed loop (input is solid color). For hypothesis testing, input prescribed by CLOC was implemented (input in blue solid color) until some point in time when the control was purposefully shut off (would-be input in dashed black line). (See Figure S1, Figure S4, and Table S3)
Further examination of the MPC inputs revealed an interesting trend: even when induction of opto-Sst2 is switched off for a period of time during CLOC, we didn’t observe a corresponding over activation of signaling in sst2∆ cells until approximately one hour later. (Figure 3C trial 7). To directly test this observed delay, we carried out an experiment in which we expressed Opto-Sst2 at the optimal level for 1 hour and then turned off its induction. We observed that there is indeed a one hour delay before sst2∆ output deviates from wild-type levels (Figure 3C trial 8). This slow pathway reaction to shutoff of Opto-Sst2, which could be related to the half-life of Sst2, the responsiveness of the pathway, or both, is consistent with the apparent lack of a temporal requirement for the regulation Sst2.
Dynamic requirement for Opto-Msg5 to rescue wild-type signaling
In contrast to our findings on SST2, we could not find any level of constant Opto-Msg5 expression that rescues wild type signaling dynamics in msg5∆ (Figure S2A). Instead, we observed a tradeoff in which a constant induction of Opto-Msg5 that was strong enough to drive early signaling of msg5∆ cells to wild type levels also resulted in over-attenuation of the output at later times (Figure 4C trial 2). Dialing down the constant light intensity could reduce this over-attenuation but at the cost of initial over-activation (Figure 4C trial 1). The tradeoff between the need for sufficient initial attenuation and its incurred subsequent over-attenuation suggested that a dynamic opto-Msg5 input was needed to circumvent this limitation of constant induction.
Figure 4 |. CLOC experiments indicate that dynamic compensation of MSG5 is necessary to rescue msg5Δ mutant output to wild type pathway output.
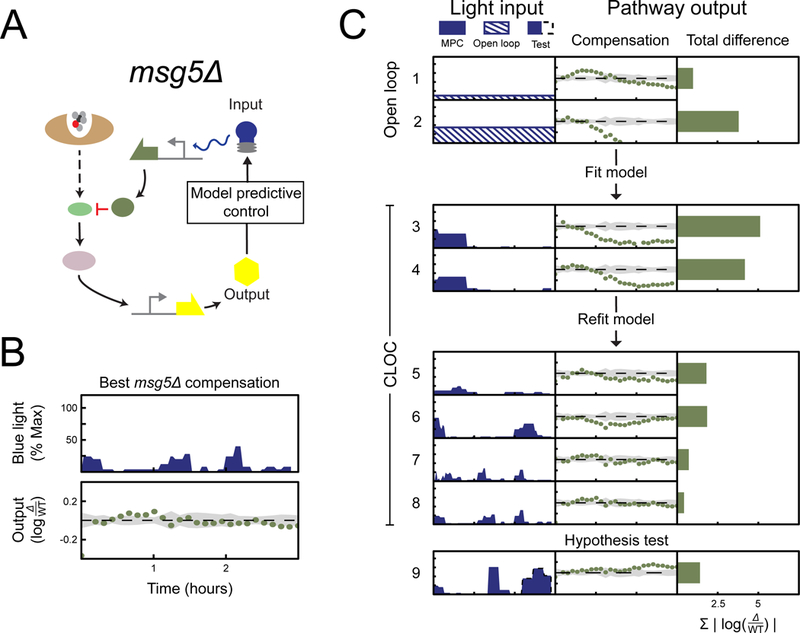
(A) Compensation of the mutant is carried out through optogenetic expression of Msg5. (B) The optogenetic input resulting in the best compensation along with its compensation error is shown on the left. This plot also shows the numerical values of the axes. The same scale and values are used for panel C. (C) For all trials, mutant strains are induced with 0.5 nM α-factor at time 0 hours and pAGA1-YFP is then measured for 3 hours. Compensation of mutants is carried out through optogenetic expression of the deleted regulator Sst2. Results of different trials are shown as rows in tables with three columns. The first column shows the light input as a function of time, the second column shows the resulting difference in signaling output between compensated mutant and wild type as a function of time, and the third column shows the sum of the differences shown in the second column. Light inputs were given in either open loop (input is dashed), closed loop (input is solid color). For hypothesis testing, input prescribed by CLOC was implemented (input in blue solid color) until some point in time when the control was purposefully shut off (would-be input in dashed black line). (See Figure S2, Figure S4, and Table S3)
We next carried out CLOC experiments using a model parameterized from the collected open loop data. In these first experiments, the MPC attempted to prevent the problem of over attenuation by stopping induction of Opto-Msg5 after signaling in msg5∆ cells had been restored to wild type levels (Figure 4C trials 3–4). However, this still resulted in poor compensation, as pathway signaling was slow to recover from its initial attenuation even in the absence of opto-Msg5 induction. This is likely due to the excess Opto-Msg5 molecules produced during the overzealous initial pulse that persist in the cell and continue to repress pathway output for an extended period of time. This suggested that initial expression of Msg5 is crucial for wild type signaling dynamics and that mistakes of over-production cannot be promptly corrected. Furthermore, it was evident that the model parameters used in CLOC were not sufficiently tuned to account for the important timescales of the signaling process.
Therefore we refitted the model parameters using these initial CLOC trials. With the refitted model, CLOC converged on a strategy of pulsing of Opto-Msg5 expression (Figure 4C trials 7–8). This strategy alleviated the shortcomings of previous trials by adjusting the first Opto-Msg5 pulse duration and timing to drive initial pathway output to the level of wild type without excess production of Opto-Msg5. Subsequent Opto-Msg5 pulses were then administered, as the impact of the previous pulse of Opto-Msg5 is lost. This interpretation is supported by non-optimal CLOC trials in which the initial pulse of Opto-Msg5 induction was too long (Figure 4C trial 5) or strong (Figure 4C trial 6) and drove pathway output below wild type. In both cases, the second Opto-Msg5 was not administered. We again observed similar results for CLOC experiments conducted at a higher concentration of α-factor (Figure S3B). Furthermore, experiments performed using a more complex model did not significantly improve pathway control and generated qualitatively similar light inputs (Figure S2G-J). Taken together, these experiments indicate that dynamic pulses of MSG5-mediated feedback enable fine control of pathway dynamics while avoiding over attenuation.
To further test this hypothesis and ensure that the model was not generating needlessly complicated light inputs, we conducted CLOC experiments in which the LEDs were purposefully turned off before the MPC could administer the third pulse seen in successful CLOC trials. (Figure 4C trial 9). Without a third pulse, we consistently observed that pathway activity rose above the wild type level at the end of the experiment.
Interestingly, while different successful CLOC experiments always generated a pattern of dynamic pulsing, the magnitude and timing of these pulses varied quantitatively between experiments, likely as a response to biological variability in the pathway (Milias-Argeitis et al., 2016). Our control scheme potentially accounts for this variability and adjust quantitatively to it in real-time. To further test this idea, we conducted an experiment in which the CLOC light input generated using the real-time measurement of one sample of msg5∆ (Figure S2L) was simultaneously applied in open loop to biological replicates of this culture (Figure S2M). This ‘quasi-open loop’ input did not reliably rescue wild type signaling, as the magnitude and timing of the light pulses were often inappropriate given the particular quantitative circumstances of the biological replicates (Figure S2M Trials 2–4).
Taken together, these data support a hypothesis in which a dynamic endogenous MSG5 feedback loop generates on-demand pulses of Msg5 whose timing and magnitude are fined-tuned by cellular circumstances. These pulses of Msg5 expression in feedback seem to be crucial to maintain wild type signaling demands in the pathway following α-factor stimulation. Notably, a previous report has found pulses of Fus3 activity in cells exposed to mating pheromone for prolonged periods (Hilioti et al., 2008), which may be related to the pulsatile requirement for Msg5 transcription identified here.
Dynamic requirement for Opto-Gpa1 to rescue pheromone-independent basal signaling
Unlike sst2∆ or msg5∆ strains, the gpa1∆ strain displays increased basal signaling compared to wild type (Figure 1D). We first attempted to rescue wild type signaling in gpa1∆ cells without correcting for this basal signaling difference. However, all open loop induction schemes of Opto-Gpa1 starting concurrently with pheromone induction failed in a prototypical way. Low constant expression of Opto-Gpa1 drove output down from its high basal state, eventually reaching the wild type level but only around two hours after induction (Figure 5C trial 1). Higher Opto-Gpa1 expression shortened this time, but at the cost of over attenuation of signaling due to over-production of Gpa1 (Figure 5C trial 2). These data suggested that basal expression of Gpa1 in cells prior to stimulation is required for proper signaling dynamics after α-factor exposure.
Figure 5 |. CLOC experiments indicate that the basal error for gpa1∆ needs to be corrected in order to restore post α-factor signaling dynamics.
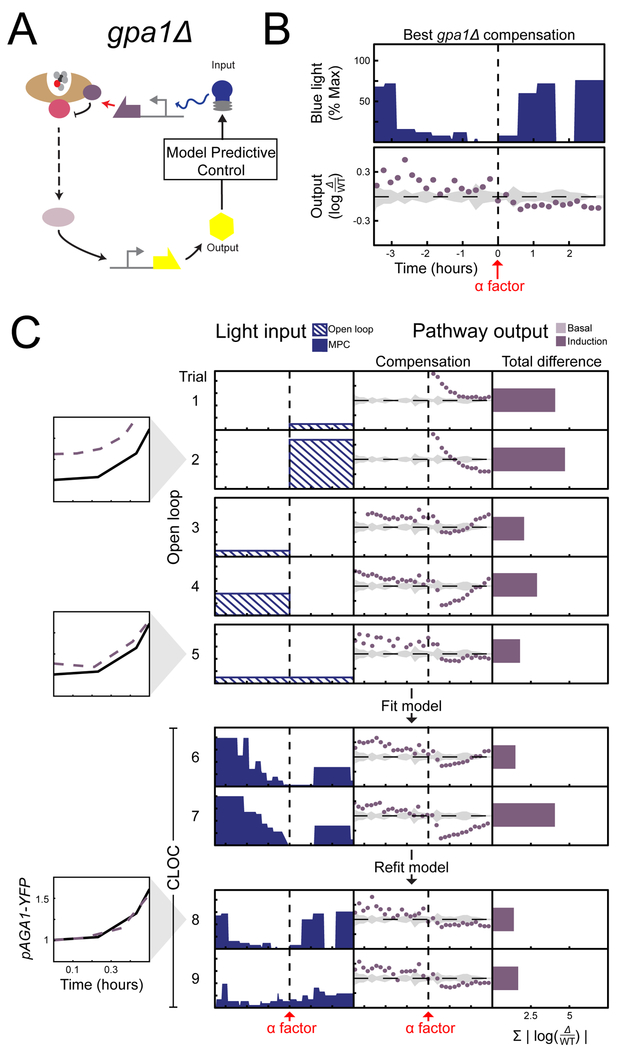
For all trials, mutant strains are induced with 0.5nM α-factor at time 0 hours and pAGA1-YFP measured for time −3.5 to 0 hours (basal) and 0 to 3 hours (induction). (A) Compensation of the mutant is carried out through optogenetic expression of GPA1. (B) Optogenetic input resulting in the best compensation, along with its compensation error. (C) Results of different trials are shown as rows in tables with three columns. The first column shows the light input as a function of time, the second column shows the resulting difference in signaling output as compared to wild type as a function of time, and the third column shows the sum of the differences shown in the second column. Basal difference (light purple) is the difference at the time of α-factor induction while the induction difference is the sum of all difference after α-factor induction (dark purple). Light inputs were given in either open loop (input is dashed), closed loop (input is solid color). Insets compare pAGA1-YFP output of the wild type (solid line) and gpa1∆ (dashed line) strains for the accompanying trial immediately after α-factor addition (See Figure S3, Figure S4, and Table S3). The plots have the same scale and axes values as in (B).
Next, we asked whether constant open-loop expression of Opto-Gpa1 that precedes pheromone exposure could rescue the post-induction signaling dynamics of gpa1∆ cells. We therefore induced Opto-Gpa1 for 3.5 hours before pathway activation by α-factor. After addition of α-factor, constant Opto-Gpa1 induction was either stopped (Figure 5C trials 3–4) or continued (Figure 5C trial 5). Light intensities strong enough to drive basal signaling in gpa1∆ cells to wild type levels resulted in over attenuation after pheromone addition, even in the absence of continued expression of Opto-Gpa1. While weaker constant induction of Opto-Gpa1 before α-factor addition avoided this over attenuation, it did not fully restore basal signaling in gpa1∆ cells (Figure 5C trial 5 inset) and if not continued after pheromone exposure, also resulted in pathway over-activation at around 30 minutes after induction (Figure 5C trial 5).
We therefore hypothesized that dynamic compensation of gpa1∆ is necessary to fully rescue wild type basal signaling and immediate dynamics after pheromone exposure without causing over attenuation. To perform CLOC of both basal signaling activity and induction dynamics, we parameterized a model using all the data generated by the constant light responses of the gpa1∆ strain (Figure S4A). CLOC experiments using this initial model were able to satisfactorily rescue wild type basal signaling, generally through strong initial induction of Opto-Gpa1 that is subsequently ramped down prior to pheromone addition (Figure 5C trials 6–7). However, this induction strategy did not avoid the issue of over attenuation following α-factor addition seen in the constant Opto-Gpa1 experiments.
Using these data, we then performed a second round of model fitting for additional CLOC experiments. These experiments resulted in more tapered Opto-Gpa1 expression strategies that rescued basal signaling gpa1∆ (Figure 5C trials 8 inset) without causing severe over attenuation immediately post α-factor induction. The same light induction strategy generated similar results for gpa1∆ CLOC experiments conducted at a higher concentration of α-factor (Figure S4C). These data indicate that a carefully calibrated basal expression of Gpa1 is needed at the time of pheromone addition in order to start approaching post-induction wild-type dynamics (Figure 5C, compare trials 6 and 7 with trial 8).
Notably, we observed that many quantitatively different Opto-Gpa1 induction patterns could rescue wild type pAGA1-YFP levels without extensive over-expression of Gpa1 at the time of pheromone induction. These strategies resulted in similar rescue of post-pheromone dynamics and showed only a weak dependence on post-pheromone Opto-Gpa1 expression (Figure 5C compare trials 8 and 9, also compare trials 1 and 2 to trials 8 and 9). Taken together, these data strongly suggests that negative feedback via transcription of GPA1 plays a critical role in setting the level of Gpa1 during basal signaling, and that this initial level is critical for producing the wild-type dynamics after pheromone induction.
DISCUSSION
Feedback loops have mostly been studied in contexts where they generate dramatic qualitative behavior, such as the positive feedbacks that produce the sharp switching (Xiong and Ferrell, 2003) used for cellular differentiation or the negative feedbacks that produce oscillations (Pomerening, Kim and Ferrell, 2005) used in setting biological rhythms. It is widely accepted, however, that hundreds if not thousands of feedback loops decorate a cell and that the large majority of these do not create cellular phenotypes but instead contribute quantitatively to them. Understanding these feedbacks requires knowing both their dynamics, when and how strongly they are active, and more importantly what happens when these dynamics are disrupted. Despite previous elegant attempts (Santos, Verveer and Bastiaens, 2007; Yu et al., 2008), systematic tools are scarce to efficiently generate hypotheses pertaining to these questions. The approach presented here takes a first step in this direction by combining two powerful ideas, genetic compensation and control theory. Adding a dynamic dimension to classical genetics by defining phenotype as time-dependent signaling, we ask control theory to determine how much and how often introduction of a deleted feedback component can rescue wild-type signaling dynamics in a mutant strain. We then use this time trace of the introduced compensatory feedback and its success or failure in rescuing wild type signaling to generate hypotheses about the dynamism, timescale of action, sensitivity, and other hallmarks of the endogenous feedback loop.
In the context of the yeast mating pheromone response pathway, we suggest that the dynamic optogenetic input required for time-dependent genetic compensation of its feedback regulators serves as a proxy for endogenous Ste12 driven feedback expression, allowing for quantitative characterization of the feedback regulators’ temporal expression requirements in the context of native pathway signaling. With this as a guiding principle, we determined that the extensively studied feedback loop involving SST2, whose dynamic induction in response to pheromone has largely been assumed to be essential for signaling (Dixit et al., 2014), appears to have no temporal requirement for generating wild type induction dynamics in response to a step input of α-factor. Instead static expression of Sst2 is sufficient to generate wild type signaling dynamics. By contrast, our studies suggest that the feedback loop involving the phosphatase MSG5 is exquisitely dynamic, pulsing repeatedly to fine-tune pathway dynamics. Our data also suggest that GPA1 is involved in dynamic feedback, but one that is important mostly during basal signaling.
Such hypotheses generated by CLOC can be used to prioritize further mechanistic investigations of these regulators. In the case of MSG5, CLOC suggests that future exploration of transcriptional bursting will likely be productive. For SST2, the observed lack of a dynamic expression demand might redirect future investigation of this feedback away from mean pathway output and towards other functional phenotypes. The hypothesized role of GPA1 in the regulation of basal activity suggests that future investigation should be aimed at whether its promoter is uniquely sensitive to low Ste12 activity.
Importantly, these operational definitions and hypotheses of the three feedback loops could not be achieved by direct measurement of pheromone induced GPA1, SST2, and MSG5 transcription dynamics alone. Typically, measuring an increase or decrease of a gene product in a given circumstance does not demonstrate its functional relevance to this circumstance. To make such a determination classically, one would observe the effect of a disruption to this gene and rescue this effect by complementation with the wild type allele. Our methodology provides a direct parallel to this in that it does not simply correlate a dynamic transcriptional profile with a signaling output, but tests the sufficiency of this profile to produce the signaling output. By doing so, we provide a measure of causality.
While the phenotype we adopt here is time-dependent signaling, the same framework is applicable to other quantitative phenotypes, such as noise regulation or dose response alignment (Yu et al., 2008). For example, Sst2 was postulated to be a noise regulator in the mating pathway (Dixit et al., 2014). By defining the phenotype to be rescued as the difference in cell-to-cell variability of signaling of the sst2∆ strain as compared to wild type, a modified version of the general CLOC framework that uses Opto-Sst2 expression to control population variation could be used to generate concrete quantitative hypothesis about the noise regulatory role of the SST2 feedback loop. Similarly, while we use optogenetic transcriptional control, our methodology could easily accommodate a number of existing optogenetic tools that modulate a variety of post transcriptional processes including cAMP signaling (Stierl et al., 2011) and subcellular localization of proteins (Yumerefendi et al., 2015), and thus be expanded to a general set of tools for the investigation of different types of feedback regulation. In fact, iterative applications of CLOC that place different aspects of a gene’s regulation under optogenetic control could be used to systematically isolate and characterize their individual contributions to the feedback. For example, Gpa1 downregulates the pathway by tethering Fus3 to the membrane and this interaction is also upregulated in feedback upon pheromone stimulation (Metodiev et al., 2002). This binding could be placed under optogenetic control and CLOC repeated using this new control point in order to determine whether this aspect of GPA1 feedback is also relevant prior to pheromone stimulation.
Such extensions of the method are facilitated by the use of a simple empirical model to devise the “rescue” control sequence. This aspect defies biological intuition where it is often considered that mechanistic models are most useful, a reasonable statement when direct analysis of the model is intended. Since the hypothesis generating entity here is the rescue sequence itself, we limited the granularity of the model, using a generic representation that can produce such a rescuing sequence while still being generalizable to other systems and applications. This is analogous to the historical use of the voltage clamp in neurobiology, in which an electronic circuit that does not mechanistically model the voltage gated ion channels of a neuron nonetheless provides valuable information about their operation and quantitative characteristics.
Overall, we believe CLOC to be a broadly applicable tool that can update the classical genetics toolbox with a method that facilitates the study of one of the most essential aspects of life—the ability to self-regulate through feedback.
STAR METHODS
Contact for reagent and resource sharing
Further information and requests for resources and reagents should be directed to and will be fulfilled by the Lead Contact, Hana El-Samad (hana.el-samad@ucsf.edu). To request reagents please submit a form to UCSF at https://ita.ucsf.edu/researchers/mta.
Experimental model and subject details
The yeast Saccharomyces cerevisiae was used in this study. The specific strain used is w303a.
Plasmid and strain construction
All plasmids and strains used in this study are listed in tables S1 and S2. Plasmids contain single integration constructs selectable using auxotrophic markers. They were linearized by digestion with Pme1 and transformed into yeast using standard lithium acetate protocols. Annotated sequences are available on Addgene. The cryptochrome optogenetic expression constructs were PCR amplified from Addgene plasmids 28244 and 28245 and modified using Gibson Assembly. The gene encoding the secreted protease BAR1 (Manney, 1983) was knocked out in all reported strains to ensure that α-factor was not extracellularly degraded during experiments. This was done by amplifying a nourseothricin resistance cassette flanked on either side by 70 base pairs of homology to the genomic sequence immediately upstream and downstream of the BAR1 gene and transforming this amplicon into yeast. SST2, MSG5, and GPA1 deletions were similarly accomplished using the amplification of a kanamycin resistance cassette. To control for previously reported basal expression in the dark from the cryptochrome optogenetic system, feedback deficient mutants are compared to wild type strains transformed with a copy of the optogenetic expression system and the corresponding light inducible allele.
Media and growth conditions
Single colonies are picked from YPD (yeast extract, peptone, 2% glucose) agar plates into 50 mL of YPD media and grown overnight at 30 degrees Celsius to an optical density of 0.2. 8 mL of this culture is added to 22 mL of YPD in a 50 mL conical tube containing a magnetic stir bar and incubated on the yeast incubator array for 1 hour prior to the start of an experiment.
Method details
Automated closed loop control device
The device hardware consists of custom fabricated, LED-enabled yeast incubator arrays coupled to a liquid handling module and a three-laser flow cytometer (LSR II, Becton Dickinson) (Supplemental Information). Each incubator array consists of four temperature controlled and magnetically stirred chambers designed for liquid culturing of yeast in 50 mL conical tubes (Falcon, Becton Dickinson). Temperature control is achieved using a thermocouple and PID regulated resistive heating. Stirring is achieved using magnets mounted to a rotor using a laser cut adapter to turn magnetic stir bars. Chambers are light isolated and contain a heat sink on which three individual LEDs can be mounted. Custom fabricated caps allows for liquid to be moved in and out of the conical tubes using flexible tubing and standard one-piece fluidic fittings (PEEK No-Twist, VICI). Multiple incubator arrays can be attached to the liquid handling module, and we used 2 arrays for a total of 8 chambers in all experiments presented above. Liquid handling is accomplished using the two syringe pumps (Cavro XCalibur Pump, Tecan) of a High Throughput Sampler (Becton Dickinson) and a stream selector (Valco SD selector, VICI). The liquid handling module allows for the movement of yeast culture from an individual incubator to the cytometry for measurement or to a waste reservoir for culture dilution. Fresh media and α-factor can likewise be moved into individual incubators. A complete schematic of this fluidics setup is shown in the supplemental information.
The syringe pumps, stream selector, and LED driver are each serially addressable and are concurrently controlled during experiments by custom software (LabView, National Instruments) used to coordinate their individual actions. Additionally, this software processes the cytometry data generated during the experiment in real time. This data is then passed to a MatLab program that implements the model predictive control algorithm and dictates the appropriate optogenetic inputs to the LED driver. All model files required for fabrication of device parts are available upon request and a bill of materials is provided in the supplemental information.
Automated culture measurements
The LabView software is used to specify for each experiment the number of culture samples, a sample frequency, a number of outgrowth measurements, and a dilution volume. At each measurement time point, culture is sampled iteratively from each incubator within the array. A sample consists of moving culture from an incubator into the cytometer for measurement, diluting by replacing culture with a volume of fresh media, and then clearing the fluidics lines by pushing an air bubble through the lines and into a waste reservoir. This clearing was sufficient to prevent mixing of subsequent samples (data not shown). For sst2∆ and msg5∆, we used a sampling frequency of 8 minutes and a dilution volume of 1mL. For gpa1∆ we used a sampling frequency of 12 minutes to accommodate the time required for the higher dilution volume of 2 mL needed to maintain exponential growth during the longer experiments. For each experiment, cultures are first measured for a specified number of outgrowth time points (3 for sst2∆ and msg5∆ and 18 for gpa1∆) in order to estimate basal pAGA1-YFP signaling. Before the first measurement after the outgrowth period, 1 mL of YPD containing α-factor is added to each incubator such that the final culture concentration is either 0.5 nM α-factor (Figure 3–5) or 1 nM α-factor (Figure S4) and the dilution media is replaced by YPD containing the appropriate concentration of α-factor. 6 µM α-factor stocks are kept in ten percent ethanol and are used to create the induction media. Light induction begins concurrently with either α-factor addition for experiments with msg5∆ and sst2∆ or the first culture measurement in the case of gpa1∆. In order to prevent phototoxicity during induction of the light inducible alleles, blue light is administered at the specified intensity during a 2 second pulse repeated every 2 minutes. Given the previously reported half-life of activation of the cryptochrome protein, these light pulse trains are sufficient to achieve constant activation. Two incubators within the array are always used as internal controls for α-factor concentration and receive no blue light during the duration of an experiment. A detailed description of protocol and sequential steps used by the automated device for sampling, cleaning, diluting, and induction including the settings for valve positions and syringe actions are included in the supplemental information.
Quantification and statistical analysis
Cytometry measurements are processed by the device software in real time by discarding the first 750 events of a sample in addition to any events with no measured fluorescence. All fluorescence measurements (FITC-H) are then normalized to cell volume by dividing by side scatter (SSC-H) and pAGA1-YFP levels taken as the median FITC-H/SSC-H value of the population. These levels are reported as fold change over basal with the basal level estimated as the median of the measurements taken at the time of pheromone addition (0 hours). For a given time point, the difference in signaling between the wild type and mutant strain (compensation) is calculated as the log2 of the ratio of the mutant output to the wild type output. The total difference is calculated by summing the absolute value of each time point difference that exceeds the standard deviation observed for biological repeats (n=3) at that time (gray shaded region) in the wild type strain in the absence of light.
Supplementary Material
KEY RESOURCES TABLE
| REAGENT or RESOURCE | SOURCE | IDENTIFIER |
| Chemicals, Peptides, and Recombinant Proteins | ||
| Yeast Extract | Alfa Aesar | Cat# 26769 |
| Peptone | BD Biosciences | Cat# 211677 |
| Glucose | Sigma-Aldrich | Cat# D9434 |
| Alpha-Factor Mating Pheromone | VWR Scientific | Cat# H- 2925.0001 |
| Ethanol | Sigma-Aldrich | Cat# E7023 |
| Experimental Models: Organisms/Strains | ||
| S. cerevisiae Strains, see Table S1 | This paper | N/A |
| Recombinant DNA | ||
| PCR template for cryptochrome optogenetic expression constructs |
PubMed 21037589 | pGal4BD- CRY2PHR (Addg ene plasmid # 28244) |
| PCR template for cryptochrome based optogenetic expression constructs |
PubMed 21037589 | pGal4AD-CIB1 (Addgene plasmid # 28245) |
| Yeast integrating plasmids, see Table S2 | This paper | N/A |
| Software and Algorithms | ||
| LabView software for automated closed loop control device |
This paper | doi:10.17632/6ddxgbs9sm.1 |
| Other | ||
| Automated closed loop control device | See Table S4 | See Table S4 |
Highlights:
Classical genetic complementation tests do not reveal temporal requirements
Closed-loop optogenetic compensation (CLOC) defines such dynamic demands
CLOC dynamically comaplements a knockout mutant using real-time in silico feedback
Application to the yeast mating pathway illuminates transcriptional feedback control
ACKNOWLEDGEMENTS
We thank Ignacio Zuleta for advice on the design and construction of the automated closed-loop control device and software and Eric Chow and the Center for Advanced Technology at UCSF for help with its fabrication. This work was funded in part by DARPA (HR0011–16-2–0045) and the Paul Allen Frontiers Group for H.E.-S and the National Institute of Health (R01GM71801) for H.M. Both H.E.-S and H.M. are Chan-Zuckerberg Investigators.
Footnotes
Publisher's Disclaimer: This is a PDF file of an unedited manuscript that has been accepted for publication. As a service to our customers we are providing this early version of the manuscript. The manuscript will undergo copyediting, typesetting, and review of the resulting proof before it is published in its final citable form. Please note that during the production process errors may be discovered which could affect the content, and all legal disclaimers that apply to the journal pertain.
DECLARATION OF INTERESTS
The authors declare no competing interests.
Data and software availability
All raw cytometry data and the Matlab scripts used for data processing are available through Mendeley Data (doi:10.17632/93bkvyhww7.1). All LabView and Matlab code used for control of automated yeast culturing, pheromone induction, cytometric measurement, and light delivery using the device described above as well as the model files needed for its construction are available through Mendeley Data (doi:10.17632/6ddxgbs9sm.1). A summary of the operations and algorithms used in this code is provided in the supplemental information.
REFERENCES
- Bardwell L (2005) ‘A walk-through of the yeast mating pheromone response pathway’,Peptides, 26(2), pp. 339–350. doi: 10.1016/j.peptides.2004.10.002. [DOI] [PMC free article] [PubMed] [Google Scholar]
- Borrelli F, Bemporad A and Morari M (2017) Predictive control for linear and hybrid systems Available at: http://www.cambridge.org/vi/academic/subjects/engineering/control-systems-and-optimization/predictive-control-linear-and-hybrid-systems?format=HB#ofOKQRK8hz8OWysD.97 (Accessed: 21 September 2017).
- Chasse SA et al. (2006) ‘Genome-scale analysis reveals Sst2 as the principal regulator of mating pheromone signaling in the yeast Saccharomyces cerevisiae.’, Eukaryotic cell American Society for Microbiology, 5(2), pp. 330–46. doi: 10.1128/EC.5.2.330-346.2006. [DOI] [PMC free article] [PubMed] [Google Scholar]
- Cirit M, Wang C-C and Haugh JM (2010) ‘Systematic quantification of negative feedback mechanisms in the extracellular signal-regulated kinase (ERK) signaling network.’, The Journal of biological chemistry American Society for Biochemistry and Molecular Biology, 285(47), pp. 36736–44. doi: 10.1074/jbc.M110.148759. [DOI] [PMC free article] [PubMed] [Google Scholar]
- Collins SR et al. (2006) ‘A strategy for extracting and analyzing large-scale quantitative epistatic interaction data Analysis of quantitative epistasis A new technique for analysis of data from synthetic genetic array and E-MAP technology generates high confidence quantitative ep’, Genome Biology, 7(7). doi: 10.1186/gb-2006-7-7-r63. [DOI] [PMC free article] [PubMed] [Google Scholar]
- Dietzel C and Kurjan J (1987) ‘Pheromonal regulation and sequence of the Saccharomyces cerevisiae SST2 gene: a model for desensitization to pheromone.’, Molecular and cellular biology American Society for Microbiology, 7(12), pp. 4169–77. doi: 10.1128/MCB.7.12.4169. [DOI] [PMC free article] [PubMed] [Google Scholar]
- Dixit G et al. (2014) ‘Cellular Noise Suppression by the Regulator of G Protein Signaling Sst2’, Molecular Cell, 55(1), pp. 85–96. doi: 10.1016/j.molcel.2014.05.019. [DOI] [PMC free article] [PubMed] [Google Scholar]
- Doi K et al. (1994) ‘MSG5, a novel protein phosphatase promotes adaptation to pheromone response in S.cerevisiae’, The EMBO Journal, 13(1), pp. 61–70. [DOI] [PMC free article] [PubMed] [Google Scholar]
- Fiore G et al. (2016) ‘In Vivo Real-Time Control of Gene Expression: A Comparative Analysis of Feedback Control Strategies in Yeast’, ACS Synthetic Biology American Chemical Society, 5(2), pp. 154–162. doi: 10.1021/acssynbio.5b00135. [DOI] [PubMed] [Google Scholar]
- Garmendia-Torres C, Goldbeter A and Jacquet M (2007) ‘Nucleocytoplasmic Oscillations of the Yeast Transcription Factor Msn2: Evidence for Periodic PKA Activation’, Current Biology, 17(12), pp. 1044–1049. doi: 10.1016/j.cub.2007.05.032. [DOI] [PubMed] [Google Scholar]
- Gruhler A et al. (2005) ‘Quantitative Phosphoproteomics Applied to the Yeast Pheromone Signaling Pathway’, Molecular & Cellular Proteomics. in Press, 4(3), pp. 310–327. doi: 10.1074/mcp.M400219-MCP200. [DOI] [PubMed] [Google Scholar]
- Harreman MT et al. (2004) ‘Regulation of nuclear import by phosphorylation adjacent to nuclear localization signals.’, The Journal of biological chemistry, 279(20), pp. 20613–21. doi: 10.1074/jbc.M401720200. [DOI] [PubMed] [Google Scholar]
- Hilioti Z et al. (2008) ‘Oscillatory phosphorylation of yeast Fus3 MAP kinase controls periodic gene expression and morphogenesis.’, Current biology : CB. Elsevier Ltd, 18(21), pp. 1700–6. doi: 10.1016/j.cub.2008.09.027. [DOI] [PMC free article] [PubMed] [Google Scholar]
- Hodgkin AL and Huxley AF (1952) ‘A quantitative description of membrane current and its application to conduction and excitation in nerve’, The Journal of Physiology, 117(4), pp. 500–544. doi: 10.1113/jphysiol.1952.sp004764. [DOI] [PMC free article] [PubMed] [Google Scholar]
- Howell AS et al. (2012) ‘Negative Feedback Enhances Robustness in the Yeast Polarity Establishment Circuit’, Cell, 149(2), pp. 322–333. doi: 10.1016/j.cell.2012.03.012. [DOI] [PMC free article] [PubMed] [Google Scholar]
- Kaffman a., Rank NM and O’Shea EK (1998) ‘Phosphorylation regulates association of the transcription factor Pho4 with its import receptor Pse1/Kap121’, Genes & Development, 12(17), pp. 2673–2683. doi: 10.1101/gad.12.17.2673. [DOI] [PMC free article] [PubMed] [Google Scholar]
- Kennedy MJ et al. (2010) ‘rapid blue-light – mediated induction of protein interactions in living cells’, 7(12), pp. 12–16. doi: 10.1038/nMeth.1524. [DOI] [PMC free article] [PubMed] [Google Scholar]
- Lahav G et al. (2004) ‘Dynamics of the p53-Mdm2 feedback loop in individual cells’, Nature Genetics Nature Publishing Group, 36(2), pp. 147–150. doi: 10.1038/ng1293. [DOI] [PubMed] [Google Scholar]
- Leibler S et al. (1999) ‘Robustness in bacterial chemotaxis’, Nature Nature Publishing Group, 397(6715), pp. 168–171. doi: 10.1038/16483. [DOI] [PubMed] [Google Scholar]
- Ljung L (1999) System identification : theory for the user Prentice Hall PTR; Available at: https://books.google.com/books/about/System_Identification.html?id=nHFoQgAACAAJ (Accessed: 21 September 2017). [Google Scholar]
- Lugagne J-B et al. (2017) ‘Balancing a genetic toggle switch by real-time feedback control and periodic forcing’, Nature Communications Nature Publishing Group, 8(1), p. 1671. doi: 10.1038/s41467-017-01498-0. [DOI] [PMC free article] [PubMed] [Google Scholar]
- Manney TR (1983) ‘Expression of the BAR1 gene in Saccharomyces cerevisiae: Induction by the alpha mating pheromone of an activity associated with a secreted protein’, Journal of Bacteriology, 155(1), pp. 291–301. [DOI] [PMC free article] [PubMed] [Google Scholar]
- McCullagh E et al. (2010) ‘Coordinate control of gene expression noise and interchromosomal interactions in a MAP kinase pathway.’, Nature cell biology Nature Publishing Group, 12(10), pp. 954–62. doi: 10.1038/ncb2097. [DOI] [PMC free article] [PubMed] [Google Scholar]
- Metodiev MV et al. (2002) ‘Regulation of MAPK function by direct interaction with the mating-specific Galpha in yeast.’, Science (New York, N.Y.) American Association for the Advancement of Science, 296(5572), pp. 1483–6. doi: 10.1126/science.1070540. [DOI] [PubMed] [Google Scholar]
- Milias-Argeitis A et al. (2011) ‘In silico feedback for in vivo regulation of a gene expression circuit’, Nature Biotechnology Nature Research, 29(12), pp. 1114–1116. doi: 10.1038/nbt.2018. [DOI] [PMC free article] [PubMed] [Google Scholar]
- Milias-Argeitis A et al. (2016) ‘Automated optogenetic feedback control for precise and robust regulation of gene expression and cell growth’, Nature Communications Nature Publishing Group, 7, p. 12546. doi: 10.1038/ncomms12546. [DOI] [PMC free article] [PubMed] [Google Scholar]
- Muzzey D et al. (2009) ‘A Systems-Level Analysis of Perfect Adaptation in Yeast Osmoregulation’, Cell, 138(1), pp. 160–171. doi: 10.1016/j.cell.2009.04.047. [DOI] [PMC free article] [PubMed] [Google Scholar]
- Nakayama N et al. (1988) ‘Role of STE genes in the mating factor signaling pathway mediated by GPA1 in Saccharomyces cerevisiae.’, Molecular and cellular biology American Society for Microbiology, 8(9), pp. 3777–83. doi: 10.1128/MCB.8.9.3777. [DOI] [PMC free article] [PubMed] [Google Scholar]
- Nevozhay D et al. (2009) ‘Negative autoregulation linearizes the dose-response and suppresses the heterogeneity of gene expression.’, Proceedings of the National Academy of Sciences of the United States of America, 106(13), pp. 5123–8. doi: 10.1073/pnas.0809901106. [DOI] [PMC free article] [PubMed] [Google Scholar]
- Pomerening JR, Kim SY and Ferrell JE (2005) ‘Systems-Level Dissection of the Cell-Cycle Oscillator: Bypassing Positive Feedback Produces Damped Oscillations’, Cell, 122(4), pp. 565–578. doi: 10.1016/j.cell.2005.06.016. [DOI] [PubMed] [Google Scholar]
- Ren B et al. (2000) ‘Genome-Wide Location and Function of DNA Binding Proteins’, Science, 290(5500). [DOI] [PubMed] [Google Scholar]
- Rothermel BA, Thornton JL and Butow RA (1997) ‘Rtg3p, a basic helix-loop-helix/leucine zipper protein that functions in mitochondrial-induced changes in gene expression, contains independent activation domains’, Journal of Biological Chemistry American Society for Biochemistry and Molecular Biology, 272(32), pp. 19801–19807. doi: 10.1074/jbc.272.32.19801. [DOI] [PubMed] [Google Scholar]
- Rullan M et al. (2017) ‘Optogenetic Single-Cell Control Of Transcription Achieves Mrna Tunability And Reduced Variability’, doi.org Cold Spring Harbor Laboratory, p. 142893. doi: 10.1101/142893. [Google Scholar]
- Santos SDM, Verveer PJ and Bastiaens PIH (2007) ‘Growth factor-induced MAPK network topology shapes Erk response determining PC-12 cell fate’, Nature Cell Biology Nature Publishing Group, 9(3), pp. 324–330. doi: 10.1038/ncb1543. [DOI] [PubMed] [Google Scholar]
- Stierl M et al. (2011) ‘Light modulation of cellular cAMP by a small bacterial photoactivated adenylyl cyclase, bPAC, of the soil bacterium Beggiatoa.’, The Journal of biological chemistry American Society for Biochemistry and Molecular Biology, 286(2), pp. 1181–8. doi: 10.1074/jbc.M110.185496. [DOI] [PMC free article] [PubMed] [Google Scholar]
- Toettcher JE et al. (2011) ‘Light-based feedback for controlling intracellular signaling dynamics’, Nature Methods Nature Publishing Group, 8(10), pp. 837–839. doi: 10.1038/nmeth.1700. [DOI] [PMC free article] [PubMed] [Google Scholar]
- Tsai TY-C et al. (2008) ‘Robust, tunable biological oscillations from interlinked positive and negative feedback loops.’, Science (New York, N.Y.) American Association for the Advancement of Science, 321(5885), pp. 126–9. doi: 10.1126/science.1156951. [DOI] [PMC free article] [PubMed] [Google Scholar]
- Uhlendorf J et al. (2012) ‘Long-term model predictive control of gene expression at the population and single-cell levels.’, Proceedings of the National Academy of Sciences of the United States of America, (19), p. 565. doi: 10.1073/pnas.1206810109. [DOI] [PMC free article] [PubMed]
- Del Vecchio D et al. (2017) ‘A Blueprint for a Synthetic Genetic Feedback Controller to Reprogram Cell Fate.’, Cell systems Elsevier, 4(1), p. 109–120.e11. doi: 10.1016/j.cels.2016.12.001. [DOI] [PMC free article] [PubMed] [Google Scholar]
- Werner SL et al. (2008) ‘Econgding NF-κB Temporal Control in Response to TNF: Distinct Roles for the Negative Regulators IΚBα and A20’,Genes and Development, 22, p. 2093–2101. doi: /10.1101/gad.1680708. [DOI] [PMC free article] [PubMed] [Google Scholar]
- Xiong W and Ferrell JE (2003) ‘A positive-feedback-based bistable “memory module” that governs a cell fate decision’, Nature Nature Publishing Group, 426(6965), pp. 460–465. doi: 10.1038/nature02089. [DOI] [PubMed] [Google Scholar]
- Yu RC et al. (2008) ‘Negative feedback that improves information transmission in yeast signalling’, Nature Nature Publishing Group, 456(7223), pp. 755–761. doi: 10.1038/nature07513. [DOI] [PMC free article] [PubMed] [Google Scholar]
- Yumerefendi H et al. (2015) ‘Control of Protein Activity and Cell Fate Specification via Light-Mediated Nuclear Translocation’, PLOS ONE Edited by Palazzo AF. Public Library of Science, 10(6), p. e0128443. doi: 10.1371/journal.pone.0128443. [DOI] [PMC free article] [PubMed] [Google Scholar]
Associated Data
This section collects any data citations, data availability statements, or supplementary materials included in this article.