Abstract
We present a fluorogenic method to visualize misfolding and aggregation of a specific protein-of-interest in live cells using structurally modulated fluorescent protein chromophores. Combining photo-physical analysis, X-ray crystallography, and theoretical calculation, we show that fluorescence is triggered by inhibition of twisted-intramolecular charge transfer of these fluorophores in the rigid microenvironment of viscous solvent or protein aggregates. Bioorthogonal conjugation of the fluorophore to Halo-tag fused protein-of-interests allows for fluorogenic detection of both misfolded and aggregated species in live cells. Unlike other methods, our method is capable of detecting previously invisible misfolded soluble proteins. This work provides the first application of fluorescent protein chromophores to detect protein conformational collapse in live cells.
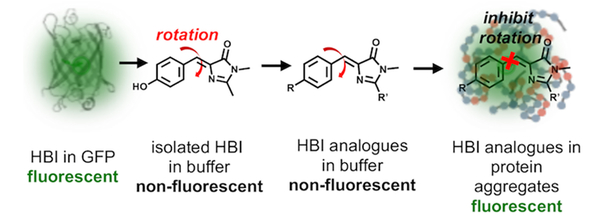
Fluorescent proteins (FPs) have been widely used as genetic tags to provide spatial and temporal information on a protein-of-interest (POI) in live organisms.1 Since the discovery of GFP, it has been evolved to facilitate various biological applications.2 Variations of the GFP chromophore, 4-hydroxybenzylidene-imidazolinone (HBI, Figure 1), have expanded FPs with diverse photophysical properties, including spectral range, quantum yield, photostability, and photoswitchability.3 These chromophores, however, become mostly nonfluorescent when synthesized outside their protein cavity, largely due to rapid nonradiative decay via twisted-intramolecular charge transfer (TICT) (Figure 1).4 Although such behavior undermines the application of FP analogues, both chemical and biological restriction of TICT restores fluorescence of synthetic FP chromophores.4 For instance, fluorophores have been developed to inhibit TICT of FP chromophores by structural modifications.3 In addition, FP analogues locked in supra-molecular hosts,4b metal−organic frameworks,5 aggregated solids6 and host proteins7 have been reported to fluoresce strongly. In biological imaging, HBI analogues have been used to visualize RNA aptamers and DNA quadruplex.8 However, their application to detect other biological processes is rarely reported in live cells.
Figure 1.
Fluorescent protein chromophores can be modulated to serve as fluorogenic probes to detect protein aggregates.
Herein, we report the first application of a FP chromophore to visualize protein misfolding and aggregation, using turn-on fluorescence, both in test tube and in live cells. Environmental stresses and pathogenic mutations of proteins lead to aberrant misfolding and aggregation, causing neurodegenerative disease, including Alzheimer’s disease, Parkinson’s disease, Huntington’s disease, familial amyloidosis, and amyotrophic lateral sclerosis (ALS).9 Protein aggregation initiates from assembly of misfolded soluble oligomers that progress into insoluble aggregates. Both oligomers and aggregates involve enhanced rigidity within the local microenvironment.9b Thus, we attempted to sensitize FP chromophores, whose TICT can be inhibited in the rigid environment within protein aggregates, to turn on fluorescence (Figure 1).
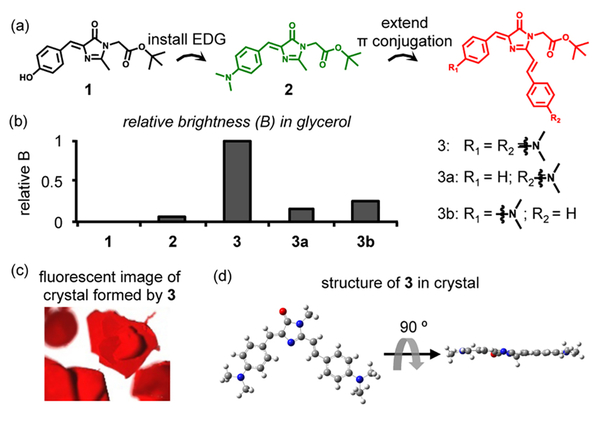
We pursue this goal by structural variation of FP chromophores. Because the local pH inside misfolded and aggregated proteins is hardly basic enough to deprotonate phenol (pKa = 8−10) in probe 1 containing HBI (Figure 2a), we substituted the phenol in HBI with an electron donating dimethylamino group, affording 2 (Figure 2a, in green).10 Both 1 and 2 exhibited elevated fluorescence in solvents containing increasing concentrations of glycerol (Figures S1a,b, S2a,b, S3a,b, S4−6, and Note S1), which mimics the microenvironment in protein aggregates to inhibit TICT. However, the quantum yield (QY, Φ = 0.001 for 1 and Φ = 0.027 for 2 in glycerol, Table S1) was much lower than that of a GFP (Φ = 0.79).1b Next, we extended π conjugation to both increase QY and restrict bond rotation, rendering 3, a compound similar to the chromophore in photoconvertible Kaede protein (Figure 2a, in red).8c,d,11 As expected, 3 exhibited higher QY and brightness than 1 and 2 in glycerol (Φ = 0.22, comparable to Φ of the Kaede protein as 0.33;11a brightness shown in Figure 2b; spectra shown in Figures S1c, S2c, S3c, S4, and S7; photophysical properties shown in Table S1).
Figure 2.
Analogue of the Kaede chromophore is fluorescent in viscous solvent and crystal. (a) Chemical structures of the FP chromophore mimics in this work. (b) Relative brightness of fluorophores in glycerol. Calculation of brightness is shown in Table S1. (c) Crystal of 3 exhibits red fluorescence. (d) Planar structure of the fluorophore moiety of 3 in the crystal (the t-butyl group is omitted for simplicity).
Interestingly, crystals of 3 exhibited fluorescence, suggesting its aggregation induced emission (AIE) feature (Figures 2c and S11a).12 The fluorescence may arise from the tight crystal packing that inhibits TICT of 3 (Figure S11b). In the fluorescent crystal, 3 adopted a near-planar structure (Figure 2d). A time-dependent density functional theory calculation based on this structure (Figure S12a−c) showed that one dimethylamino benzyl played a major role in donating electrons at the S1 excited state (position A in Figure S12d). Compound 3a, without electron-donating capacity at position A, was still fluorescent (Figure S8 and Table S1) but with a diminished quantum yield by ~50%; whereas 3b, without electron-donating capacity at position B, does not affect quantum yield (Figure S9 and Table S1). The absorptivity of both 3a and 3b was reduced (Table S1 and Figure S4), yielding ~5-fold decrease in its brightness (Figure 2b and Table S1). Collectively, these data reveal the chemical modulations necessary to sensitize the FP chromophores toward rigid environments that mimic protein aggregates.
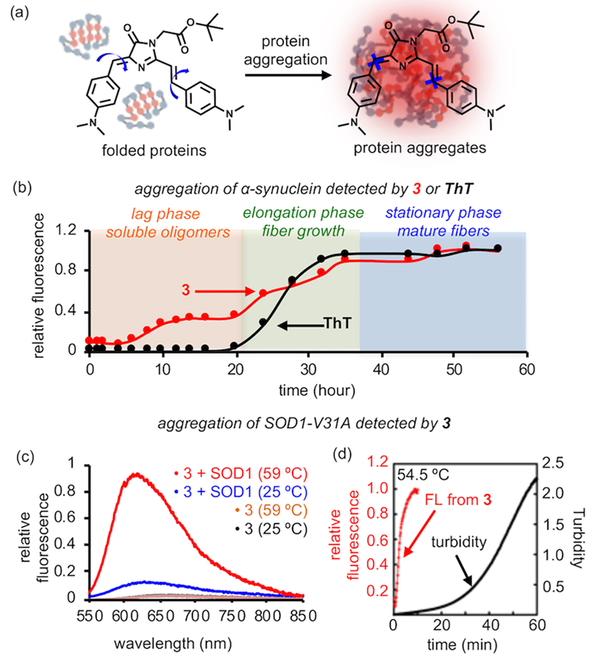
To ask whether 3 detects protein aggregation via fluorescence increase (Figure 3a), we chose α-synuclein ( α-syn), whose aggregation is associated with Parkinson’s disease.13 In the presence of 3, aggregation of α-syn into fibers (Figure S13a) induced fluorogenic signal (Figure S13b and Note S2) analogous to Thioflavin T (ThT), a probe that detects fibers (Figure S13c).14 We next used 3 to monitor kinetics of α-syn aggregation. Purified α-syn aggregates via a three-step process: formation of soluble oligomers, growth of amyloid fibers, and maturation of fibers (Figure 3b). Although ThT detects growth and maturation of fibers, it fails to detect soluble oligomers that are increasingly speculated to be the toxic species (black curve in Figure 3b). By contrast, fluorescence of 3 started to increase at 4 h (red curve in Figure 3b). At this time point, formation of soluble oligomers was evidenced by a chemical cross-linking experiment (Figure S14a,b). Furthermore, a second phase of fluorescence increase was observed at 20 h and leveled off at 36 h (red curve in Figure 3b). These signal changes coincided with the time points of fiber growth and maturation as observed by ThT (black curve of Figure 3b). Thus, these data strongly indicate that 3 can detect multiple stages of protein aggregation.
Figure 3.
In vitro detection of protein aggregates. (a) Protein aggregates provide a crowded environment to restrict rotational motion of 3 and turn on its fluorescence. (b) Aggregation kinetics of α-synuclein as measured by 3 and ThT. (c) Heat-induced aggregation of SOD1(V31A) increases fluorescence intensity of 3. (d) Kinetics of fluorescence increase is faster than that of turbidity increase during aggregation of SOD1(V31A) at 54.5 °C.
In addition to α-synuclein, we also demonstrated that 3 could detect aggregates formed by globular proteins, by using mutant superoxide dismutase 1 (SOD1), whose aggregation is commonly found in ALS disease.15 We chose the recently discovered SOD1(V31A) mutant.16 After 20 min of incubation at 59 °C, we observed an 8- to 10-fold fluorescence intensity increase (Φ from 0.026 to 0.22 in Table S1; Figures 3c and S15a) using a wide concentration range of 3 (Figure S15b). The fluorescence signal was found in the insoluble fraction and proportional to the amount of protein aggregates (Figures S15a,c and Note S3), confirming the physical association between 3 and SOD1 aggregates. In addition, we found the kinetics of fluorescence increase from 3 was faster than that of turbidity, whose signal originates from insoluble protein aggregates (Figure 3d). These data further suggest that 3 could potentially detect both misfolded soluble proteins and insoluble aggregates.
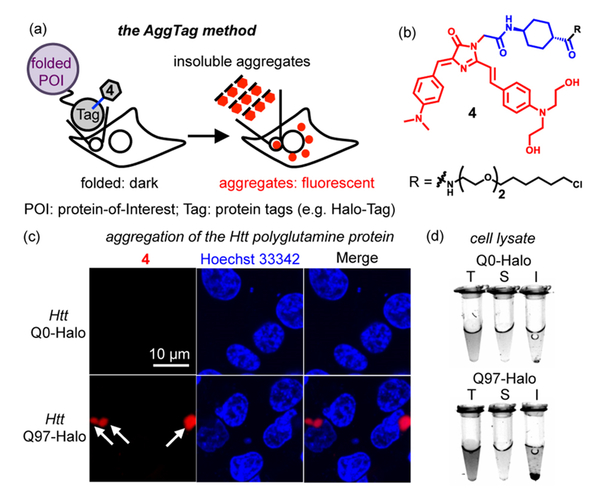
It is desirable to use turn-on fluorescence to monitor aggregation of a protein-of-interest (POI) in live cells. To this end, we genetically fused Halo-Tag17 to the POI and synthesized 4 for bioorthogonal conjugation (Figure 4a, hereafter termed as AggTag method). Using the AggTag method, we expect that the fluorophore remains dark when POI is folded. Aggregation of POI, however, would bury the fluorophore in protein aggregates to restrict its rotation and activate fluorescence (Figure 4a). 4 bears two hydroxyl groups for improved solubility and a warhead for bioconjugation to Halo-Tag (Figure 4b). The fluorescent properties of 4 were identical to 3 (Figures S1f, S2f, S3f, S4, and S10) and exhibited lower fluorescent signals than typical solvatochromic fluorophores (e.g., SBD) and molecular rotor fluorophores (e.g., CCVJ), when incubated with proteins harboring hydrophobic surfaces and lipid mimics (Figure S16).
Figure 4.
FP chromophore analogue 4 enables a fluorogenic method (AggTag) to detect aggregates of specific proteins in live cells. (a) Diagram of the fluorogenic AggTag method that detects POI aggregation in live cells. (b) Structure of 4. (c) Aggregation of the Htt 97Q-Halo·4 conjugate induces fluorescence increase. (d) Fluorescent image of cell lysate from cells expressing Q0-Halo or Q97-Halo labeled by 4 after fractionation. Quantification of fluorescent intensity is shown in Figure S13c. T, total lysate; S, supernatant; I, insoluble fraction. Methods are provided in SI Method Sections 4 and 13.
We tested whether 4 is fluorogenic upon protein aggregation in live cells, using the Huntingtin exon 1 protein (Htt) with 97 polyglutamine repeat that severely aggregates.18 Using conventional nonfluorogenic methods, we observed aggregation of Htt-Q97 by the appearance of puncta with a fluorescent background (Figure S17 and Note S4).19 The AggTag method, however, yielded a dark fluorescence in cells expressing Htt-Q0-Halo labeled by 4 (Figure 4c). The dark background was not caused by the lack of protein expression, as indicated by a dual-probe labeling experiment using 4 and an always-fluorescent coumarin ligand (Figure S18a−c). The turn-on fluorescence from 4 was observed as puncta without any background fluorescence when Htt-Q97-Halo was expressed (Figures 4c and S18d). This fluorescence was not due to nonspecific binding of 4 in cells, because HEK293T cells coexpressing Htt-Q97-GFP and Halo-Tag or just expressing Htt-Q97 showed no fluorescence of 4 (Figure S19). In accordance to these observations, fractionation of the lysate indicated that the fluorescence of Htt-Q97-Halo primarily originated from the insoluble fraction (Figures 4d and S20). When an intermediate poly glutamine Htt-Q46-Halo was expressed in HEK293T cells for 48 h, we visualized cytosolic diffusive fluorescence (Figure S21a), likely caused by soluble oligomers as indicated by a chemical cross-linking experiment (Figure S21b). These results together establish the AggTag method as a fluorogenic approach to detect protein aggregation in live cells.
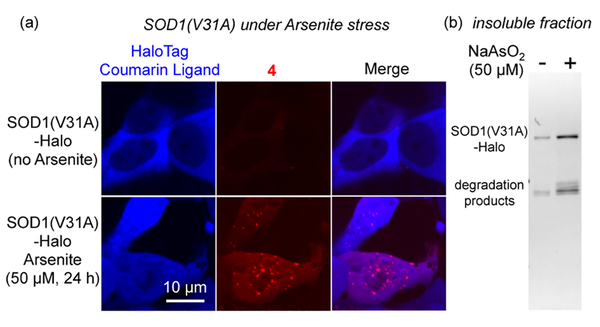
We further demonstrated that the AggTag method could visualize previously invisible misfolded soluble proteins in live cells. To this end, we chose the SOD1(V31A) mutant that is associated with a slow disease progression.16 We expressed and labeled SOD1(V31A)-Halo fusion protein simultaneously with the coumarin ligand and 4 in HEK293T cells. Using the coumarin fluorescence, we found that SOD1(V31A) was primarily located in the cytosol and the oxidative stressor NaAsO2 induced partial translocation of SOD1(V31A) to the nucleus.20 While the coumarin fluorescence remained diffuse before and after stress (left panel, Figure 5a), 4 only exhibited both diffuse and punctate fluorescent structures in stressed cells (middle panel, Figure 5a; and Figure S22). This turn-on fluorescence was not due to either aggregation of or nonspecific binding to the Halo·4 conjugate, as it remained dark in stressed cells (Figure S23). By contrast to V31A, the wild-type SOD1 exhibited less aggregation propensity and remained largely folded (dark fluorescence from the SOD1-Halo·4 conjugate) in NaAsO2-stressed cells (Figure S24). Whereas, another SOD1 mutant G85R behaved similarly to V31A (Figure S25). The punctate fluorescence could be rationalized by a fractionation experiment, wherein more aggregates of SOD1(V31A) were found in cells treated with NaAsO2 (Figures 5b and S26). The diffusive fluorescence of 4 was found to arise from misfolded soluble proteins, as demonstrated by several lines of evidence. First, we found that fluorescence of the SOD1(V31A)-Halo·4 conjugate increased in the absence of insoluble protein aggregates (Figure S27a). The Halo·4 conjugate, as a control, remained nonfluorescent under all heat conditions (Figure S27a,b). Second, the kinetics of fluorescence increase was much faster than that of turbidity (Figure S28a). Third, the kinetics of fluorescence coincided with that of protein misfolding (Figure S28b). Finally, a chemical cross-linking experiment identified misfolded oligomers as higher molecular weight species, only in NaAsO2 stressed cells (Figure S29).
Figure 5.
AggTag method detects stress-induced protein aggregates that are invisible using nonfluorogenic methods. (a) Fluorogenic detection of NaAsO2-induced SOD1(V31A) aggregation in HEK293T cells. (b) NaAsO2 treatment leads to more SOD1(V31A) aggregation as confirmed by fractionation. Methods are provided in SI Method Sections 4, 5, and 13.
In summary, we have demonstrated for the first time that analogues of the FP chromophores can fluoresce in protein aggregates. Our structural variation, crystal structure, and theoretical calculations together revealed key features that are essential toward an effective detection. Different from previous nonfluorogenic methods, the fluorogenic method in this work can visualize both misfolded soluble proteins and insoluble aggregates in intact live cells. Such fluorogenic detection can be achieved via chemical modulation of fluorophores with molecular rotor and AIE properties, providing new applications for this large family of molecules.12,21 The unique fluorogenicity of this class of probes, combined with the AggTag method, make them generally applicable to a wide range of proteins whose aggregation is associated with diseases and suited to potentiate screening platforms to explore therapeutics that can ameliorate aggregation of these pathogenic proteins.
Supplementary Material
ACKNOWLEDGMENTS
We thank Penn State Microscopy and Cytometry Facility for confocal and electron microscopy images acquisition. Crystal structure of 3 was acquired at the Penn State X-ray crystallography facility. Computational work was supported by National Science Foundation (Grant CHE-1565520 to X.L.) and facilitated via the use of advanced computational, storage, and networking infrastructure provided by the Hyak supercomputer system and funded by the STF at the University of Washington. This work was supported by the Burroughs Wellcome Fund Career Award at the Scientific Interface (X.Z.), Paul Berg Early Career Professorship (X.Z.), Lloyd and Dottie Huck Early Career Award (X.Z.), and National Institutes of Health R01 GM121858 (L.B.).
Footnotes
ASSOCIATED CONTENT
Supporting Information
The Supporting Information is available free of charge on the ACS Publications website at DOI: ext-link 10.1021/jacs.8b02176.
Experimental procedures, supplemental notes and figures, and synthetic methods (PDF)
Notes
The authors declare no competing financial interest.
REFERENCES
- (1).(a) Zimmer M Chem. Rev 2002, 102 (3), 759–81. [DOI] [PubMed] [Google Scholar]; (b) Tsien RY Annu. Rev. Biochem 1998, 67, 509–44. [DOI] [PubMed] [Google Scholar]
- (2).(a) Tsien RY; Miyawaki A Science 1998, 280 (5371), 1954– 1955. [DOI] [PubMed] [Google Scholar]; (b) Rodriguez EA; Campbell RE; Lin JY; Lin MZ; Miyawaki A; Palmer AE; Shu X; Zhang J; Tsien RY Trends Biochem. Sci 2017, 42 (2), 111–129. [DOI] [PMC free article] [PubMed] [Google Scholar]
- (3).Walker CL; Lukyanov KA; Yampolsky IV; Mishin AS; Bommarius AS; Duraj-Thatte AM; Azizi B; Tolbert LM; Solntsev KM Curr. Opin. Chem. Biol 2015, 27, 64–74. [DOI] [PubMed] [Google Scholar]
- (4).(a) Baranov MS; Lukyanov KA; Borissova AO; Shamir J; Kosenkov D; Slipchenko LV; Tolbert LM; Yampolsky IV; Solntsev KM J. Am. Chem. Soc 2012, 134 (13), 6025–32. [DOI] [PubMed] [Google Scholar]; (b) Baldridge A; Samanta SR; Jayaraj N; Ramamurthy V; Tolbert LM J. Am. Chem. Soc 2011, 133 (4), 712–5. [DOI] [PubMed] [Google Scholar]
- (5).Williams DE; Dolgopolova EA; Pellechia PJ; Palukoshka A; Wilson TJ; Tan R; Maier JM; Greytak AB; Smith MD; Krause JA; Shustova NB J. Am. Chem. Soc 2015, 137 (6), 2223–6. [DOI] [PubMed] [Google Scholar]
- (6).Carayon C; Ghodbane A; Gibot L; Dumur R; Wang J; Saffon N; Rols MP; Solntsev KM; Fery-Forgues S Small 2016, 12 (47), 6602–6612. [DOI] [PubMed] [Google Scholar]
- (7).Baldridge A; Feng S; Chang YT; Tolbert LM ACS Comb. Sci 2011, 13 (3), 214–7. [DOI] [PubMed] [Google Scholar]
- (8).(a) Paige JS; Wu KY; Jaffrey SR Science 2011, 333 (6042), 642–6. [DOI] [PMC free article] [PubMed] [Google Scholar]; (b) Filonov GS; Moon JD; Svensen N; Jaffrey SR J. Am. Chem. Soc 2014, 136 (46), 16299–308. [DOI] [PMC free article] [PubMed] [Google Scholar]; (c) Warner KD; Sjekloca L; Song W; Filonov GS; Jaffrey SR; Ferre-D’Amare AR Nat. Chem. Biol 2017, 13 (11), 1195–1201. [DOI] [PMC free article] [PubMed] [Google Scholar]; (d) Feng G; Luo C; Yi H; Yuan L; Lin B; Luo X; Hu X; Wang H; Lei C; Nie Z; Yao S Nucleic Acids Res. 2017, 45 (18), 10380–10392. [DOI] [PMC free article] [PubMed] [Google Scholar]; (e) Kellenberger CA; Wilson SC; Sales-Lee J; Hammond MC J. Am. Chem. Soc 2013, 135 (13), 4906– 9. [DOI] [PMC free article] [PubMed] [Google Scholar]
- (9).(a) Balch WE; Morimoto RI; Dillin A; Kelly JW Science 2008, 319 (5865), 916–9. [DOI] [PubMed] [Google Scholar]; (b) Ross CA; Poirier MA Nat. Rev. Mol. Cell Biol. 2005, 6 (11), 891–898. [DOI] [PubMed] [Google Scholar]
- (10).Grimm JB; English BP; Chen J; Slaughter JP; Zhang Z; Revyakin A; Patel R; Macklin JJ; Normanno D; Singer RH; Lionnet T; Lavis LD Nat. Methods 2015, 12 (3), 244–50. [DOI] [PMC free article] [PubMed] [Google Scholar]
- (11).(a) Ando R; Hama H; Yamamoto-Hino M; Mizuno H; Miyawaki A Proc. Natl. Acad. Sci. U. S. A 2002, 99 (20), 12651–6. [DOI] [PMC free article] [PubMed] [Google Scholar]; (b) Subach FV; Verkhusha VV Chem. Rev 2012, 112 (7), 4308–27. [DOI] [PMC free article] [PubMed] [Google Scholar]; (c) Tomura M; Yoshida N; Tanaka J; Karasawa S; Miwa Y; Miyawaki A; Kanagawa O Proc. Natl. Acad. Sci. U. S. A 2008, 105 (31), 10871–6. [DOI] [PMC free article] [PubMed] [Google Scholar]
- (12).Hong Y; Lam JW; Tang BZ Chem. Soc. Rev 2011, 40 (11), 5361–88. [DOI] [PubMed] [Google Scholar]
- (13).Lashuel HA; Overk CR; Oueslati A; Masliah E Nat. Rev. Neurosci 2013, 14 (1), 38–48. [DOI] [PMC free article] [PubMed] [Google Scholar]
- (14).Qin L; Vastl J; Gao J Mol. BioSyst 2010, 6 (10), 1791–5. [DOI] [PubMed] [Google Scholar]
- (15).Rosen DR; Siddique T; Patterson D; Figlewicz DA; Sapp P; Hentati A; Donaldson D; Goto J; O’Regan JP; Deng HX; Rahmani Z; Krizus A; McKenna-Yasek D; Cayabyab A; Gaston SM; Berger R; Tanzi RE; Halperin JJ; Herzfeldt B; Van den Bergh R; Hung WY; Bird T; Deng G; Mulder DW; Smyth C; Laing NG; Soriano E; Pericak-Vance MA; Haines J; Rouleau GA; Gusella JS; Horvitz HR; Brown RH Nature 1993, 362 (6415), 59–62. [DOI] [PubMed] [Google Scholar]
- (16).Dangoumau A; Verschueren A; Hammouche E; Papon MA; Blasco H; Cherpi-Antar C; Pouget J; Corcia P; Andres CR; Vourc’h P Neurobiol. Aging 2014, 35 (1), 266–e1.−266.e4. [DOI] [PubMed] [Google Scholar]
- (17).(a) Los GV; Encell LP; McDougall MG; Hartzell DD; Karassina N; Zimprich C; Wood MG; Learish R; Ohana RF; Urh M; Simpson D; Mendez J; Zimmerman K; Otto P; Vidugiris G; Zhu J; Darzins A; Klaubert DH; Bulleit RF; Wood KV ACS Chem. Biol 2008, 3 (6), 373–82. [DOI] [PubMed] [Google Scholar]; (b) Lin HY; Haegele JA; Disare MT; Lin QS; Aye YJ Am. Chem. Soc 2015, 137 (19), 6232–6244. [DOI] [PMC free article] [PubMed] [Google Scholar]; (c) Ballister ER; Aonbangkhen C; Mayo AM; Lampson, MA; Chenoweth DM Nat. Commun 2014, 5, 5475. [DOI] [PMC free article] [PubMed] [Google Scholar]
- (18).(a) Gidalevitz T; Ben-Zvi A; Ho KH; Brignull HR; Morimoto RI Science 2006, 311 (5766), 1471–1474. [DOI] [PubMed] [Google Scholar]; (b) DiFiglia M; Sapp E; Chase KO; Davies SW; Bates GP; Vonsattel JP; Aronin N Science 1997, 277 (5334), 1990–3. [DOI] [PubMed] [Google Scholar]
- (19).(a) Ramdzan YM; Polling S; Chia CPZ; Ng IHW; Ormsby AR; Croft NP; Purcell AW; Bogoyevitch MA; Ng DCH; Gleeson PA; Hatters DM Nat. Methods 2012, 9 (5), 467–476. [DOI] [PubMed] [Google Scholar]; (b) Kitamura A; Nagata K; Kinjo M Int. J. Mol. Sci 2015, 16 (3), 6076–6092. [DOI] [PMC free article] [PubMed] [Google Scholar]
- (20).(a) Mateju D; Franzmann TM; Patel A; Kopach A; Boczek EE; Maharana S; Lee HO; Carra S; Hyman AA; Alberti S EMBO J. 2017, 36 (12), 1669–1687. [DOI] [PMC free article] [PubMed] [Google Scholar]; (b) Zhong Y; Wang J; Henderson MJ; Yang P; Hagen BM; Siddique T; Vogel BE; Deng HX; Fang S eLife 2017, 6, e23759. [DOI] [PMC free article] [PubMed] [Google Scholar]
- (21).(a) Haidekker MA; Theodorakis EA Org. Biomol. Chem 2007, 5 (11), 1669–1678. [DOI] [PubMed] [Google Scholar]; (b) Qian H; Cousins ME; Horak EH; Wakefield A; Liptak MD; Aprahamian I Nat. Chem 2017, 9 (1), 83–87. [DOI] [PubMed] [Google Scholar]
Associated Data
This section collects any data citations, data availability statements, or supplementary materials included in this article.


