

Abstract
Background
The rising prevalence of obesity has made hepatic steatosis an increasingly common issue. Ultrasound is generally used in clinical practice to assess steatosis, but its accuracy has been inconsistent across studies. We aimed to determine the validity of ultrasound to diagnose hepatic steatosis when compared to the criterion method proton magnetic resonance spectroscopy (MRS) in older individuals.
Methods
A total of 72 healthy white European individuals (n = 42 men; n = 30 women aged 67–76 years) participating in the Hertfordshire Birth Cohort Physical Activity trial had hepatic steatosis assessed by ultrasound and MRS. The ultrasound scans were graded as normal, mild, moderate and severe steatosis, while hepatic fat content above 5.5% by MRS was used as a cut-off for steatosis.
Results
18 participants (25%) had a level of hepatic fat measured by MRS consistent with diagnosis of steatosis. The sensitivity and specificity of ultrasound in diagnosing hepatic steatosis (mild/moderate/severe vs normal) were 96% (95% CI: 87–99.6%) and 94% (95% CI: 73–100%) respectively, although overlap in MRS hepatic fat content was observed between the ultrasound categories.
Conclusions
Ultrasound is a valid method for detecting the presence or absence of hepatic steatosis in older adults and can be used as an alternative tool in both clinical investigations and epidemiological studies, when other imaging techniques are not feasible.
Introduction
Hepatic steatosis or fatty liver disease (FLD) is a condition characterised by triglyceride accumulation within the cytoplasm of hepatocytes [1]. Steatosis can progress to steatohepatitis (severe fatty liver accompanied by inflammation, with or without the presence of fibrosis) and cirrhosis (presence of hepatic fibrosis), and it has also been associated with an increased risk of hepatocarcinoma and cardiovascular disease [2–4].
Hepatic steatosis is related to excessive alcohol consumption (alcohol-related fatty liver disease) and obesity (non-alcoholic fatty liver disease–NAFLD). These two conditions are distinguished on the basis of alcohol intake with a threshold of <20 g alcohol per day in women and <30 g in men typically used to make a diagnosis of NAFLD [3]. With the increasing prevalence of obesity and type 2 diabetes, NAFLD has now become the most common cause of abnormal liver biochemistry (elevated liver transaminases) in western countries [3]. NAFLD ranges from simple fatty liver disease (steatosis), through fat with necro-inflammation and/or fibrosis (non-alcoholic steatohepatisis (NASH)) to advanced fibrosis, cirrhosis and hepato-cellular cancer [5]. In Europe, the prevalence of NAFLD is estimated to be 20–30% in the general population [6]. As it is a reversible condition, early non-invasive detection may play a significant role in the management of NAFLD [7, 8]. NAFLD occurs more frequently in the middle-aged and older populations given that risk factors for its development tend to increase in prevalence with advancing age [9]. Older adults also show more severe biochemical, haematological and histological changes than their younger counterparts[5].
The gold standard technique to detect steatosis is a liver biopsy with histological or biochemical estimation of hepatic fat content [10–12]. However, a liver biopsy is an invasive technique which may be associated with clinical complications [1, 13–15] and thus it is rarely undertaken in the absence of a clear clinical diagnostic imperative. Circulating liver enzyme concentrations such as aspartate transaminase (AST) and alanine transaminase (ALT) are often used as proxy markers of NAFLD[16]. However, these tests have low sensitivity and specificity and may not predict clinical outcomes [17]. Alternatively, imaging methods may be employed to define the extent and course of the disease. The best imaging techniques can be used as reference methods but are not feasible in large-scale population-based studies due to logistical and financial constraints. In addition, Computer tomography (CT) exposes participants to ionising radiation, which limits its use for repeated/longitudinal examinations and research studies [1, 14, 18, 19]. Magnetic resonance imaging (MRI) and proton magnetic resonance spectroscopy (MRS) allow quantification of hepatic fat and are increasingly accepted as non-invasive alternatives to liver biopsy [20, 21], thus permitting longitudinal assessment of hepatic fat in patients. MRS has been shown to be highly reproducible with high diagnostic accuracy [22]
In contrast to the gold standard imaging methods, ultrasonography is a safe, inexpensive and highly accessible imaging technique for the detection of steatosis both in clinical and research settings. Its validity has been tested against those imaging technique in small sample sizes and younger age groups [23–26]; however it is important to assess its validity in older adults due to the anatomical and physiological liver changes with increasing age. Extra-hepatic manifestations and complications, such as cardiovascular disease and extra-hepatic neoplasms are more common in older age groups than their younger counterparts [9].
The reported accuracy and reliability have also been inconsistent across studies as this method is subject to inter-observer variability [7, 27]; and little is known about the performance of the specific ultrasound criteria used to assess hepatic steatosis.
We aimed to assess the diagnostic accuracy and inter-observer reliability of the ultrasound method to detect the presence of steatosis against MRS as the criterion method. In particular, we evaluated whether the ultrasound can predict the grade of severity of steatosis (mild, moderate and severe) and determined the contribution of specific ultrasound criteria to prediction.
Materials and methods
Study population
The study was based on data collected on 100 healthy white European individuals, aged 67–76 years, participating in the Hertfordshire Birth Cohort Physical Activity trial [28]. Analyses were performed on the final sample of 72 individuals (n = 42 men; n = 30 women) who had complete data on both MRS and ultrasound. Missing data for MRS scans were due to technical issues or termination of the scan due to participant claustrophobia.
The original exclusion criteria for the trial were inability to cycle unaided for a minimum of 30 minutes; contraindications for physical activity; prevalent diabetes, untreated or unstable ischaemic heart disease, and contraindications to a magnetic resonance scan.
The study was approved by the Hertfordshire Local Research Ethics Committee and was performed in accordance with the Declaration of Helsinki. Written informed consent was obtained from all study participants.
Study measurements
Volunteers were asked to refrain from eating for 10 hours before their arrival at the clinic as a glucose tolerance test was part of the trial protocol.
Anthropometry
All measurements were carried out by trained research staff. Weight was measured on TANITA (model BC-418 MA, Tokyo, Japan) and height with a wall-mounted stadiometer (SECA model 240, Birmingham, UK). Body mass index (BMI) was calculated as weight (kg) divided by height squared (m2).
Ultrasound
Ultrasound scanning was performed with a LOGIQ Book XP ultrasound device (GE Healthcare) with a 3C-RS curved transducer. A sub-costal approach was used to image both liver lobes using a standard imaging protocol. All liver sweeps were made during deep inspiration. The first sweep was made from lateral to medial with the right lobe in an optimised longitudinal scan plane that showed the liver and long axis of the kidney. The second sweep was made from cranial to caudal, starting at the level of the hepatic veins, along the portal vein towards the gallbladder, with the dome of the liver in a transverse position. The third sweep was a longitudinal scan of the left lobe and was made from lateral to medial just over the gallbladder area. The final sweep was a left transverse scan from the level of the hepatic veins towards the pancreas.
A semi-quantitative grading system was used to define normal echotexture or mild, moderate and severe steatosis (Fig 1).
Fig 1.
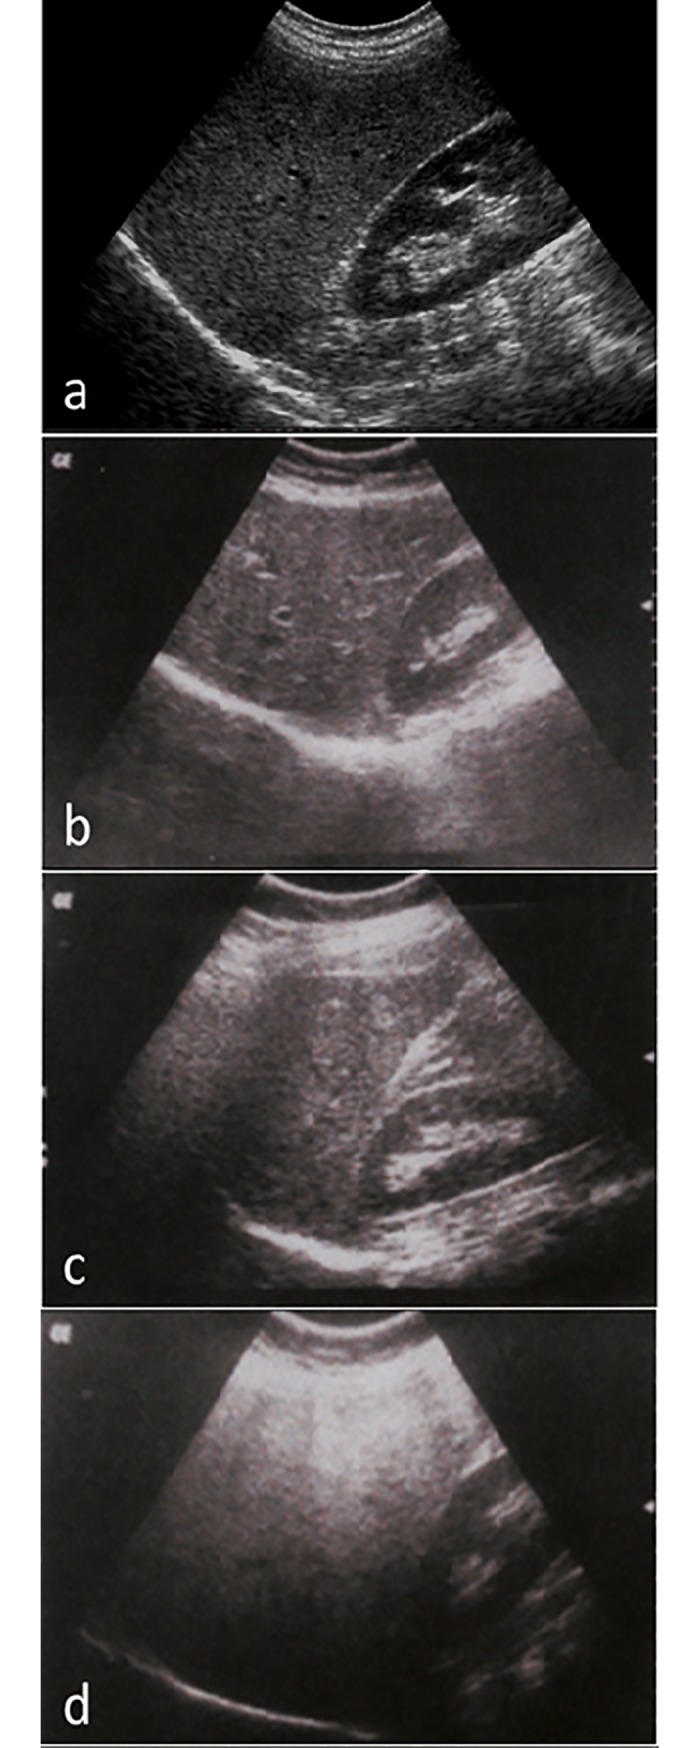
Gradation of hepatic steatosis: a. Normal liver echotexture. Longitudinal section through the right lobe of the liver. Similar echogenicity between liver parenchyma and the cortex of the right kidney. Intra-hepatic vascular anatomy is clearly visible and posterior aspects of the liver are well depicted; b. Mild—slightly increased echogenicity when compared to the renal cortex; blood vessels/diaphragm in view; c. Moderate—clear increased echogenicity of the liver parenchyma, impaired visualisation of intrahepatic vascular anatomy, decreased echogenicity of the renal cortex; d. Severe—marked increased echogenicity/absorption, poor penetration and visualisation of intrahepatic vascular anatomy and diaphragm, marked decreased echogenicity of the renal cortex.
The images were recorded and scored retrospectively by two operators who were blinded to all other study measures. The ultrasound images were qualitatively scored according to standardised criteria [29–32]. The hepatic steatosis scoring criteria were: a) criterion 1—increased echo reflectivity of the liver parenchyma (bright liver in comparison with the kidney), b) criterion 2—decreased visualisation of the intra-hepatic vasculature, c) criterion 3—attenuation of ultrasound beam. Each criterion was scored on a 4-point scale (i.e. as 1, 2, 3 or 4) and summed, resulting in cumulative liver fat score which ranged from 3 to 12. A score of ≤4 was classified as normal liver, 5–7 as mild steatosis, 8–10 as moderate steatosis, and score ≥11 was classified as severe steatosis. To test whether ultrasound can diagnose the presence or the absence of hepatic steatosis, the mild, moderate and severe categories were grouped together.
The validity of scores of the two operators was assessed by comparison with a third senior radiographer (the gold standard), who had carried out their training. 20 scans were randomly selected from the whole sample and were scored independently by the operators and the reviewer. Correlation coefficients with the reviewer’s scores were 0.97 (p<0.001) and 0.86 (p<0.001) for operator A and B, respectively. The agreement between different readers was substantial; the inter reader agreement between operator A and the gold standard was k = 0.98 between operator B and the gold standard was k = 0.71 and between operator A and B was 0.72.
Proton magnetic resonance spectroscopy
Proton MRS measures of intrahepatic lipid (IHL) content were conducted on a Siemens MAGNETOM 3T Tim Trio scanner at the Wolfson Brain Imaging Centre, Cambridge Biomedical Campus, UK. A proton spectrum was obtained from a voxel of cube length 1.5 cm, located within the posterior aspect of the right lobe of the liver, using the point resolved selective spectroscopy (PRESS) sequence. During this scan participants were given breathing instructions with a 7-second cycle, which was designed and gated such that localisation and subsequent data acquisition occurred at the end of expiration. Non-water suppressed data were acquired with repetition time (TR) = 7 s, echo time (TE) = 35 ms and averaged over 64 measures. The voxel was positioned to avoid blood vessels and the biliary tree, using T2-weighted HASTE transaxial images that were also acquired in the same phase of respiration. The spectra were analysed in jMRUI version 3.0 [33]and fitted using the AMARES algorithm [34] with prior knowledge. T2-correction was applied assuming a T2 relaxation time of 27 ms and 61 ms for hepatic water and CH2 lipid respectively at 3.0T[35]. IHL was quantified using water as an internal reference [24], and was expressed as the CH2 resonance at 1.3 ppm divided by the sum of the CH2 and water resonances. Hepatic fat content above 5.5% by MRS was used as a cut-off value for steatosis, which represents the 95th centile of hepatic fat content in low risk individuals with normal BMI, glucose tolerance, liver function tests and low alcohol consumption[36].
Statistical analysis
Statistical analysis was performed using Stata version 13.0 (StataCorp). Results are presented as means (SD), n (%) or median (IQR). The sensitivity and specificity of the ultrasound in predicting the presence of hepatic steatosis was calculated against the MRS normal/abnormal categories. The performance of specific ultrasound criteria was assessed against the content of hepatic fat assessed by MRS.
Results
Data on 72 individuals (n = 30 women; n = 42 men) were available for analysis, with a mean age of 72±2.5 years and a mean BMI of 26.6 ± 3.8 kg/m2. Diabetes was present in 6% of the cohort; none of the participants were underweight or morbidly obese. Mean percentage hepatic steatosis as measured by MRS was 25% (Table 1).
Table 1. Characteristics of participants from the Hertfordshire Birth Cohort Physical Activity trial with hepatic steatosis measures by ultrasound and MRS.
| Total Number | 72 |
|---|---|
| Men | 42 (58%) |
| Age (yrs) | 72 ±2.5 |
| BMI (kg/m2) | 26.6±3.8 |
| Waist (cm) | 97.0±12.0 |
| ALT (iu/L) | 24 (18–33) |
| Prevalence of Type 2 Diabetes | 4 (6%) |
| Hepatic steatosis by MRS | 18 (25%) |
| Hepatic steatosis by ultrasound | 19 (26%) |
Data are mean ± SD, N (%) or median (IQR)
MRS Magnetic Resonance Spectroscopy
ALT Alanine aminotransferase
GGT Gamma-glutamyl transferase
Steatosis was strongly linked to overall and central obesity. It was detected in 64% of the obese participants (BMI ≥30), 26% of the overweight participants (25< BMI <30), and 12% of normal weight participants. Steatosis was also found in 13 men (35%) and in 6 women (24%) with central obesity (waist circumference ≥90 cm in men and ≥80 cm in women). 10% of the study participants who had raised ALT levels had hepatic steatosis (Table 2).
Table 2. Prevalence of overweight, obesity, central obesity, and raised ALT levels, overall and by MRS or ultrasound categories of hepatic steatosis.
| N | Steatosis by MRSc | Steatosis by USSd | |
|---|---|---|---|
| Weight statusa | |||
| Normal weight | 26 (36%) | 2 (8%) | 3 (12%) |
| Overweight | 35 (49%) | 10 (29%) | 9 (26%) |
| Obese | 11 (15%) | 6 (55%) | 7 (64%) |
| Central obesityb | |||
| Central obesity (men) | 37 (51%) | 13 (35%) | 13 (35%) |
| Central obesity (women) | 25 (35%) | 5 (20%) | 6 (24%) |
| ALT >40 iu/L | 7 (10%) | 5 (71%) | 4 (57%) |
aNormal weight: BMI 18.5–24.9 kg/m2; Overweight: 25.0–29.9 kg/m2; Obese: ≥30 kg/m2
bCentral obesity: waist circumference ≥90 cm in men, and ≥80 cm in women
cMRS: Magnetic Resonance Spectroscopy
dUSS: Ultrasound Scan
Abnormal ALT: >40iu/L
Fig 2. illustrates MRS intrahepatic fat levels by ultrasound categories. The moderate and severe categories were grouped together due to small numbers. Median and interquartile ranges (IQR) of MRS hepatic fat content increased progressively from the normal to the mild and moderate/severe categories (normal: 2.2% (1.2 to 3.5%); mild: 8.2% (7.3–15.0%); moderate/severe: 19.5% (18.1–30.4%); p<0.0001).
Fig 2. Box and whisker plot of MRS hepatic steatosis levels by ultrasound category.

The lower boundary of the box indicates the 25th percentile, the line within the box is the median value and the upper boundary of the box indicates the 75th percentile. The whiskers indicate the minimum and maximum data values. If outliers are present the wiskers extend to the nearest data observation which lies within 1.5 times the interquartile range from the box. The moderate and severe scores were combined due to the small number of individuals in these categories.
Table 3 describes the accuracy of the ultrasound method to detect hepatic steatosis versus the criterion method of MRS. The sensitivity and specificity of the ultrasound method in diagnosing presence or absence of any degree of steatosis was 96% (95% CI 87–99.6%) and 94% (95% CI 73–100%) respectively, with a positive predictive value of 98% (95% CI 90–100%).
Table 3. Accuracy of ultrasound in detecting hepatic steatosis as defined by MRS in 72 participants of the Hertfordshire Birth Cohort Physical Activity trial.
| MRS categories | ||
|---|---|---|
| No steatosisa | Steatosisb | |
| Ultrasound categories: | ||
| Normal | 52 | 1 |
| Mild | 2 | 10 |
| Moderate | 0 | 2 |
| Severe | 0 | 5 |
aNo steatosis = ≤ 5.5% intrahepatic fat content assessed by MRS
bSteatosis = > 5.5% intrahepatic fat content assessed by MRS
None of the individual ultrasound criteria performed as well as the combined ultrasound assessment (Table 4). For the ultrasound criterion 1 (increased echo reflectivity of the liver parenchyma (bright liver), the sensitivity was higher than the combined score (100%; 95% CI 82–100%), but the specificity was substantially lower (13%; 95% CI 45–25%). The positive predictive value was also lower than the overall score, 28% (95% CI 18–40%). For criterion 2 (decreased visualization of the intra-hepatic vasculature), the sensitivity and specificity for detecting steatosis was 92% (95% CI 82–98%) and 89% (95% CI 65–98) respectively with a positive predictive value of 96% (95% CI 87–100). For criterion 3 (attenuation of the ultrasound beam, impaired penetration) the sensitivity was lower than criterion 1 and 2, 78% (95% CI 52–94), but the specificity was high 98.2% (95% CI 90–100).
Table 4. Accuracy of individual ultrasound criterion to detect hepatic steatosis.
| MRS categories | ||
|---|---|---|
| No steatosis | Steatosis | |
| Ultrasound criteriaa: | ||
| criterion 1: Echo reflectivity | ||
| Negative | 7 | 0 |
| Positive | 47 | 18 |
| criterion 2: Vasculature | ||
| Negative | 50 | 2 |
| Positive | 4 | 16 |
| criterion 3: Attenuation | ||
| Negative | 53 | 4 |
| Positive | 1 | 14 |
aUltrasound criteria
criterion 1: Increased echo reflectivity of liver parenchyma (in comparison with the kidney)
criterion 2: Decreased visualisation of intra-hepatic vasculature
criterion 3: Attenuation of ultrasound beam, impaired penetration
Discussion
Given the on-going obesity epidemic, the prevalence of hepatic steatosis is likely to increase, but accurate data on prevalence are unlikely to be possible in the absence of validated methods that can be applied at the population level. Our study shows that ultrasound is an accurate and reliable imaging method for detecting the presence of hepatic steatosis when compared to MRS, with a sensitivity of 96% and a specificity of 94% and a high positive predictive value (98%). Furthermore, ultrasound allows the assessment of severity as it can discriminate between mild, moderate and severe hepatic steatosis.
Our data are consistent with previous reports which compared ultrasound against histology, MRS or other imaging techniques, suggesting that ultrasound is a valid method to diagnose hepatic steatosis [7, 25–27, 31, 37]. However, other studies have reported that the sensitivity may decrease in obese and older patients [38–40] perhaps because thick layers of subcutaneous fat may limit the ability to reliably detect liver echogenicity[39] or ageing may change the echo properties of the liver and kidney[40]. However, our observations demonstrate that the ultrasound method used here has excellent validity even in a sample of older individuals with a high prevalence of overweight and obesity (overweight 49% and obese 15%).
Our study also found a substantial overlap between the ultrasound-defined categories of steatosis. Similar observations were also reported in another MRS study of 50 adults (43 men, 7 women), in which considerable overlap in hepatic lipid content was observed between different ultrasound grades: absent (0.0–1.58%), mild (2.2–16.2%), moderate(4.9–26.7%) and severe (8.1–76.8%) steatosis [26]. Liver fibrosis and inflammation may affect the ultrasound grades and lead to misclassification; advanced fibrosis could cause echogenic abnormalities on the ultrasound image, decreasing the sensitivity of this method to detect mild to moderate to severe histological steatosis [1]. We also found that the performance of specific individual ultrasound criteria was not as accurate as the combined ultrasound score, a finding similar to a previous report that sensitivity was highest for a combined scoring method [41].
This study had some limitations. We were unable to investigate whether the ultrasound can differentiate between moderate and severe hepatic steatosis as our sample only included 2 individuals in the moderate category and 5 in the severe category. However, a meta-analysis which included 34 studies and 2815 participants [7] found that the overall sensitivity and specificity of the ultrasound in discriminating histologically defined moderate to severe steatosis was 84.8% and 93.6% respectively, suggesting that the ultrasound can be used to classify the degree of severity of hepatic steatosis. Our study sample included older individuals but did not include any participants with severe obesity (BMI≥40), thus we cannot generalise our conclusions about the validity of ultrasound for the assessment of steatosis to that sub-group. This method will need to be validated in independent studies including groups of different ages and body sizes. Further research in this area would be of benefit. Furthermore, this study did not include more objective ultrasound approaches of liver steatosis such as the hepatorenal ratio using histogram echo intensity and transient elastography (Fibroscan or Echosens). Software is typically required to calculate the hepatorenal ratio in large datasets, and this is often not available as freeware. Retrospective assessment of images is not always feasible as technical parameters such as gain and dynamic range require setting at the time of scanning to maximise contrast, making the process of deriving this ratio cumbersome[42]. The applicability of the transient elastography method is questionable in obese individuals (BMI > 30 kg/m2) as the fatty thoracic belt attenuates elastic and US waves, making liver stiffness measurement challenging, which may result in underestimating liver damage[42]. In addition, the validation work of this tool has been mainly carried out in patients with chronic liver disease and their results may not be extrapolated to the general population [43–45].
MRS was used as the criterion method in this study as it is non-invasive and it would not have been possible, either ethically or practically, to have used liver biopsy as the criterion method in a study of healthy volunteers from the general population. MRS is an accepted method for accurate detection and quantification of hepatic steatosis [19] and has been validated against biochemical and histological analyses of liver tissue biopsy [14, 36, 46]. A possible advantage of MRS as a criterion method is that the technique may assess a much larger volume of the liver than a biopsy, which could be important if the distribution of liver fat is not uniform [19]. Other strengths of our study include the conduct of the ultrasound examination and the MRS scan on the same day and the reduction of inter-observer variation by the validation of the ultrasound scores of the two operators against an experienced radiographer.
In conclusion, our study in older individuals add to the growing evidence that ultrasound is a valid tool for the assessment of the presence or absence of hepatic steatosis. Compared to other diagnostic methods, ultrasound is a non-invasive, relatively inexpensive, and widely available imaging technique that can be employed in clinical settings and large-scale population-based research studies.
Acknowledgments
We are grateful to all the volunteers who took part in the study. We also thank: the staff of the Wolfson Brain Imaging Centre, the NIHR/Wellcome Trust Clinical Research Facility in Addenbrooke’s Hospital and the Field Epidemiology and the data management teams from the MRC Epidemiology Unit for assisting with the data collection and data processing and management.
Data Availability
All relevant data are within the paper.
Funding Statement
This research was funded by the Medical Research Council core support including MC_UU_12015/5, MC_UU_12015/1, MC_UU_12015/3, MC_UU_12015/4, MC_UU_12015/2. The funder had no role in study design, data collection and analysis, decision to publish, or preparation of the manuscript.
References
- 1.Lupsor-Platon M, Stefanescu H, Muresan D, Florea M, Szasz ME, Maniu A, et al. Noninvasive assessment of liver steatosis using ultrasound methods. Medical ultrasonography. 2014;16(3):236–45. Epub 2014/08/12. . [DOI] [PubMed] [Google Scholar]
- 2.Smedile A, Bugianesi E. Steatosis and hepatocellular carcinoma risk. European review for medical and pharmacological sciences. 2005;9(5):291–3. Epub 2005/10/20. . [PubMed] [Google Scholar]
- 3.Anstee QM, McPherson S, Day CP. How big a problem is non-alcoholic fatty liver disease? Bmj. 2011;343:d3897 Epub 2011/07/20. 10.1136/bmj.d3897 . [DOI] [PubMed] [Google Scholar]
- 4.Targher G, Day CP, Bonora E. Risk of cardiovascular disease in patients with nonalcoholic fatty liver disease. The New England journal of medicine. 2010;363(14):1341–50. Epub 2010/10/01. 10.1056/NEJMra0912063 . [DOI] [PubMed] [Google Scholar]
- 5.Frith J, Day CP, Henderson E, Burt AD, Newton JL. Non-alcoholic fatty liver disease in older people. Gerontology. 2009;55(6):607–13. Epub 2009/08/20. 10.1159/000235677 . [DOI] [PubMed] [Google Scholar]
- 6.Guidelines WGOG. Nonalcoholic Fatty Liver Disease and Nonalcoholic Steatohepatitis: World Gastroenterology Organisation; 2012. Available from: http://www.worldgastroenterology.org/assets/export/userfiles/2012_NASH%20and%20NAFLD_Final_long.pdf. [Google Scholar]
- 7.Hernaez R, Lazo M, Bonekamp S, Kamel I, Brancati FL, Guallar E, et al. Diagnostic accuracy and reliability of ultrasonography for the detection of fatty liver: a meta-analysis. Hepatology. 2011;54(3):1082–90. Epub 2011/05/28. 10.1002/hep.24452 ; PubMed Central PMCID: PMC4197002. [DOI] [PMC free article] [PubMed] [Google Scholar]
- 8.Khov N, Sharma A, Riley TR. Bedside ultrasound in the diagnosis of nonalcoholic fatty liver disease. World journal of gastroenterology: WJG. 2014;20(22):6821–5. Epub 2014/06/20. 10.3748/wjg.v20.i22.6821 ; PubMed Central PMCID: PMC4051921. [DOI] [PMC free article] [PubMed] [Google Scholar]
- 9.Bertolotti M, Lonardo A, Mussi C, Baldelli E, Pellegrini E, Ballestri S, et al. Nonalcoholic fatty liver disease and aging: epidemiology to management. World journal of gastroenterology: WJG. 2014;20(39):14185–204. Epub 2014/10/24. 10.3748/wjg.v20.i39.14185 ; PubMed Central PMCID: PMC4202348. [DOI] [PMC free article] [PubMed] [Google Scholar]
- 10.Kleiner DE, Brunt EM, Van Natta M, Behling C, Contos MJ, Cummings OW, et al. Design and validation of a histological scoring system for nonalcoholic fatty liver disease. Hepatology. 2005;41(6):1313–21. Epub 2005/05/26. 10.1002/hep.20701 . [DOI] [PubMed] [Google Scholar]
- 11.Araya J, Rodrigo R, Videla LA, Thielemann L, Orellana M, Pettinelli P, et al. Increase in long-chain polyunsaturated fatty acid n—6/n—3 ratio in relation to hepatic steatosis in patients with non-alcoholic fatty liver disease. Clinical science. 2004;106(6):635–43. Epub 2004/01/15. 10.1042/CS20030326 . [DOI] [PubMed] [Google Scholar]
- 12.Puri P, Baillie RA, Wiest MM, Mirshahi F, Choudhury J, Cheung O, et al. A lipidomic analysis of nonalcoholic fatty liver disease. Hepatology. 2007;46(4):1081–90. Epub 2007/07/27. 10.1002/hep.21763 . [DOI] [PubMed] [Google Scholar]
- 13.Joy D, Scott BB. To perform or not to perform liver biopsy: an alternative view. Gut. 2003;52(4):610 Epub 2003/03/13. ; PubMed Central PMCID: PMC1773598. [DOI] [PMC free article] [PubMed] [Google Scholar]
- 14.Thomas EL, Hamilton G, Patel N, O'Dwyer R, Dore CJ, Goldin RD, et al. Hepatic triglyceride content and its relation to body adiposity: a magnetic resonance imaging and proton magnetic resonance spectroscopy study. Gut. 2005;54(1):122–7. Epub 2004/12/14. 10.1136/gut.2003.036566 ; PubMed Central PMCID: PMC1774370. [DOI] [PMC free article] [PubMed] [Google Scholar]
- 15.Dienstag JL. The role of liver biopsy in chronic hepatitis C. Hepatology. 2002;36(5 Suppl 1):S152–60. Epub 2002/10/31. 10.1053/jhep.2002.36381 . [DOI] [PubMed] [Google Scholar]
- 16.Kotronen A, Peltonen M, Hakkarainen A, Sevastianova K, Bergholm R, Johansson LM, et al. Prediction of non-alcoholic fatty liver disease and liver fat using metabolic and genetic factors. Gastroenterology. 2009;137(3):865–72. Epub 2009/06/16. 10.1053/j.gastro.2009.06.005 . [DOI] [PubMed] [Google Scholar]
- 17.Musso G, Gambino R, Cassader M, Pagano G. Meta-analysis: natural history of non-alcoholic fatty liver disease (NAFLD) and diagnostic accuracy of non-invasive tests for liver disease severity. Annals of medicine. 2011;43(8):617–49. Epub 2010/11/03. 10.3109/07853890.2010.518623 . [DOI] [PubMed] [Google Scholar]
- 18.Schwenzer NF, Springer F, Schraml C, Stefan N, Machann J, Schick F. Non-invasive assessment and quantification of liver steatosis by ultrasound, computed tomography and magnetic resonance. Journal of hepatology. 2009;51(3):433–45. Epub 2009/07/17. 10.1016/j.jhep.2009.05.023 . [DOI] [PubMed] [Google Scholar]
- 19.Reeder SB, Cruite I, Hamilton G, Sirlin CB. Quantitative assessment of liver fat with magnetic resonance imaging and spectroscopy. Journal of magnetic resonance imaging: JMRI. 2011;34(4):729–49. Epub 2011/09/20. 10.1002/jmri.22580 . [DOI] [PMC free article] [PubMed] [Google Scholar]
- 20.Lee SS, Park SH. Radiologic evaluation of nonalcoholic fatty liver disease. World journal of gastroenterology: WJG. 2014;20(23):7392–402. Epub 2014/06/27. 10.3748/wjg.v20.i23.7392 ; PubMed Central PMCID: PMC4064084. [DOI] [PMC free article] [PubMed] [Google Scholar]
- 21.Szczepaniak LS, Nurenberg P, Leonard D, Browning JD, Reingold JS, Grundy S, et al. Magnetic resonance spectroscopy to measure hepatic triglyceride content: prevalence of hepatic steatosis in the general population. American journal of physiology Endocrinology and metabolism. 2005;288(2):E462–8. 10.1152/ajpendo.00064.2004 . [DOI] [PubMed] [Google Scholar]
- 22.Bohte AE, van Werven JR, Bipat S, Stoker J. The diagnostic accuracy of US, CT, MRI and 1H-MRS for the evaluation of hepatic steatosis compared with liver biopsy: a meta-analysis. European radiology. 2011;21(1):87–97. Epub 2010/08/04. 10.1007/s00330-010-1905-5 ; PubMed Central PMCID: PMC2995875. [DOI] [PMC free article] [PubMed] [Google Scholar]
- 23.Pozzato C, Radaelli G, Dall'Asta C, Verduci E, Villa A, Villa C, et al. MRI in identifying hepatic steatosis in obese children and relation to ultrasonography and metabolic findings. Journal of pediatric gastroenterology and nutrition. 2008;47(4):493–9. Epub 2008/10/15. 10.1097/MPG.0b013e31817b6e10 . [DOI] [PubMed] [Google Scholar]
- 24.Edens MA, van Ooijen PM, Post WJ, Haagmans MJ, Kristanto W, Sijens PE, et al. Ultrasonography to quantify hepatic fat content: validation by 1H magnetic resonance spectroscopy. Obesity. 2009;17(12):2239–44. Epub 2009/05/23. 10.1038/oby.2009.154 . [DOI] [PubMed] [Google Scholar]
- 25.Mancini M, Prinster A, Annuzzi G, Liuzzi R, Giacco R, Medagli C, et al. Sonographic hepatic-renal ratio as indicator of hepatic steatosis: comparison with (1)H magnetic resonance spectroscopy. Metabolism: clinical and experimental. 2009;58(12):1724–30. Epub 2009/09/01. 10.1016/j.metabol.2009.05.032 . [DOI] [PubMed] [Google Scholar]
- 26.Mehta SR, Thomas EL, Patel N, Crofton ME, McCarthy J, Eliahoo J, et al. Proton magnetic resonance spectroscopy and ultrasound for hepatic fat quantification. Hepatology research: the official journal of the Japan Society of Hepatology. 2010;40(4):399–406. Epub 2010/03/20. 10.1111/j.1872-034X.2009.00620.x . [DOI] [PubMed] [Google Scholar]
- 27.Joy D, Thava VR, Scott BB. Diagnosis of fatty liver disease: is biopsy necessary? European journal of gastroenterology & hepatology. 2003;15(5):539–43. Epub 2003/04/19. 10.1097/01.meg.0000059112.41030.2e . [DOI] [PubMed] [Google Scholar]
- 28.Finucane FM, Horton J, Purslow LR, Savage DB, Brage S, Besson H, et al. Randomized controlled trial of the efficacy of aerobic exercise in reducing metabolic risk in healthy older people: The Hertfordshire Physical Activity Trial. BMC endocrine disorders. 2009;9:15 Epub 2009/06/24. 10.1186/1472-6823-9-15 ; PubMed Central PMCID: PMC2708167. [DOI] [PMC free article] [PubMed] [Google Scholar]
- 29.Saverymuttu SH, Joseph AE, Maxwell JD. Ultrasound scanning in the detection of hepatic fibrosis and steatosis. British medical journal. 1986;292(6512):13–5. Epub 1986/01/04. ; PubMed Central PMCID: PMC1338970. [DOI] [PMC free article] [PubMed] [Google Scholar]
- 30.Joseph AE, Saverymuttu SH, al-Sam S, Cook MG, Maxwell JD. Comparison of liver histology with ultrasonography in assessing diffuse parenchymal liver disease. Clinical radiology. 1991;43(1):26–31. Epub 1991/01/01. . [DOI] [PubMed] [Google Scholar]
- 31.Mendler MH, Bouillet P, Le Sidaner A, Lavoine E, Labrousse F, Sautereau D, et al. Dual-energy CT in the diagnosis and quantification of fatty liver: limited clinical value in comparison to ultrasound scan and single-energy CT, with special reference to iron overload. Journal of hepatology. 1998;28(5):785–94. Epub 1998/06/13. . [DOI] [PubMed] [Google Scholar]
- 32.Needleman L, Kurtz AB, Rifkin MD, Cooper HS, Pasto ME, Goldberg BB. Sonography of diffuse benign liver disease: accuracy of pattern recognition and grading. AJR American journal of roentgenology. 1986;146(5):1011–5. Epub 1986/05/01. 10.2214/ajr.146.5.1011 . [DOI] [PubMed] [Google Scholar]
- 33.Naressi A, Couturier C, Devos JM, Janssen M, Mangeat C, de Beer R, et al. Java-based graphical user interface for the MRUI quantitation package. Magma. 2001;12(2–3):141–52. Epub 2001/06/08. . [DOI] [PubMed] [Google Scholar]
- 34.Vanhamme L, van den Boogaart A, Van Huffel S. Improved method for accurate and efficient quantification of MRS data with use of prior knowledge. Journal of magnetic resonance. 1997;129(1):35–43. . [DOI] [PubMed] [Google Scholar]
- 35.Guiu B, Loffroy R, Petit JM, Aho S, Ben Salem D, Masson D, et al. Mapping of liver fat with triple-echo gradient echo imaging: validation against 3.0-T proton MR spectroscopy. European radiology. 2009;19(7):1786–93. 10.1007/s00330-009-1330-9 . [DOI] [PubMed] [Google Scholar]
- 36.Szczepaniak LS, Babcock EE, Schick F, Dobbins RL, Garg A, Burns DK, et al. Measurement of intracellular triglyceride stores by H spectroscopy: validation in vivo. The American journal of physiology. 1999;276(5 Pt 1):E977–89. Epub 1999/05/18. . [DOI] [PubMed] [Google Scholar]
- 37.Mathiesen UL, Franzen LE, Aselius H, Resjo M, Jacobsson L, Foberg U, et al. Increased liver echogenicity at ultrasound examination reflects degree of steatosis but not of fibrosis in asymptomatic patients with mild/moderate abnormalities of liver transaminases. Digestive and liver disease: official journal of the Italian Society of Gastroenterology and the Italian Association for the Study of the Liver. 2002;34(7):516–22. Epub 2002/09/19. . [DOI] [PubMed] [Google Scholar]
- 38.Mottin CC, Moretto M, Padoin AV, Swarowsky AM, Toneto MG, Glock L, et al. The role of ultrasound in the diagnosis of hepatic steatosis in morbidly obese patients. Obesity surgery. 2004;14(5):635–7. Epub 2004/06/10. 10.1381/096089204323093408 . [DOI] [PubMed] [Google Scholar]
- 39.de Moura Almeida A, Cotrim HP, Barbosa DB, de Athayde LG, Santos AS, Bitencourt AG, et al. Fatty liver disease in severe obese patients: diagnostic value of abdominal ultrasound. World journal of gastroenterology: WJG. 2008;14(9):1415–8. Epub 2008/03/07. 10.3748/wjg.14.1415 ; PubMed Central PMCID: PMC2693692. [DOI] [PMC free article] [PubMed] [Google Scholar]
- 40.Wang CC, Hsieh TC, Tseng TC, Wang PC, Hsu CS, Lin HH, et al. Factors affecting the diagnostic accuracy of ultrasonography in assessing the severity of hepatic steatosis. Journal of the Formosan Medical Association = Taiwan yi zhi. 2014;113(4):249–54. Epub 2014/04/02. 10.1016/j.jfma.2012.07.004 . [DOI] [PubMed] [Google Scholar]
- 41.Dasarathy S, Dasarathy J, Khiyami A, Joseph R, Lopez R, McCullough AJ. Validity of real time ultrasound in the diagnosis of hepatic steatosis: a prospective study. Journal of hepatology. 2009;51(6):1061–7. Epub 2009/10/23. 10.1016/j.jhep.2009.09.001 . [DOI] [PMC free article] [PubMed] [Google Scholar]
- 42.Shiralkar K, Johnson S, Bluth EI, Marshall RH, Dornelles A, Gulotta PM. Improved method for calculating hepatic steatosis using the hepatorenal index. Journal of ultrasound in medicine: official journal of the American Institute of Ultrasound in Medicine. 2015;34(6):1051–9. Epub 2015/05/28. 10.7863/ultra.34.6.1051 . [DOI] [PubMed] [Google Scholar]
- 43.Imajo K, Kessoku T, Honda Y, Tomeno W, Ogawa Y, Mawatari H, et al. Magnetic Resonance Imaging More Accurately Classifies Steatosis and Fibrosis in Patients With Nonalcoholic Fatty Liver Disease Than Transient Elastography. Gastroenterology. 2016;150(3):626–37 e7. Epub 2015/12/19. 10.1053/j.gastro.2015.11.048 . [DOI] [PubMed] [Google Scholar]
- 44.de Ledinghen V, Vergniol J, Foucher J, Merrouche W, le Bail B. Non-invasive diagnosis of liver steatosis using controlled attenuation parameter (CAP) and transient elastography. Liver international: official journal of the International Association for the Study of the Liver. 2012;32(6):911–8. Epub 2012/06/08. 10.1111/j.1478-3231.2012.02820.x . [DOI] [PubMed] [Google Scholar]
- 45.Shen F, Zheng RD, Mi YQ, Wang XY, Pan Q, Chen GY, et al. Controlled attenuation parameter for non-invasive assessment of hepatic steatosis in Chinese patients. World journal of gastroenterology: WJG. 2014;20(16):4702–11. Epub 2014/05/02. 10.3748/wjg.v20.i16.4702 ; PubMed Central PMCID: PMC4000506. [DOI] [PMC free article] [PubMed] [Google Scholar]
- 46.Longo R, Pollesello P, Ricci C, Masutti F, Kvam BJ, Bercich L, et al. Proton MR spectroscopy in quantitative in vivo determination of fat content in human liver steatosis. Journal of magnetic resonance imaging: JMRI. 1995;5(3):281–5. Epub 1995/05/01. [DOI] [PubMed] [Google Scholar]
Associated Data
This section collects any data citations, data availability statements, or supplementary materials included in this article.
Data Availability Statement
All relevant data are within the paper.