Interindividual variability in the development (rate and extent) of drug clearance pathways(1) may contribute to the observed 14-fold variability in indomethacin (IND) systemic exposure(2), and thus, the drug’s unpredictable efficacy and toxicity profile following standard dosing regimens. Indomethacin is prescribed commonly in the Neonatal Intensive Care Unit for prophylaxis from Intraventricular Hemorrhage (IVH) and medical closure of Patent Ductus Arteriosus (PDA). Up to 25% of preterm infants fail medical closure with indomethacin and other NSAIDs and go on to require surgical PDA ligation. Thus, improved understanding of indomethacin dosing in individual infants could improve medical care. Indomethacin is primarily metabolized to inactive moieties by direct acylglucuronidation by UGT2B7 and UGT1A9(3)and cytochrome P450 2C9 (CYP2C9)-mediated O-demethylation(4). In the context of a rapidly maturing preterm infant, assessment of the relative contribution of the competing glucuronidation and CYP pathways via urine collection over the first 24-48 hours following drug administration, a common practice in neonatal research (5, 6), may not reflect the relative metabolic contributions later in the treatment course when the patients are older (and more mature).
Dramatic increases in clearance occurring over a relatively short treatment period (1-2 weeks) could have an important impact on subsequent dosing decisions to maintain adequate drug exposures. Preliminary analysis of 24-hour urine collections revealed <1% dose recovery requiring a change to a longitudinal study design. We wish to share our initial observation regarding the magnitude of the observed “ontogeny” effect on IND clearance in preterm infants. These data provide new insights into the dynamic nature of the dose-exposure-response relationship in newborns, with implications for the design of future studies in neonates.
An IRB approved prospective cohort study of indomethacin metabolic variability in preterm infants is enrolling at a large neonatal intensive care unit (NICU) at a free-standing children’s hospital. Preterm infants < 32 weeks gestational age at birth treated with indomethacin per routine clinical care (IVH prophylaxis or PDA closure) had urine collected with each diaper change for up to 7 days after the last dose. Each infant received a total of between 2-12 doses of indomethacin. Demographic data, dosing data, and clinical outcomes were collected from the electronic medical record. Indomethacin and metabolites were quantified by LC/MS/MS and statistical comparisons conducted using JMP Pro12.
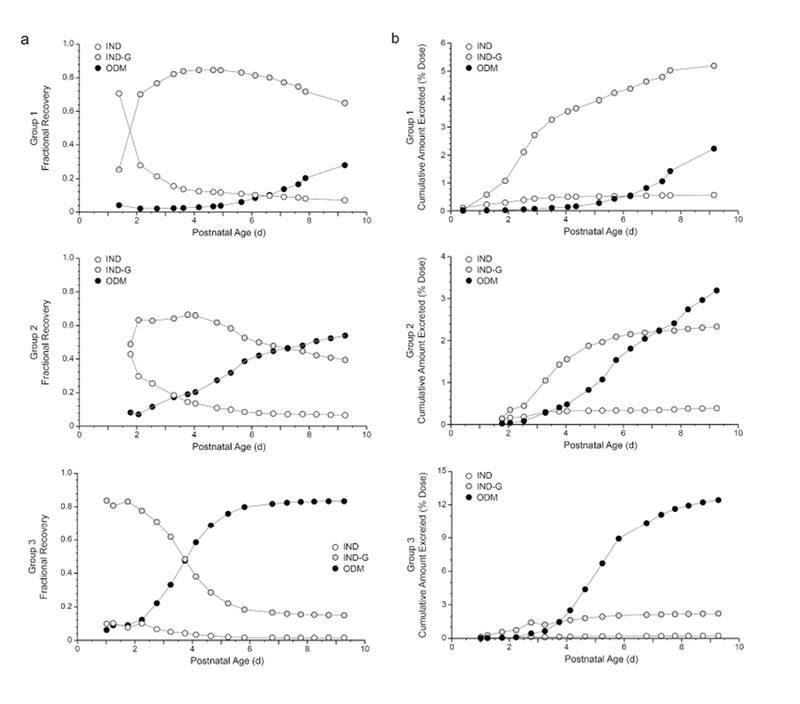
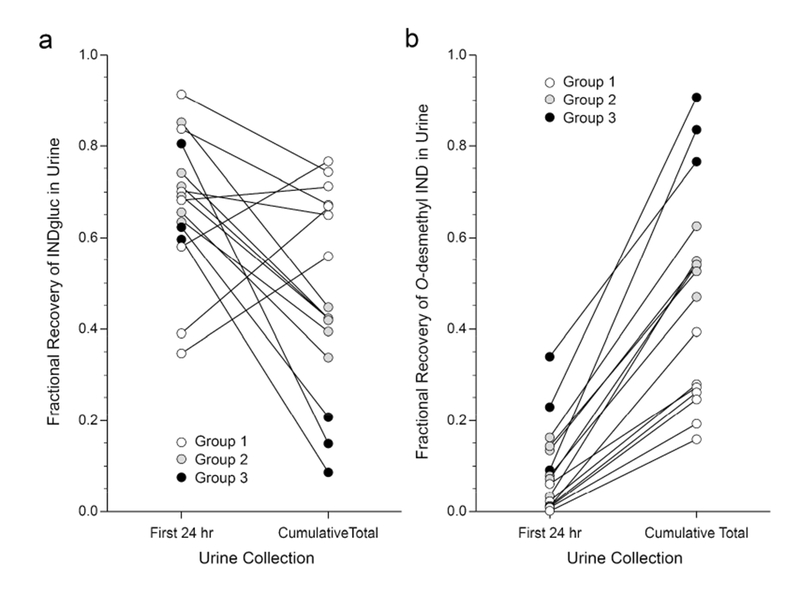
Urine (709 samples) were collected from sixteen preterm infants (birthweight 500- 1290 grams, gestational age 22-29 weeks, postnatal age 3.3 h to 14 d) who received 2-12 intravenous doses of indomethacin (Table 1). Urine recovery was predominated by three indomethacin moieties: unchanged indomethacin (IND), Indomethacin-glucuronide (IND-G) and O-desmethylindomethacin (ODM). Among the population, ODM formation was delayed relative to IND-G, and three distinct patterns of metabolite recovery were observed. Figure 1 displays three representative preterm infants from each pattern. Group 1 has a primary recovery of glucuronide metabolite. Both metabolites are excreted in Group 2, but demethylation is delayed. Group 3 displays robust ODM excretion, consistent with increased formation. Furthermore, the pattern of metabolite recovery 24 hours after the first dose does not represent the contribution of competing pathways when the infant is more mature (Figure 2).
Table 1:
Demographic Characteristics of Preterm Infants by Metabolic Group
| Group 1 (N=7) | Group 2 (N=6) | Group 3 (N=3) | ||
|---|---|---|---|---|
| Median (range) | Median (range) | Median (range) | P* | |
| Gestational Age | 26.1 (22.4 - 27.4) | 26.1 (24.6 - 27.3) | 27.1 (25.5 - 29.5) | 0.44 |
| Birthweight (kg) | 0.82 (0.5 - 1.29) | 0.72 (0.53 - 1.20) | 0.87(0.85 - 1.16) | 0.31 |
| Gender (M/F) | 6/1 | 6/0 | 2/1 | 0.38 |
| Race | 0.82 | |||
| Caucasian | 3 | 1 | 2 | |
| African American | 3 | 5 | 0 | |
| Other | 1 | 0 | 1 | |
| PNA First Dose (hrs) | 5.9 (3.5 – 9.8) | 6.27 (4.47-335.4) | 7.95 (3.3-236.2) | 0.84 |
Continuous variables were compared using Kruskal-Wallis tests, categorical variables using Mann-Whitney U test
Figure 1:

Patterns of indomethacin (IND), indomethacin glucuronide (IND-G) and O-desmethylindomethacin (ODM) cumulative excretion in urine over time expressed as the recovery of each analyte as a fraction of the total cumulative recovery of all three analytes at a given point in time (a), and as a percentage of the administered dose (b). Profiles for infants representative of the three patterns of excretion observed are placed adjacent to each other. The relative contribution of direct glucuronidation decreases as ODM formation increases, and group assignment appears to reflect the rate of ODM excretion (primarily as the glucuronide conjugate).
Figure 2:

The fraction of total indomethacin and metabolite excreted in urine as indomethacin glucuronide (a) and O-desmethyl-indomethacin (b) in urine collected for 24 hours after drug dosing does not reflect the relative contributions of the competing elimination pathways observed later in life when the course of treatment is completed. Group assignment based on metabolite excretion patterns are more readily apparent from total cumulative urine recoveries upon completion of treatment, and are not readily apparent with short term collection periods earlier in life. White circles represent the Group 1 presented in Figure 1, whereas grey circles and black circles represent Groups 2 and 3, respectively.
The percentage of total IND dose recovered was higher in the high ODM group (35.7%) compared to the other groups (7.7% and 7.2%), and associated with postnatal age (PNA) at the end of urine collection (r2=0.497; p=0.002). There were no statistically significant differences in demographics between the three metabolic groups, but infants in Group 3 (high ODM excretions) tended to be older in gestational age and postnatal age. In addition, Group 2 was majority African-American. None of the infants were concomitantly treated with drugs which induce (phenobarbital, rifampin) or inhibit (fluconazole) the major indomethacin metabolic enzymes. There was one infant who failed to close their PDA and required surgical ligation in Group 3. There was one infant diagnosed with severe IVH (Grade IV) in Group 2.
Discussion
Changes in the relative contributions of competing biotransformation pathways over time will not be captured by sampling strategies limited to the first 24 hours after treatment begins. Although labor-intensive, the data collected from longitudinal designs provide valuable new insights into the developmental changes occurring over a course of treatment and should be considered in the design of future drug studies in this population. The observation of distinct developmental patterns for indomethacin clearance pathways implies that different dosing strategies may be required. Development of dosing models incorporating changes in fractional contribution of various metabolic pathways over time will allow for individualized patient dosing. If an individual patient’s indomethacin dose is simulated a-priori with this model, and subsequently refined by a urine or plasma sample, this may lead to more predictable drug exposure, efficacy and toxicity profiles in preterm infants treated with indomethacin for patent ductus arteriosus.
Acknowledgments
Financial Support: This work was supported by 1 U54 HD090258-01 from NICHD.
Footnotes
Disclosure Statement: There are no conflicts to disclose from any of the authors.
References
- 1.Kearns GL, Abdel-Rahman SM, Alander SW, Blowey DL, Leeder JS, Kauffman RE 2003. Developmental Pharmacology – Drug Disposition, Action, and Therapy in Infants and Children. New England Journal of Medicine 349:1157–1167. [DOI] [PubMed] [Google Scholar]
- 2.Smyth JM, Collier PS, Darwish M, et al. JC 2004. Intravenous indometacin in preterm infants with symptomatic patent ductus arteriosus. A population pharmacokinetic study. Br J Clin Pharmacol 58:249–258. [DOI] [PMC free article] [PubMed] [Google Scholar]
- 3.Mano Y, Usui T, Kamimura H 2007. Contribution of UDP-glucuronosyltransferases 1A9 and 2B7 to the glucuronidation of indomethacin in the human liver. Eur J Clin Pharmacol 63:289–296. [DOI] [PubMed] [Google Scholar]
- 4.Nakajima M, Inoue T, Shimada N, Tokudome S, Yamamoto T, Kuroiwa Y 1998. Cytochrome P450 2C9 catalyzes indomethacin O-demethylation in human liver microsomes. Drug Metab Dispos 26:261–266. [PubMed] [Google Scholar]
- 5.Kokki M, Heikkinen M, Valitalo P, et al. 2017. Maturation of oxycodone pharmacokinetics in neonates and infants: Oxycodone and its metabolites in plasma and urine. Br J Clin Pharmacol 83:791–800. [DOI] [PMC free article] [PubMed] [Google Scholar]
- 6.Krekels EH, van Ham S, Allegaert K, et al. 2015. Developmental changes rather than repeated administration drive paracetamol glucuronidation in neonates and infants. Eur J Clin Pharmacol 71:1075–1082. [DOI] [PMC free article] [PubMed] [Google Scholar]


