Abstract
Purpose
To construct a predictive model that describes how the duration and symmetry of a k-space weighted image contrast (KWIC) window affects the temporal resolution of differently sized ultrasound foci when using a pseudo-golden angle stack-of-stars (SOS) acquisition.
Methods
We performed a modulation analysis of proton resonance frequency (PRF) temperature measurements to create the temporal modulation transfer function (tMTF) for KWIC windows of different symmetry and temporal duration. We reconstructed simulated ultrasound heating trajectories and SOS k-space data as well as experimental phantom data using the same trajectories. Images were reconstructed using symmetric and asymmetric KWIC windows of three different temporal durations. Simulated results were compared against tMTF predictions, experimental results, and the original simulated temperatures.
Results
The tMTF shows that temporal resolution with KWIC reconstructions depend on the object size. KWIC window duration affected SNR and severity of undersampling artifacts. Accuracy and response delay improved as the KWIC window duration decreased or the size of the heated region within the KWIC plane increased. Precision worsened as the window duration decreased. Using a symmetric window eliminated the response delay to heated region size but introduced a large reconstruction delay.
Conclusion
The accuracy and precision of PRF temperature measurements from a SOS acquisition using a sliding KWIC window reconstruction are dependent upon the size of the KWIC window and the size and shape of the heated region. The tMTF of KWIC reconstructions for any object size can predict the temporal response to changes in signal being acquired – temperature, contrast enhancement, etc.
Keywords: MRgFUS, Thermometry, MRTI, Stack of Stars, KWIC
INTRODUCTION
Stack-of-stars (SOS) sequences have several advantages when measuring rapidly changing tissue attributes, such as temperature. By frequently sampling the center of k-space, SOS sequences perform well with high levels of undersampling, are more robust to motion, and have the ability to correct respiration artifacts through self-navigation (1,2). Using a golden angle projection increment and a sliding data inclusion window enables image reconstruction at arbitrary time points. A golden angle projection increment guarantees an optimal projection angle distribution for any arbitrary number of projection angles. Many historical challenges to implementing non-Cartesian sampling trajectories, such as off-resonance artifacts (3), gradient timing errors (3-6), and gridding reconstruction time (7,8), have been largely overcome.
We recently published a volumetric magnetic resonance temperature imaging (MRTI) method using a multi-echo pseudo golden angle stack of stars sequence with dynamic k-space weighted image contrast (KWIC) (1). Effective temporal resolutions of 1.4 to 2.8 s were achieved. Dynamic KWIC reconstructed images have high spatial resolution, although it was noted that the temporal resolution of the heated region will depend on the KWIC window attributes and the size (spatial extent) of the focus. In order for the KWIC reconstruction technique to be more widely applied, a predictive model is needed to show how the focal size and KWIC window will affect image quality, particularly temporal resolution. Given this model, researchers and clinicians would then be able to adjust parameters such as window duration, expected reconstruction or acquisition time, etc. in order to achieve images with optimal resolution for the task. In this paper, we describe our experimental solution to arrive at this predictive model and allow for a more controlled application of KWIC reconstruction.
KWIC reconstruction shows promise for examining a multitude of rapidly changing tissue properties like temperature or dynamic contrast enhancement, although it has been most recently applied successfully to MRTI. MRTI has been used to monitor several types of thermal therapies including radiofrequency, microwave, laser and MR-guided focused ultrasound (MRgFUS). To ensure treatment safety and efficacy, it is desirable that MRTI be able to monitor the entire heated tissue volume with enough temporal resolution to accurately follow the most rapid temperature changes. Different thermal therapy modalities pose different challenges in terms of the needed coverage and acquisition speed. MRgFUS is especially challenging because the ultrasound often traverses a large volume of normal tissue before being focused to a point where rapid heating occurs. Thus, ideally, for MRgFUS, MRTI would monitor the focus and the near field with full coverage and high temporal resolution.
MRgFUS has been used to noninvasively treat breast, prostate, liver and brain cancers as well as essential tremor and Parkinson’s disease (9-18). Currently, clinical monitoring of MRgFUS employs a discrete number of 2D slices providing a limited field of view. There have been several successful implementations of fully 3D thermometry methods (1,2,19-25). Two recent techniques used a hybrid radial-Cartesian pulse sequence that acquired a 3D stack of stars (SOS) k-space trajectory (1,25). Jonathan et al (25) combined echo planar imaging (EPI) in the slice direction with a golden angle SOS trajectory to allow rapid acquisition of volumetric brain SOS data. They compared two different compressed sensing reconstruction techniques to acquire reported temporal resolutions from 0.75 to 3 s and were able to acquire whole brain coverage (188x188x43 image matrix at 1.5x1.5x2.75 mm resolution). They noted that KWIC reconstructions could be applied instead of compressed sensing.
The KWIC window creates rings of k-space where each ring has a different temporal footprint. In general, the inner rings are fully updated more rapidly than the outer rings – and the full update rate decreases with increasing radius. Each ring represents object detail within a size range that is inversely related to the radius of the ring. With a dynamic sliding KWIC window, all data is updated at the same rate, but large object detail, which is represented primarily in the central rings, has the highest temporal resolution, while smaller finer details have a lower temporal resolution.
The ability of KWIC to accurately monitor temperature will depend on the duration (in time) and distribution (where the center of k-space is sampled and how many projections occur in each ring) of the KWIC window and the size and shape of the region of temperature change. The duration and distribution of the sliding KWIC window will determine the temporal impulse response to change and can be adjusted to meet different functional requirements of the temperature monitoring. The KWIC window used in (1) was asymmetric, placing the center of k-space at the end of the temporal window, but a symmetric window can also be used.
In this work, we investigated the effects of MRTI reconstruction with symmetric and asymmetric KWIC windows on the accuracy (temporal blurring) of measured PRF temperature change. For generalization, we developed a temporal modulation transfer function (tMTF) analysis for KWIC reconstructions as a function of heated region size. tMTF models were used to predict measurements obtained with simulated MRgFUS sonications with three different ultrasound trajectories. The simulated and experimental k-space data of each MRgFUS trajectory were reconstructed with varying KWIC window durations and distributions. The temperature versus time curves for the simulated and experimental measurements were compared to truth for the simulated data and to a simulated FUS heating with the same power for the experimental data for each KWIC window duration and distribution. The temperature versus time predictions made from the tMTF analysis were compared to the simulated and experimental data. While this work focuses on temperature monitoring, the results can be generalized to other applications where dynamic images of changing object detail are reconstructed using the KWIC algorithm (26).
METHODS
MRgFUS Simulation
The propagation of ultrasound from a breast-dedicated focused ultrasound transducer (27) into a gelatin phantom with the acoustic (speed of sound = 1553 m/s, density = 1057 kg/m3, attenuation = 0.062 Np/cm/MHz) and thermal (specific heat capacity = 3635 J/kg/°C, thermal conductivity = 0.549 W/m/°C, perfusion = 0 kg/m3/s) parameters described in (28) was modeled with 0.4-mm isotropic resolution and 181x181x240 matrix size using the hybrid angular spectrum method (29) with three different ultrasound trajectories (see Figure 1). The geometric focus was placed in the center of the simulated phantom. Multi-point trajectories were modeled as being simultaneously sonicated where each location received an equal fraction of the total power. Single point (Figure1a), circular (2 mm radius, 5 points, Figure 1b) and linear (8 mm length, 5 points, Figure 1c) trajectories were sonicated with 24, 42, and 54 total acoustic Watts, respectively. Simulated heating (30 s) and cooling (30 s) data were calculated for each trajectory using a finite-difference time-domain solver (dt = 100 ms) of the Pennes bioheat transfer model (30). Simulated temperature data were then downsampled to 1.2-mm isotropic resolution by taking the Fourier transform, cropping the data, and performing the inverse Fourier transform.
Figure 1.

Coronal (top left), sagittal (bottom left) and transverse (top right) simulated temperature maps after 30 s of ultrasound heating for a) a single focus with 32 acoustic Watts, b) 5 focal points in a circle with 56 total acoustic Watts and c) 5 focal points in a line with 56 total acoustic Watts. The electronic steering focus pattern, as seen in the transverse view, is shown in the bottom right, and the spacing between focus locations is 2 mm. The displayed focus pattern is not at the same scale as the images.
K-Space Simulation
The image domain used to create the simulated k-space was a uniform box with value one and size 120x120x16 mm. A uniform box was chosen to reduce the effects of radial undersampling (streaking) in order to isolate the effects of KWIC window duration and focus size. k-Space data for each ultrasound heating and cooling were simulated on a TR basis for a rotated SOS (RSOS) sequence (31) with an in plane pseudo-golden angle increment of θ = (1-233/377)*180° ≈ 68.753°, and rotation angle between slice partitions of φ=θ/Nz, where Nz is the total number of slice partitions. For the simulation TE/TR = 7.5/10 ms, field of view = 384x384x19.2 mm, matrix = 320x320x16, yielding 1.2 mm isotropic voxels. The projection angle for the jth radial spoke in the kth partition was therefore (j-1)θ + (k-1)φ. Projections were acquired for all partitions before incrementing j to the next spoke. The phase distribution of the box was adjusted each TR based on the PRF temperature change distribution, , using , where is the phase, γ is the gyromagnetic ratio, α is the PRF change coefficient of −0.01 ppm/°C, and B0 is the magnetic field strength (32). For the TRs between the simulated FUS time points, the temperature distribution was linearly interpolated between the two nearest time points. The image was then converted to a full RSOS k-space using gpuNUFFT (8) and only the radial projection corresponding to the TR was kept. This was repeated for a total of 6000 TRs to cover the entire simulated heating and cooling. Baseline (before heating) k-space was also simulated before the heating for 377*16*2=12064 TRs. Complex white Gaussian noise was then added to the simulated k-space using MATLAB’s wgn function with a power of −5 dBW. The noise power level was empirically selected to give approximately the same noise characteristics as the experimental data.
For comparison, k-Space for a 3D segmented echo planar imaging (seg-EPI) sequence was also simulated using the same ultrasound trajectories on a TR basis with the following imaging parameters (1.2 mm isotropic; TE/TR = 10/20 ms; field of view = 192 × 151.2 × 19.2 mm; matrix = 160 × 126 × 16; EPI Factor = 7; Echo Spacing = 2.1 ms). The field of view in the phase encoding direction was reduced to increase the temporal resolution of the seg-EPI images. Complex white Gaussian noise was also added to the simulated seg-EPI k-space with a power of 30 dBW to give approximately the same noise characteristics as the experimental seg-EPI data.
MRgFUS Experiments
Experiments were performed in a Siemens Prisma 3T MRI scanner (Siemens Healthcare, Erlangen, Germany) using a breast-specific MRgFUS system with an integrated eight-channel RF coil and an MRI-compatible phase array transducer (256 elements, 0.94 MHz frequency, 10cm radius of curvature; Imasonic, Besançon, France and Image Guided Therapy, Pessac, France) (33-35) for comparison with the simulated data. A gelatin phantom (28) was positioned in the breast-specific MRgFUS system such that the ultrasound focus was approximately 5 cm deep in the phantom. An ultrasound absorbing rubber was placed in the phantom container at the back to prevent any interference from ultrasound reflections off the phantom container wall. The 3D RSOS imaging volume was prescribed in a coronal orientation (voxel size = 1.2 mm isotropic; field of view = 192 × 192 × 19.2 mm; matrix = 160 × 160 × 16; 1350 radial projections; flip angle = 10°; TR = 10 ms; TE = ms; readout bandwidth = 1000 Hz/pixel).
The three ultrasound trajectories, sonication powers and total sonication durations used in the simulated k-space data were used for the experiment. Unlike the simulation, the experimental multi-point trajectories cannot sonicate all points simultaneously. Each point was sonicated for 50 ms before moving to the next point and the pattern was repeated for the total 30 s of heating. The phantom was sonicated with the three trajectories while imaging with the stack of stars sequence. For comparison, image sets were acquired during identical sonications using a 3D seg-EPI sequence with the following parameters (voxel size = 1.2 mm isotropic; field of view = 192 × 151.2 × 19.2 mm; matrix = 160 × 126 × 16; flip angle = 20°; TE/TR = 10/25 ms; EPI Factor = 7; Echo Spacing = 2.05 ms; readout bandwidth = 1040 Hz/pixel, acquisition time = 7.2 s).
Image Reconstruction
The simulated (with and without noise) and experimental data were reconstructed using a sliding asymmetrical KWIC window method described in (1). The asymmetric window places the center of k-space at the end of the temporal window, thereby ensuring that the majority of the image information comes from the most recently acquired data. The use of an asymmetric KWIC window is illustrated in Figure 2. The data were also reconstructed using a symmetric KWIC window, where the center of k-space is placed at the center of the temporal window. An example of a symmetric KWIC window is shown in Figure 2e. Images were reconstructed using three different KWIC window durations. Each KWIC window had 13 projections through the center with 144, 233 or 377 total projections in each plane and the sliding window was advanced 13 projections between reconstructed time points. Examples of each of these three KWIC windows is shown in Figure 2f-h. The effective temporal resolution of each reconstructed dataset was 2.08 seconds and the total temporal window was 23.04, 37.28 and 60.32 seconds for the 144, 233 and 377 window durations respectively. The phase information from the multi-echo experiment data were combined using a weighted linear least squares fit, and the multi-channel data were combined using the methods described in (1). PRF temperatures were calculated using the trajectory matched baseline described in (1). An estimate of the SNR was calculated for the noisy simulated data for each KWIC window duration by calculating the spatial standard deviation within the uniform phantom for the first reconstructed time image. All simulations and image reconstructions were performed offline using MATLAB (Mathworks, Natick, MA).
Figure 2.
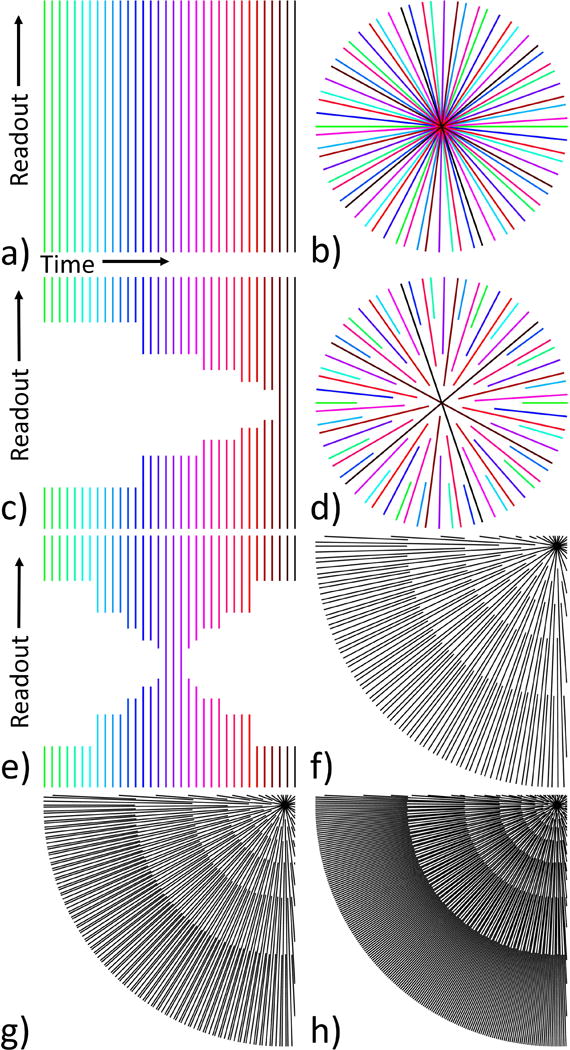
Example of how KWIC increases the effective temporal resolution. a) The projection angle separation between TRs is the pseudo-golden angle. b) Resulting k-space sampling pattern from a. c) Asymmetric KWIC window applied. d) Resulting k-space sampling pattern from c. e) Example of symmetric KWIC window. f-h) Lower left quadrant of a KWIC window with a total of f) 144, g) 233 and h) 377 projections.
Impulse Response / Temporal Modulation Transfer Function
To generalize the observations of this work, the impulse response function (IRF) as a function of KWIC window duration and symmetry and Gaussian object size was estimated by first calculating an estimate of the temporal modulation transfer function (tMTF). RSOS k-space data with the same image FOV and resolution as the earlier simulations were created from symmetric Gaussian distributions in image space defined by with varying FWHM from 2 to 40 mm in 2 mm steps. The tMTF was estimated by modulating the phase along the k-space projection dimension with , where t incremented from 0 to 376, t0 was set to the projection index (time) where the KWIC window passes through the center of k-space, and f was incremented from −40/377 to 40/377 with 0.5/377 stepsize, which is from approximately −660 to 660 mHz with 8.3 mHz stepsize. The modulated k-space was then converted to image space and the complex value at the center of the gaussian was taken as a point of the tMTF. The IRF was then calculated by taking the Fourier transform of the tMTF. The temporal footprint as a function of FWHM was calculated as the time width of IRF values greater than 2% of the maximum. The IRF was also calculated for a 2x8 mm (cigar shape) FWHM gaussian and was then convolved with the temperature versus time curve from the simulated FUS single point sonication. The point spread function (PSF) for gridding reconstructions with and without a KWIC window was also generated.
RESULTS
PRF temperature data overlaid on the magnitude images at the peak temperature time point for each of the KWIC window duration and ultrasound trajectories from the simulated k-space are shown in Figure 3 and from the experimental data in Figure 4. For both the simulation and experiment the ultrasound is propagating from left to right in the coronal images; the ultrasound transducer can be seen at the left in Figure 4. Time lapse videos of the data displayed in Figures 3 and 4 are shown in Supporting Videos S1 and S2. Only temperature changes greater than 1.5 °C are overlaid on the magnitude images in the figures and videos. The smaller KWIC window durations had lower SNR and exhibited undersampling artifacts in both the magnitude and PRF temperatures. The SNR estimates from the asymmetric noisy simulated reconstructions for the 144, 233 and 377 KWIC window durations were 12.9, 21.9, and 31.5, respectively, and for the symmetric reconstructions were 12.8, 21.3 and 31.1, respectively.
Figure 3.
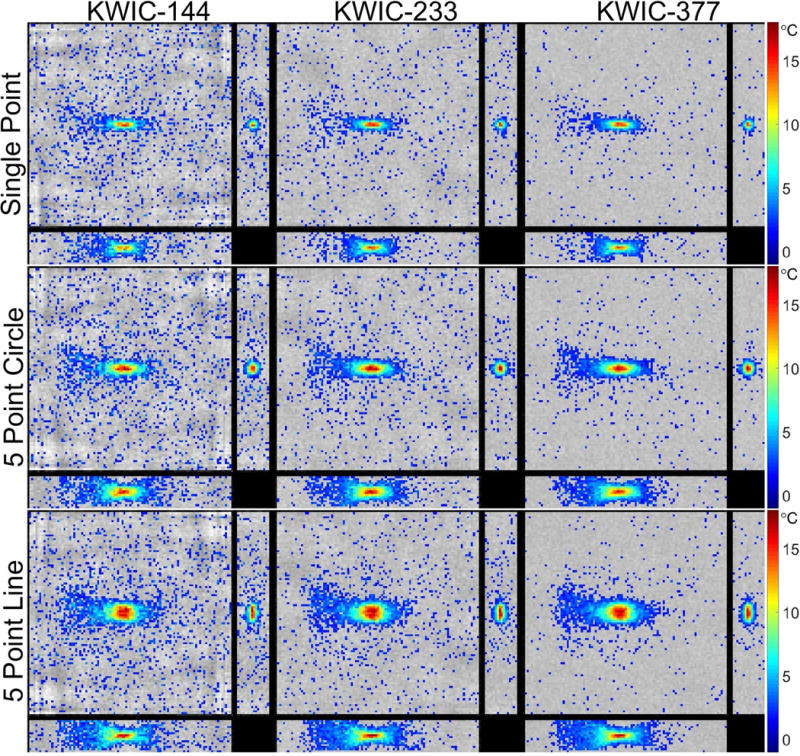
Simulation results: Images of each orthogonal plane through the peak temperature voxel at the time of the peak temperature of the reconstructed simulated data for each ultrasound trajectory and KWIC window duration.
Figure 4.
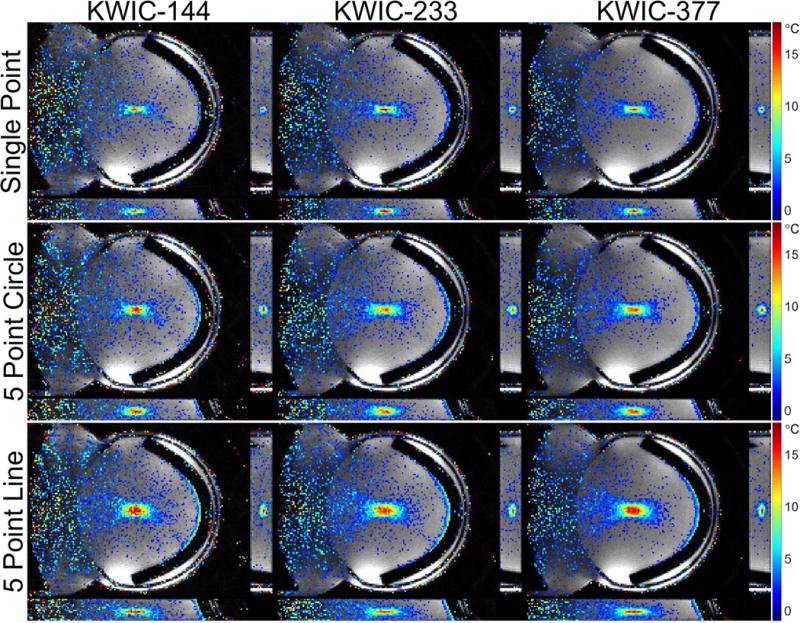
Experimental results: Images of each orthogonal plane through the peak temperature voxel at the time of the peak temperature of the reconstructed experimental data for each ultrasound trajectory and KWIC window duration. The ultrasound transducer is located on the left side of each coronal image and the ultrasound absorbing rubber is located on the right.
Temperature versus time curves of the simulated data (with and without noise) and experimental data that were reconstructed with an asymmetric KWIC window are shown in Figure 5 for the peak temperature voxel of the single point ultrasound trajectory and for each trajectory in Supporting Figure S1. The temperature is plotted at the time when the center of k-space was collected. The same voxel location was used for each KWIC window duration and the location of the peak temperature voxel with the largest KWIC window duration was used. For the single point trajectory, the KWIC window reconstructions of the noise free simulations had both a delayed response to the change in temperature and an underestimation of the peak temperature that increased with window duration. As the size of the heating region in the KWIC plane grew, both the response delay and underestimation of the peak temperature was reduced. Temperature measurements from the 5-point line trajectory provided the most accurate estimate of the peak temperature and had the smallest response delay. For the noisy simulated data, the peak temperature underestimation as a function of KWIC window duration was not as evident, but the response delay was still present. The noise could cause either over or underestimation of the temperature. For example, the reduced SNR from the smaller KWIC window caused the peak temperature in the 5-point circular trajectory to be lower than the larger KWIC windows. Temperature plotted against the time when enough data has been collected to allow reconstruction is shown in Supporting Figure S2, where the shift for each of the KWIC windows is 1.04 s and for the seg-EPI is 3.6 s. The difference from true temperature, at the center of k-space, for each of the asymmetric KWIC windows and trajectories for the simulated data is plotted in Supporting Figure S3. For each trajectory the temperature measurements underestimated the true temperature while the ultrasound was on and overestimated during the cooling. This is mainly due to the delayed response to a change in temperature from the asymmetric k-space selection. The under and overestimation decreased as the size of the heated region in the KWIC plane increased and the duration of KWIC window decreased.
Figure 5.
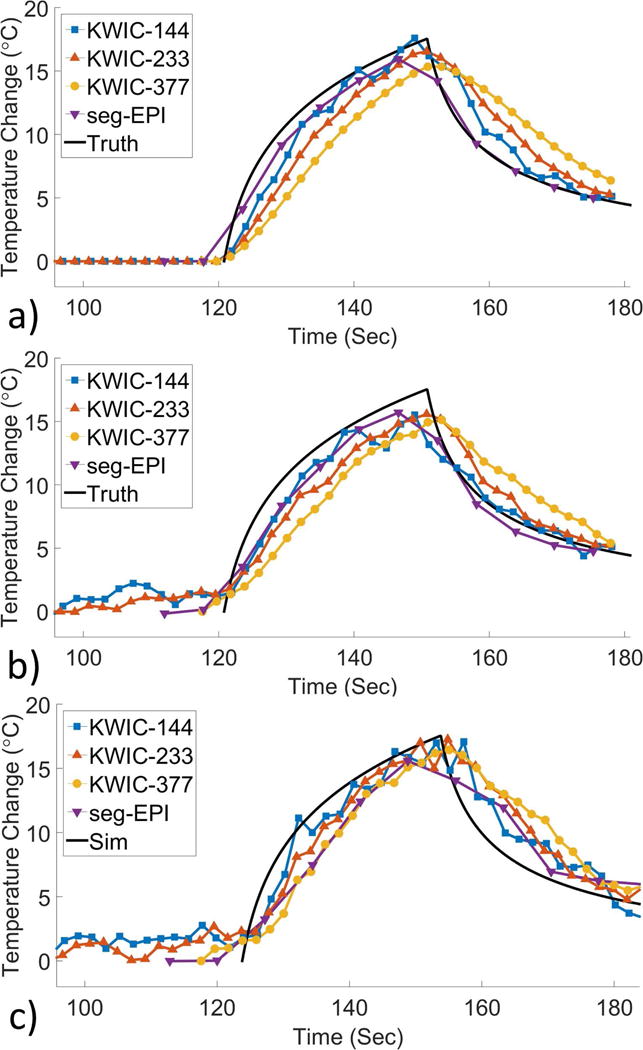
Asymmetric KWIC: Plots of temperature vs time (at the center of k-space) at the peak temperature voxel for each of the KWIC windows and 3D seg-EPI using a) simulated data without noise, b) with noise and c) experimental data for the single point trajectory. Temperature curves for each heating trajectory are shown in Supporting Figure S1.
Temperature versus time of the simulated data (with and without noise) and experimental data that were reconstructed with a symmetric KWIC window are shown in Figure 6 for the peak temperature voxel of the single point ultrasound trajectory and for each trajectory in Supporting Figure S4. The temperature is plotted at the time when the center of k-space was collected. Note that reconstruction with the symmetric KWIC window plotted at the time of the center of k-space nearly eliminates the response delay observed in Figure 5 using the asymmetric KWIC window reconstruction. An exception is seen in the single point trajectory where the temperature begins to rise before the ultrasound is turned on. The symmetric window reconstructions require that cooling data be collected longer in order to accurately reconstruct the entire heating curve. For example, the largest window in the simulated data is unable to fully cover the heating period and fails to begin covering any of the cooling period. Although the symmetric reconstruction shown in Figure 6 more accurately matches the actual temperature than the asymmetric reconstruction of Figure 5, the use of the symmetric KWIC window also requires a large time delay between when the center of k-space is acquired and when the time point can be reconstructed as shown in Supporting Figure S5, where the temperature is plotted at the time when enough data has been acquired to allow reconstruction using a symmetric KWIC window. In these particular cases, the largest KWIC window does not even begin to show temperature increases until after the ultrasound has been turned off. A diagram showing the full latency from sampling and reconstruction time, performed offline, is given in Supporting Figure S6.
Figure 6.
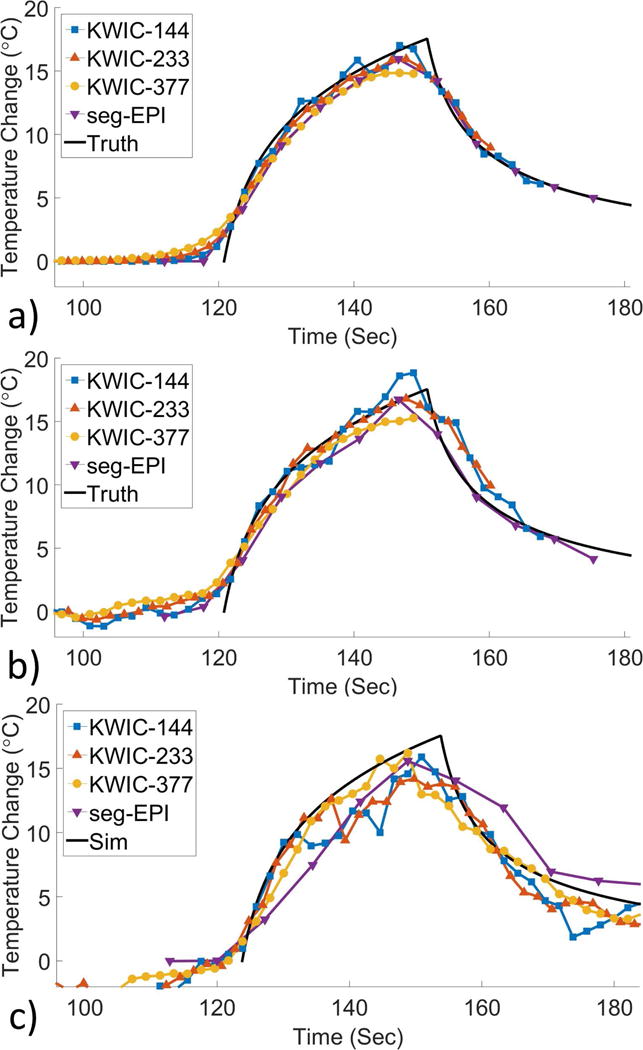
Symmetric KWIC: Plots of temperature vs time in the same format as Figure 5 for each of the symmetric KWIC reconstruction windows and the single point heating trajectory, for 3D SOS and 3D seg-EPI. Temperature curves for each trajectory are shown in Supporting Figure S4.
The tMTF and IRF as a function of Gaussian FWHM for different KWIC durations and symmetry are shown in Figure 7. The IRF narrows as the FWHM increases giving larger objects a higher temporal resolution. The linear nature of the Fourier transform, F(A+B) = F(A) + F(B), and KWIC reconstruction means that an image can have multiple objects with different temporal footprints. The temporal footprint as a function of Gaussian FWHM is shown in Figure 8 and is identical for symmetric and asymmetric KWIC windows. The IRFs for symmetric and asymmetric windows from the 2x8 mm FWHM Gaussian are shown in Figures 9a and b. The convolution of the IRFs with the simulated temperature curve from the single point FUS are shown in Figures 9c and d. The PSF from gridding reconstructions with and without a KWIC window is shown in Supporting Figure S7. The PSFs are nearly identical within the central region.
Figure 7.
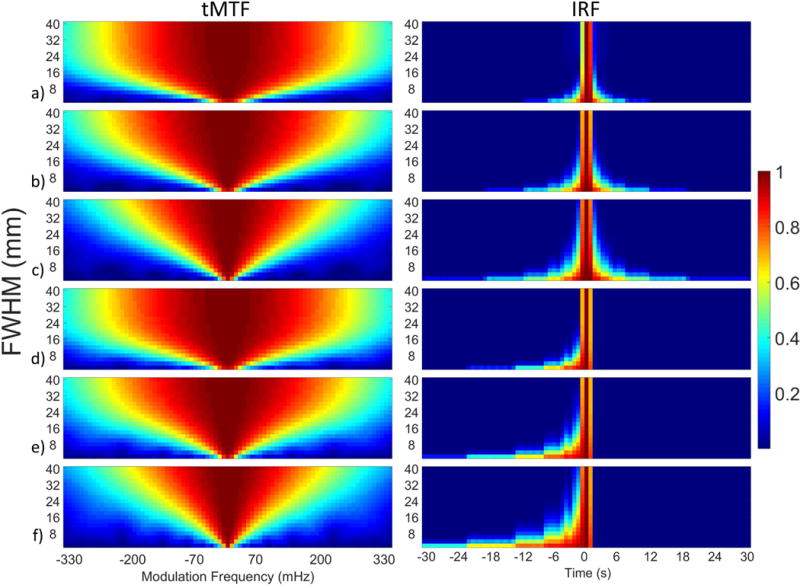
Temporal Modulation Transfer Function (tMTF) (left column) and Impulse Response Function (IRF) (right column) as a function of Gaussian FWHM size using a-c) symmetric and d-f) asymmetric KWIC windows with a,d) 144, b,e) 233, c,f) 377 total projections.
Figure 8.
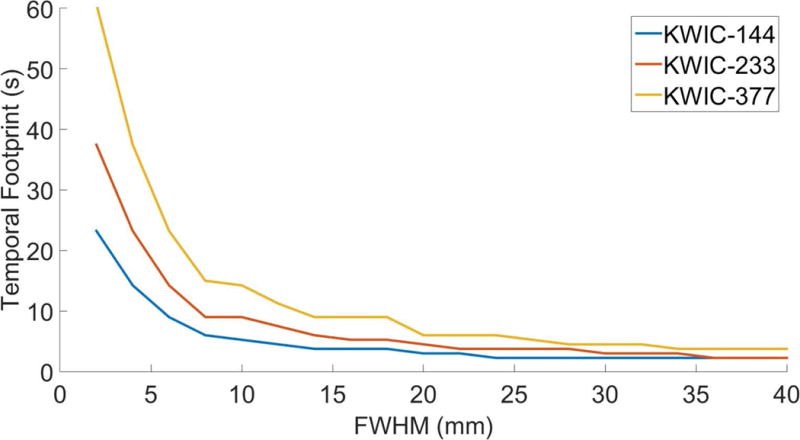
Temporal footprint as a function of Gaussian FWHM for KWIC reconstructions.
Figure 9.
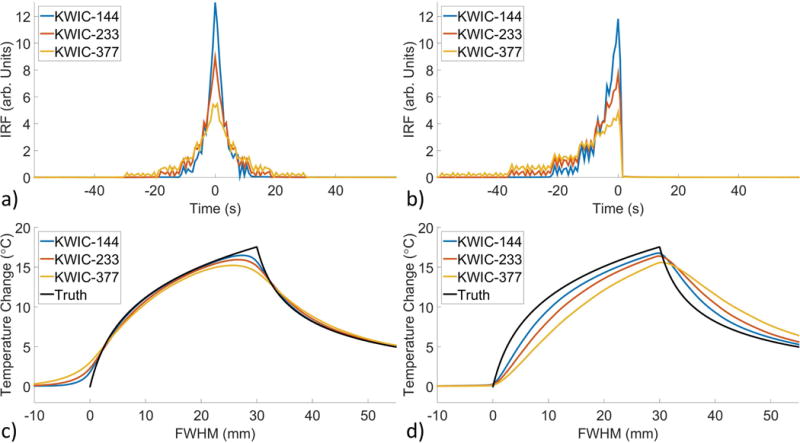
a-b) IRF from a 2x8 mm FWHM Gaussian using a) symmetric and b) asymmetric KWIC windows. c-d) IRF convolved with the temperature change from the single point FUS simulation using the c) symmetric and d) asymmetric IRF.
There did not appear to be a significant difference between the simulated and experimental temperatures achieved for the multi-point trajectories. The simulated multi-point trajectories sonicated at each point simultaneously with an equal fraction of the total power, while the experimental trajectories sonicated one location at a time with the full power while switching between points every 50 ms. If the sonication duration at each point was longer before switching to the next point, differences between the simulated and actual temperature distributions would likely increase, and equivalency would not be guaranteed.
DISCUSSION
This paper describes how a modulation transfer function analysis of the KWIC reconstruction algorithm as a function of heated region size can predict the effects of image reconstruction with asymmetric and symmetric KWIC windows of different durations on temperature measurements obtained using the hybrid 2D Radial 1D Cartesian Stack of Stars acquisition with a pseudo Golden angle view increment. It was demonstrated that the impulse response to a changing object of interest with a KWIC reconstruction is dependent on the spatial extent of the object of interest. Larger objects have a higher temporal resolution as shown in Figure 8. The difference between a fully sampled PSF and a KWIC sampled PSF shows that the KWIC window (Supporting Figure S7) will not significantly affect the image in the spatial domain. These predictions were verified using simulations and experiments of heating with different focal sizes. For the case of the asymmetric KWIC window used in this study, the accuracy (due to temporal blurring and response delay) and precision (due to SNR and undersampling artifacts) of PRF temperature measurements from SOS sampling patterns that are reconstructed with a sliding asymmetric KWIC window are affected by both the duration of the KWIC window and the size and shape of the heated region. The noiseless simulated reconstructions demonstrated that temperature error due to the response delay and underestimation of the peak temperature increased as the asymmetric KWIC window duration increased and/or the size of the heated region in the KWIC plane decreased. When noise is taken into account, the smaller KWIC windows had a lower SNR, which affected the precision of the temperature measurements. There did not appear to be any bias for over or underestimation in the measured PRF temperature with KWIC reconstruction after noise was added to the simulations.
The accuracy of PRF temperatures from the asymmetric KWIC reconstruction method is primarily affected by the size (spatial extent) of the ultrasound focus in the KWIC plane while the precision is primarily affected by the duration (in time) of the KWIC window. As the spatial extent of the heated region increases in the KWIC plane, more of its information/energy is located in the central regions of k-space. The KWIC reconstruction provides the highest temporal resolution to the largest object detail in the central ring of k-space. Smaller object details are updated at the same rate with the sliding window but will have a lower temporal resolution. Lowering the total number of projections in the KWIC window will increase the temporal resolution of each KWIC ring, but it will also lower the SNR due to increasing the amount of undersampling. The reduced precision due to smaller KWIC windows and reduced accuracy due to smaller focus sizes, could be improved using a compressed sensing (36) or model predictive filtering (MPF) technique (37) where constraints based on known or assumed tissue properties are added to regularize the reconstruction. Although the MPF method is fast and non-iterative, compressed sensing methods are generally iterative and would likely only be feasible for retrospective reconstructions due to the increased reconstruction time. Decreasing the imaging FOV while maintaining the spatial resolution will lower the amount of radial views to meet the Nyquist limit and allow smaller KWIC windows without suffering undersampling artifacts.
The simulation and experiments both demonstrated that temperature data reconstructed using a symmetric KWIC window centered at the time of the k-space center provided a more accurate temperature versus time profile. However, near real-time monitoring is not feasible because of the delay required to collect all of the data points before reconstruction can be performed, as shown in Supporting Figure S5. Each symmetric window had a very large delay from when the center of k-space was collected to when enough data had been collected to allow reconstruction, which renders it less useful for real-time temperature monitoring.
These observations on dynamic image reconstruction using the asymmetric and symmetric KWIC windows and the effects of different window durations lead to various implementations that can be adjusted to meet the different functional requirements of the temperature monitoring. During actual treatments when real-time monitoring is needed, the latency of reconstruction time becomes a concern and an asymmetric KWIC window provides the most recent information. At longer delays, when measurements could be analyzed to assess treatment outcomes the same data can be reconstructed with a symmetric KWIC window. The complete reconstruction would be a combination of the asymmetric window reconstruction for near real-time monitoring and a retrospective reconstruction with a symmetric window for a more accurate assessment of energy deposition. A symmetric window requires much more cooling data to fully reconstruct the entire temperature profile vs time. For situations where speed is important but some latency is allowed, it would be possible to reconstruct using a partially symmetric KWIC window for real-time monitoring, though this would add a delay between when the center is acquired and reconstruction. The improvement obtained by adding some symmetry to the end of the window would need to be weighed against the added delay to the monitoring and was not examined in this work. Improvements that might be obtained from iterative (compressed sensing) and non-iterative (MPF) reconstruction methods are anticipated but not examined in this work.
The measured temperature changes from the KWIC reconstructions were comparable to a 3D seg-EPI sequence for both the simulated and experimental data. The temporal resolution of the 3D seg-EPI can cause it to underestimate the peak temperature as seen in Figure 5, while the sliding KWIC window allows for arbitrary time point reconstruction. The seg-EPI acquisition will also have a delay between when the center is acquired and reconstruction is possible, in this case 3.6 seconds, and as shown in Supporting Figure S2, this delay would put the seg-EPI sequence on par with some of the KWIC windows and heated region sizes in its ability to offer near real-time feedback.
Finally, the latency due to gridding and reconstruction of the multiple echo images is a concern but decreases with the expected increase in computer performance. KWIC reconstructions do not require iterative techniques and any reconstruction latency is from the efficiency of the gridding algorithm (8). The times given in Supporting Figure S6 were for MATLAB running on a laptop with some hardware speedups. Much faster reconstructions will be possible on commercial reconstruction computers.
CONCLUSIONS
This work used both simulation and experiments to demonstrate that the accuracy and precision of PRF temperature measurements from a SOS acquisition with pseudo-Golden angle view increment using a sliding KWIC window reconstruction are dependent upon both the temporal duration and symmetry of the KWIC window and the spatial size and shape of the heated region. The asymmetric KWIC window, which provides temperature measurements with the shortest latency at the expense of a small decrease in accuracy, is more applicable in real-time monitoring of actual treatments. The symmetric KWIC window, which provides the highest temperature measurement accuracy at the expense of increased latency, is more applicable in delayed evaluation of treatment performance and efficacy. The accuracy primarily depends on the temporal duration of the KWIC window and the spatial extent of the heated region, while the precision depends mainly on the duration of the KWIC window. For an asymmetric KWIC window, the temperature response delay relative to the time of the center of k-space decreases as the KWIC window duration decreases or the object size increases. Thus, for real-time monitoring when short latency is critical, an asymmetric KWIC window using the smallest total number of projections can be selected to place a majority of the object of interest’s k-space distribution within an acceptable temporal resolution subject to limitations on undersampling artifacts and SNR. The temporal footprint and IRF of any object size and shape reconstructed with a KWIC window can be calculated using the tMTF and IRF method demonstrated in this work. Although temperature measurements using the asymmetric KWIC window during FUS heating were comparable to those obtained with a 3D seg-EPI sequence, the sliding KWIC window reconstruction with a (pseudo) golden angle SOS acquisition allows arbitrary time point reconstruction which is not possible with a 3D seg-EPI sequence.
Supplementary Material
Supporting Video S1. Time lapse images of the reconstructed simulated data for each ultrasound trajectory (rows) and KWIC window duration (columns). Only PRF temperature changes greater than 1.5 °C are shown.
Supporting Video S2. Time lapse images of the reconstructed experimental data for each ultrasound trajectory (rows) and KWIC window duration (columns). Only PRF temperature changes greater than 1.5 °C are shown.
Supporting Figure S1. Asymmetric KWIC: Temperature vs time (at the center of k-space) at the peak temperature voxel for each of the KWIC windows and 3D seg-EPI using a,d,g) simulated data without noise, b,e,h) with noise and c,f,i) experimental data for a-c) the single point trajectory, d-f) 5-point circular trajectory and g-i) 5-point line trajectory.
Supporting Figure S2. Data from Supporting Figure S1 where temperatures are plotted at the time when data acquisition has finished.
Supporting Figure S3. Difference from true temperature from Supporting Figure S1 simulated data a,c,e) without noise and b,d,f) with noise for a-b) the single point trajectory, c-d) 5-point circular trajectory and e-f) 5-point line trajectory.
Supporting Figure S4. Symmetric KWIC: Temperature vs time (at the center of k-space) at the peak temperature voxel for each of the KWIC windows and 3D seg-EPI using a,d,g) simulated data without noise, b,e,h) with noise and c,f,i) experimental data for a-c) the single point trajectory, d-f) 5-point circular trajectory and g-i) 5-point line trajectory.
Supporting Figure S5. Data from Supporting Figure S4 where temperatures are plotted at the time when data acquisition has finished.
Supporting Figure S6. Reconstruction latency for symmetric and asymmetric KWIC windows used in this work and reconstructed on a laptop using MATLAB. Reconstruction times using gpuNUFFT (8) can vary significantly depending on the oversampling factor, kernel width, final image size, number of echoes and number of channels.
Supporting Figure S7. PSF from a left) fully sampled pseudo-golden angle SOS with 377 total lines, center) KWIC sampled SOS with 13 central and 377 total lines. Right) Difference between the full and KWIC sample PSFs multiplied by 3.
Acknowledgments
Grant Support: NIH R01 CA172787, R01 EB013433, S10OD018482, Siemens Medical Solutions
References
- 1.Svedin BT, Payne A, Bolster BD, Jr, Parker DL. Multiecho pseudo-golden angle stack of stars thermometry with high spatial and temporal resolution using k-space weighted image contrast. Magn Reson Med. 2017 doi: 10.1002/mrm.26797. [DOI] [PMC free article] [PubMed] [Google Scholar]
- 2.Svedin BT, Payne A, Parker DL. Respiration artifact correction in three-dimensional proton resonance frequency MR thermometry using phase navigators. Magn Reson Med. 2016;76(1):206–213. doi: 10.1002/mrm.25860. [DOI] [PMC free article] [PubMed] [Google Scholar]
- 3.Block KT, Chandarana H, Milla S, Bruno M, Mulholland T, Fatterpekar G, Hagiwara M, Grimm R, Geppert C, Kiefer B, Sodickson DK. Towards Routine Clinical Use of Radial Stack-of-Stars 3D Gradient-Echo Sequences for Reducing Motion Sensitivity. J Korean Soc Magn Reson Med. 2014;18(2):87–106. [Google Scholar]
- 4.Brodsky EK, Samsonov AA, Block WF. Characterizing and correcting gradient errors in non-cartesian imaging: Are gradient errors linear time-invariant (LTI)? Magn Reson Med. 2009;62(6):1466–1476. doi: 10.1002/mrm.22100. [DOI] [PMC free article] [PubMed] [Google Scholar]
- 5.Lee KJ, Paley MN, Griffiths PD, Wild JM. Method of generalized projections algorithm for image-based reduction of artifacts in radial imaging. Magn Reson Med. 2005;54(1):246–250. doi: 10.1002/mrm.20554. [DOI] [PubMed] [Google Scholar]
- 6.Peters DC, Derbyshire JA, McVeigh ER. Centering the projection reconstruction trajectory: reducing gradient delay errors. Magn Reson Med. 2003;50(1):1–6. doi: 10.1002/mrm.10501. [DOI] [PMC free article] [PubMed] [Google Scholar]
- 7.Fessler JA, Sutton BP. Nonuniform fast Fourier transforms using min-max interpolation. IEEE Transactions on Signal Processing. 2003;51(2):560–574. [Google Scholar]
- 8.Knoll F, Scharzl A, Diwoky C, Sodickson D. gpuNUFFT - An Open-Source GPU Library for 3D Gridding with Direct Matlab Interface. Proc Intl Soc Mag Reson Med. 2014:4297. [Google Scholar]
- 9.Kennedy JE, Ter Haar GR, Cranston D. High intensity focused ultrasound: surgery of the future? Br J Radiol. 2003;76(909):590–599. doi: 10.1259/bjr/17150274. [DOI] [PubMed] [Google Scholar]
- 10.Stafford RJ, Hazle JD. Magnetic resonance temperature imaging for focused ultrasound surgery: a review. Top Magn Reson Imaging. 2006;17(3):153–163. doi: 10.1097/RMR.0b013e3180377bc3. [DOI] [PubMed] [Google Scholar]
- 11.Tempany CM, McDannold NJ, Hynynen K, Jolesz FA. Focused ultrasound surgery in oncology: overview and principles. Radiology. 2011;259(1):39–56. doi: 10.1148/radiol.11100155. [DOI] [PMC free article] [PubMed] [Google Scholar]
- 12.Schlesinger D, Benedict S, Diederich C, Gedroyc W, Klibanov A, Larner J. MR-guided focused ultrasound surgery, present and future. Med Phys. 2013;40(8):080901. doi: 10.1118/1.4811136. [DOI] [PMC free article] [PubMed] [Google Scholar]
- 13.Gallay MN, Moser D, Rossi F, Pourtehrani P, Magara AE, Kowalski M, Arnold A, Jeanmonod D. Incisionless transcranial MR-guided focused ultrasound in essential tremor: cerebellothalamic tractotomy. J Ther Ultrasound. 2016;4:5. doi: 10.1186/s40349-016-0049-8. [DOI] [PMC free article] [PubMed] [Google Scholar]
- 14.Jolesz FA. MRI-guided focused ultrasound surgery. Annu Rev Med. 2009;60:417–430. doi: 10.1146/annurev.med.60.041707.170303. [DOI] [PMC free article] [PubMed] [Google Scholar]
- 15.McDannold N, Clement GT, Black P, Jolesz F, Hynynen K. Transcranial magnetic resonance imaging- guided focused ultrasound surgery of brain tumors: initial findings in 3 patients. Neurosurgery. 2010;66(2):323–332. doi: 10.1227/01.NEU.0000360379.95800.2F. discussion 332. [DOI] [PMC free article] [PubMed] [Google Scholar]
- 16.Medel R, Monteith SJ, Elias WJ, Eames M, Snell J, Sheehan JP, Wintermark M, Jolesz FA, Kassell NF. Magnetic resonance-guided focused ultrasound surgery: Part 2: A review of current and future applications. Neurosurgery. 2012;71(4):755–763. doi: 10.1227/NEU.0b013e3182672ac9. [DOI] [PMC free article] [PubMed] [Google Scholar]
- 17.Weintraub D, Elias WJ. The emerging role of transcranial magnetic resonance imaging-guided focused ultrasound in functional neurosurgery. Mov Disord. 2016 doi: 10.1002/mds.26599. [DOI] [PubMed] [Google Scholar]
- 18.Magara A, Buhler R, Moser D, Kowalski M, Pourtehrani P, Jeanmonod D. First experience with MR-guided focused ultrasound in the treatment of Parkinson’s disease. J Ther Ultrasound. 2014;2:11. doi: 10.1186/2050-5736-2-11. [DOI] [PMC free article] [PubMed] [Google Scholar]
- 19.Enholm JK, Kohler MO, Quesson B, Mougenot C, Moonen CT, Sokka SD. Improved volumetric MR-HIFU ablation by robust binary feedback control. IEEE Trans Biomed Eng. 2010;57(1):103–113. doi: 10.1109/TBME.2009.2034636. [DOI] [PubMed] [Google Scholar]
- 20.Fielden S, Zhao L, Miller W, Feng X, Wintermark M, Pauly KB, Meyer C. Spiral-based 3D MR thermometry. Journal of Therapeutic Ultrasound. 2015;3(1):P18. [Google Scholar]
- 21.Kohler MO, Mougenot C, Quesson B, Enholm J, Le Bail B, Laurent C, Moonen CT, Ehnholm GJ. Volumetric HIFU ablation under 3D guidance of rapid MRI thermometry. Med Phys. 2009;36(8):3521–3535. doi: 10.1118/1.3152112. [DOI] [PubMed] [Google Scholar]
- 22.Marx M, Ghanouni P, Butts Pauly K. Specialized volumetric thermometry for improved guidance of MRgFUS in brain. Magn Reson Med. 2017;78(2):508–517. doi: 10.1002/mrm.26385. [DOI] [PubMed] [Google Scholar]
- 23.Marx M, Plata J, Pauly KB. Toward volumetric MR thermometry with the MASTER sequence. IEEE Trans Med Imaging. 2015;34(1):148–155. doi: 10.1109/TMI.2014.2349912. [DOI] [PMC free article] [PubMed] [Google Scholar]
- 24.Todd N, Vyas U, de Bever J, Payne A, Parker DL. Reconstruction of fully three-dimensional high spatial and temporal resolution MR temperature maps for retrospective applications. Magn Reson Med. 2012;67(3):724–730. doi: 10.1002/mrm.23055. [DOI] [PMC free article] [PubMed] [Google Scholar]
- 25.Jonathan SV, Grissom WA. Volumetric MRI thermometry using a three-dimensional stack-of-stars echo-planar imaging pulse sequence. Magn Reson Med. 2017 doi: 10.1002/mrm.26862. [DOI] [PMC free article] [PubMed] [Google Scholar]
- 26.Song HK, Dougherty L. Dynamic MRI with projection reconstruction and KWIC processing for simultaneous high spatial and temporal resolution. Magn Reson Med. 2004;52(4):815–824. doi: 10.1002/mrm.20237. [DOI] [PubMed] [Google Scholar]
- 27.Farrer AI, Almquist S, Dillon CR, Neumayer LA, Parker DL, Christensen DA, Payne A. Phase aberration simulation study of MRgFUS breast treatments. Med Phys. 2016;43(3):1374–1384. doi: 10.1118/1.4941013. [DOI] [PMC free article] [PubMed] [Google Scholar]
- 28.Farrer AI, Odeen H, de Bever J, Coats B, Parker DL, Payne A, Christensen DA. Characterization and evaluation of tissue-mimicking gelatin phantoms for use with MRgFUS. J Ther Ultrasound. 2015;3:9. doi: 10.1186/s40349-015-0030-y. [DOI] [PMC free article] [PubMed] [Google Scholar]
- 29.Vyas U, Christensen D. Ultrasound beam simulations in inhomogeneous tissue geometries using the hybrid angular spectrum method. IEEE Trans Ultrason Ferroelectr Freq Control. 2012;59(6):1093–1100. doi: 10.1109/tuffc.2012.2300. [DOI] [PubMed] [Google Scholar]
- 30.Pennes HH. Analysis of tissue and arterial blood temperatures in the resting human forearm. J Appl Physiol. 1948;1(2):93–122. doi: 10.1152/jappl.1948.1.2.93. [DOI] [PubMed] [Google Scholar]
- 31.Zhou Z, Han F, Yan L, Wang DJ, Hu P. Golden-ratio rotated stack-of-stars acquisition for improved volumetric MRI. Magn Reson Med. 2017 doi: 10.1002/mrm.26625. [DOI] [PMC free article] [PubMed] [Google Scholar]
- 32.Rieke V, Butts Pauly K. MR thermometry. J Magn Reson Imaging. 2008;27(2):376–390. doi: 10.1002/jmri.21265. [DOI] [PMC free article] [PubMed] [Google Scholar]
- 33.Payne A, Merrill R, Minalga E, Vyas U, de Bever J, Todd N, Hadley R, Dumont E, Neumayer L, Christensen D, Roemer R, Parker D. Design and characterization of a laterally mounted phased-array transducer breast-specific MRgHIFU device with integrated 11-channel receiver array. Med Phys. 2012;39(3):1552–1560. doi: 10.1118/1.3685576. [DOI] [PMC free article] [PubMed] [Google Scholar]
- 34.Payne A, Todd N, Minalga E, Wang Y, Diakite M, Hadley R, Merrill R, Factor R, Neumayer L, Parker DL. In vivo evaluation of a breast-specific magnetic resonance guided focused ultrasound system in a goat udder model. Med Phys. 2013;40(7):073302. doi: 10.1118/1.4811103. [DOI] [PMC free article] [PubMed] [Google Scholar]
- 35.Minalga E, Payne A, Merrill R, Todd N, Vijayakumar S, Kholmovski E, Parker DL, Hadley JR. An 11-channel radio frequency phased array coil for magnetic resonance guided high-intensity focused ultrasound of the breast. Magn Reson Med. 2013;69(1):295–302. doi: 10.1002/mrm.24247. [DOI] [PMC free article] [PubMed] [Google Scholar]
- 36.Uecker M, Lai P, Murphy MJ, Virtue P, Elad M, Pauly JM, Vasanawala SS, Lustig M. ESPIRiT–an eigenvalue approach to autocalibrating parallel MRI: where SENSE meets GRAPPA. Magn Reson Med. 2014;71(3):990–1001. doi: 10.1002/mrm.24751. [DOI] [PMC free article] [PubMed] [Google Scholar]
- 37.Todd N, Payne A, Parker DL. Model predictive filtering for improved temporal resolution in MRI temperature imaging. Magn Reson Med. 2010;63(5):1269–1279. doi: 10.1002/mrm.22321. [DOI] [PMC free article] [PubMed] [Google Scholar]
Associated Data
This section collects any data citations, data availability statements, or supplementary materials included in this article.
Supplementary Materials
Supporting Video S1. Time lapse images of the reconstructed simulated data for each ultrasound trajectory (rows) and KWIC window duration (columns). Only PRF temperature changes greater than 1.5 °C are shown.
Supporting Video S2. Time lapse images of the reconstructed experimental data for each ultrasound trajectory (rows) and KWIC window duration (columns). Only PRF temperature changes greater than 1.5 °C are shown.
Supporting Figure S1. Asymmetric KWIC: Temperature vs time (at the center of k-space) at the peak temperature voxel for each of the KWIC windows and 3D seg-EPI using a,d,g) simulated data without noise, b,e,h) with noise and c,f,i) experimental data for a-c) the single point trajectory, d-f) 5-point circular trajectory and g-i) 5-point line trajectory.
Supporting Figure S2. Data from Supporting Figure S1 where temperatures are plotted at the time when data acquisition has finished.
Supporting Figure S3. Difference from true temperature from Supporting Figure S1 simulated data a,c,e) without noise and b,d,f) with noise for a-b) the single point trajectory, c-d) 5-point circular trajectory and e-f) 5-point line trajectory.
Supporting Figure S4. Symmetric KWIC: Temperature vs time (at the center of k-space) at the peak temperature voxel for each of the KWIC windows and 3D seg-EPI using a,d,g) simulated data without noise, b,e,h) with noise and c,f,i) experimental data for a-c) the single point trajectory, d-f) 5-point circular trajectory and g-i) 5-point line trajectory.
Supporting Figure S5. Data from Supporting Figure S4 where temperatures are plotted at the time when data acquisition has finished.
Supporting Figure S6. Reconstruction latency for symmetric and asymmetric KWIC windows used in this work and reconstructed on a laptop using MATLAB. Reconstruction times using gpuNUFFT (8) can vary significantly depending on the oversampling factor, kernel width, final image size, number of echoes and number of channels.
Supporting Figure S7. PSF from a left) fully sampled pseudo-golden angle SOS with 377 total lines, center) KWIC sampled SOS with 13 central and 377 total lines. Right) Difference between the full and KWIC sample PSFs multiplied by 3.


