Abstract
We report a rare example of a mixed-valence iron compound with an FeNNFe core, which gives insight into the structural, spectroscopic, and magnetic influences of single-electron reductions and oxidations. In the new compound, the odd electron is localized as judged from Mössbauer spectra at 80 K and infrared spectra at room temperature, and the backbonding into the N2 unit is intermediate between diiron(I) and diiron(0) congeners. Magnetic susceptibility and relaxation studies on the series of FeNNFe compounds show significant magnetic anisotropy, but through-barrier pathways enable fairly rapid magnetic relaxation.
Graphical Abstract
A new mixed-valence iron-dinitrogen complex has localized valence by IR and Mossbauer spectroscopies, and slow magnetic relaxation.
Both natural and industrial nitrogen fixation use catalysts with multiple iron atoms in their active sites. In nature, nitrogenase enzymes employ mixed-valence FeS clusters to carry out the reduction of N2 with protons and reducing agents under ambient conditions.1,2,3 Industrial nitrogen fixation uses the Haber-Bosch process to combine N2 with H2, and the most common catalyst contains reduced iron that is formed in situ from iron oxide doped with potassium and aluminium.4 The iron atoms in the resulting promoted catalyst have an average oxidation state between 0 and +1.4 We aim to prepare well-characterized small molecules that capture the key properties, such as mixed iron oxidation states and N2 binding.
To date, only a few examples of bridging Fe-N2-Fe complexes in mixed-valent states have been characterized.5 The first example was the complex [LFe-N2-FeL]− (L = PhB(CH2PPh2)3]−) reported by Peters et al., but the valence localization was not established.5a Field and coworkers reported a second example, the mixed-valent iron(II)iron(0) complex [(FeH(PP3))(μ-N2)(Fe(PP3))]+ (PP3 = P((CH2)2P(CH3)2)3), which features an asymmetric ligand environment.5b On the basis of 1H and 31P NMR spectroscopy, it was assigned as Robin-Day Class I where the oxidation states are completely localized.6 Finally, we reported the series of mixed-valent triiron N2 complexes M2[LMe3Fe(N2)]3 (M = K, Rb, Cs; LMe3 = the β-diketiminate ligand 2,4-bis(2,6-dimethylphenylimino)-3-methyl-pent-3-yl), which feature formal iron oxidation states FeIFe02. 5c For these trinuclear complexes, the presence of a single quadrupole doublet in the Mössbauer spectra suggested that the valence is delocalized (Robin-Day Class III) at 80 K. Herein, we report the synthesis of a bimetallic, mixed-valent iron-N2 complex using a bulkier β-diketiminate LMe = 2,4-bis(2,6-diisopropyl-phenyl-imino)-pent-3-yl and show that the valence is localized using Mössbauer and infrared spectroscopies.
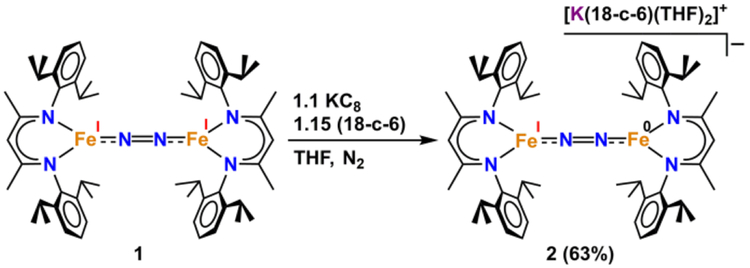
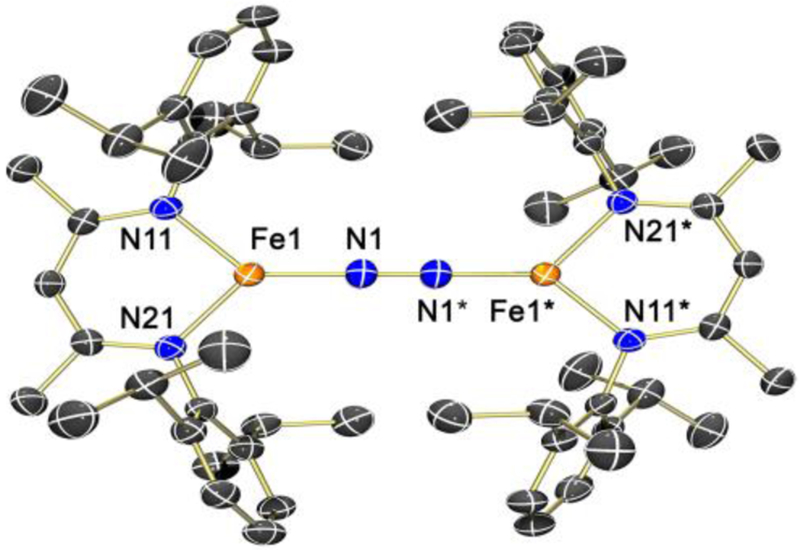
Addition of 1 equiv of potassium graphite (KC8) to a purple solution of LMeFeNNFeLMe (1) and 18-crown-6 (18-c-6) in tetrahydrofuran (THF) resulted in a green mixture. Filtration of this solution through Celite® and vapor diffusion of pentane into the filtrate at −40 °C led to the formation of green crystals of the iron(I)iron(0) dinitrogen complex salt [K(18-c-6)(THF)2][LMeFe(μ-N2)FeLMe] (2) in 63% yield.7 X-ray crystallography of 2 revealed a structure with an N–N distance of 1.186(6) Å, which is significantly longer than that in free N2 (1.09 Å), suggestive of substantial dinitrogen activation (see Figures 1 and 3). A comparison of the core bond distances and angles for 2 to those of the known analogues 1, [K(18-c-6)(12-c-4)]2[LMeFe(μ-N2)FeLMe] (3) and K2[LMeFe(μ-N2)FeLMe] (4) (shown in Figure 2) reveals that the metrical parameters for all four complexes are statistically indistinguishable (Table 1).7
Figure 1.
Synthesis of [LMeFe(μ-N2)FeLMe][K(18-c-6)(THF)2] (2) from the reduction of 1 using KC8 with 18-crown-6.
Figure 3.
X-ray crystal structure of [LMeFeNNFeLMe]− (2) with thermal ellipsoids drawn at the 50% probability level. Orange, blue, and black ellipsoids represent Fe, N, and C atoms, respectively. Hydrogen atoms, a THF molecule of crystallization, and the [K(18-c-6)(THF)2]+ countercation are omitted for clarity. Selected bond distances (Å) and angles (°): Fe(1)–N(1) = 1.744(3); Fe(1)–N(11) = 1.936(2); Fe(1)–N(21) = 1.940(3); N(1)–N(1)* = 1.186(6); N(1)–Fe(1)–N(11) = 131.7(1); N(1)–Fe(1)–N(21) = 128.4(2); N(11)–Fe(1)–N(21) = 98.6(1); N(1)*–N(1)–Fe(1) = 175.2(4).
Figure 2.
ChemDraw representations of the structures of compounds 1–4.
Table 1.
Comparison of structural and spectral parameters for complexes 1–4. Mössbauer spectral parameters were obtained on solid samples at 80 K unless otherwise noted.
| Complex | Formal Ox. State | N–N dist. (Å) | Fe–N2 dist. (Å) | νN–N [ν15N–15N](cm−1) | δ (mm s−1) | |ΔEQ| (mm s−1) |
|---|---|---|---|---|---|---|
| 1 | FeIFeI | 1.186(7) | 1.745(3) | 1810 [1745]a | 0.62b | 1.41c |
| 2 | Fe0FeI | 1.186(6) | 1.744(3) | 1749 [1690] | 0.63 | 1.75 |
| 0.49 | 1.71 | |||||
| 3 | Fe0Fe0 | 1.190(8) | 1.758(4) | 1683 [1632]a | 0.45 | 1.74 |
| 4 | Fe0Fe0 | 1.215(6) | 1.750(4), 1.755(5) | 1625[1566]a | 0.47 | 2.48 |
In the IR spectrum of 2, there is a weak band at 1749 cm−1, which shifts to 1690 cm−1 when 2 is synthesized under 15N2 (Figures S-6 and S-7). This 59 cm−1 shift matches well with the 61 cm−1 shift predicted using a harmonic oscillator model. The νN–N peak for 2 is significantly red-shifted compared to that of free N2 (νN–N = 2359 cm−1),8 consistent with the N–N bond elongation in 2 as characterized by X-ray diffraction, demonstrating substantial reduction of the bound dinitrogen unit. The fact that the N–N stretching mode is observed in the infrared spectrum indicates that the molecule is not centrosymmetric, despite the inversion center in the X-ray crystal structure. In the previously characterized 1, 3, and 4 (as well as alkali-substituted congeners of 4, analogues with larger β-diketiminate ligands, and Co and Ni analogues), the N–N stretching vibrations were infrared silent and thus were measured using resonance Raman spectroscopy.7,9 To our knowledge, the only IR-observable N–N vibrations in dinuclear β-diketiminate-supported MNNM systems have been in compounds with asymmetric cores: a spectroscopically characterized FeNNCo species9b and a NiNNNi species with an asymmetrically coordinated potassium cation.10
Interestingly, complexes 1, 2, and 3 are congeners that span three oxidation states of the diiron core — FeIFeI, FeIFe0 and Fe0Fe0 — with no other differences in the primary coordination environment. The sequential one-electron reductions of the core from 1 to 2 and 2 to 3 lead to bathochromic shifts of the N2 stretch by 61 cm−1 and 66 cm−1 respectively. The red-shifting of the N–N stretch results from the population of d orbitals that backbond into the π* orbitals of the N2 unit, decreasing the bond order of the N–N bond. The series 1–3 is distinctive, because the influence of the metal oxidation states can be discerned without coordinated alkali metal cations. This is important because alkali metal cations4b and other Lewis acids11 can further weaken the N–N bond.
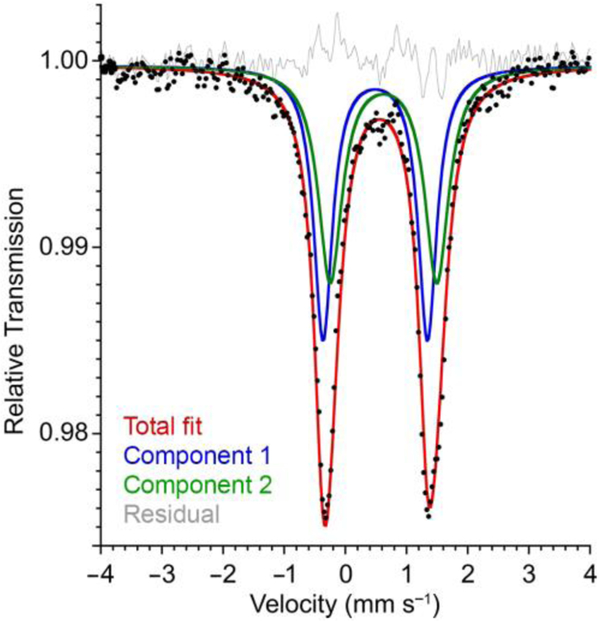
The zero-field Mössbauer spectrum of 2 (Figure 4) is best fit with two overlapping quadrupole doublets of identical intensity. A staggered fit yielded parameters δ1 = 0.48 mm s−1 and |ΔEQ|1 = 1.71 mm s−1 and δ2 = 0.62 mm s−1 and |ΔEQ|2 = 1.75 mm s−1 for the two components (Figure 4; alternate fits shown in Figures S-2 and S-3). The isomer shift for component 1 (δ1) is similar to that in the diiron(I) analogue 1, and δ2 is similar to that in the diiron(0) analogues 3 and 4, supporting the localization of distinct iron(I) and iron(0) sites in 2 (Table 1). An alternative nested fit (Figure S-2) has very similar isomer shift values but different quadrupole splitting, which would not make sense for a delocalized system. Given the similarity of the Mössbauer parameters to very similar diiron(0) and diiron(I) analogues, it is most reasonable to use the staggered fit.
Figure 4.
Zero-field Mössbauer spectrum of solid 2 at 80 K. Fitting to one doublet gave poorer agreement (Figure S-3).
As described above, the previously reported mixed-valent Fe–N2–Fe complexes were assigned as either Robin-Day Class I mixed-valent with full localization5b or Robin-Day Class III with full delocalization down to 80 K.5b,c For 2, the presence of an N2 stretching vibration in the IR spectrum and two doublets in the Mössbauer spectrum together indicate localization of the additional electron on one of the two iron sites. However, the room temperature 1H NMR spectrum of 2 collected in THF-d8 exhibits 8 resonances, with integrations that are most consistent with D2d or D2h symmetry (Figures S-4 and S-5). Therefore, the electron can sample both of the iron sites on the NMR timescale in solution. This is most consistent with Robin-Day Class II mixed valency, though there may be structural differences in solution (see below).6
Using the Evans method, the room-temperature solution magnetic moment of 2 in THF was μeff = 6.6 μB. Solid-state magnetic susceptibility data were also collected using a SQUID magnetometer, and above 50 K, the molar magnetic susceptibility times temperature (χMT) for 2 collected under applied fields of 0.1 – 7 T each approach 7 cm3 K mol−1 above 50 K (Figure S-11), consistent with an overall S = 5/2 ground state. A sextet ground state can be rationalized either with ferromagnetic coupling between high-spin iron(I) (S = 3/2) and high-spin iron(0) (S = 1), or with a FeII–N22−–FeI three-spin model where high-spin iron(II) and iron(I) sites are spin-aligned (SFe = 7/2) and antiferromagnetically coupled to a triplet N22− bridge (SN2 = 1) to give a total S = 5/2 ground state.7,12 The latter model is more compatible with previous computations on compound 1, which predicted an FeII–N22−–FeII core with two high-spin iron(II) sites that are antiferromagnetically coupled to a triplet N22− bridge to give a S = 3 ground state.7,12 These three-coordinate iron(II) sites are known12,13 to have large negative zero-field splitting parameters (D) that suggest the potential for slow magnetic relaxation.14 Accordingly, we sought to further evaluate the magnetization behaviour of the N2–bridged compounds.
The solid-state χMT values of 1, 2, and 4 at room temperature correspond to S = 3, 5/2, and 2 systems, having isotropic g values of 2.38, 2.60, and 2.28. These spin states agree with solution magnetic moments,7,9 and the elevated g values suggest significant spin-orbit coupling. Low temperature magnetization data for 1 and 2 were collected to examine the magnetic anisotropy and the data were fit to a phenomenological zero-field splitting Hamiltonian. The data for 1 could be fit well with multiple sets of parameters and all fits suggested significant axial anisotropy (D = −45 cm−1 from the best fit) as well as significant transverse anisotropy (|E/D| = 0.24 from the best fit). The fit for 2 suggested significantly less axial anisotropy (D = −4.5 cm−1), again with a substantial contribution from transverse anisotropy (|E/D| = 0.29). In contrast, X-band EPR spectra collected from a frozen 50:1 mixture of THF/2-methylTHF at 4.2 K exhibit several signals from S = 5/2 states with positive D, D >> hν (microwave quantum), with the majority form having E/D = 0.097 (Figure S-24). This difference in the sign of D from the solid-state susceptibility measurements indicates a change in the electronic structure in frozen solution, possibly caused by interactions with the solvent.
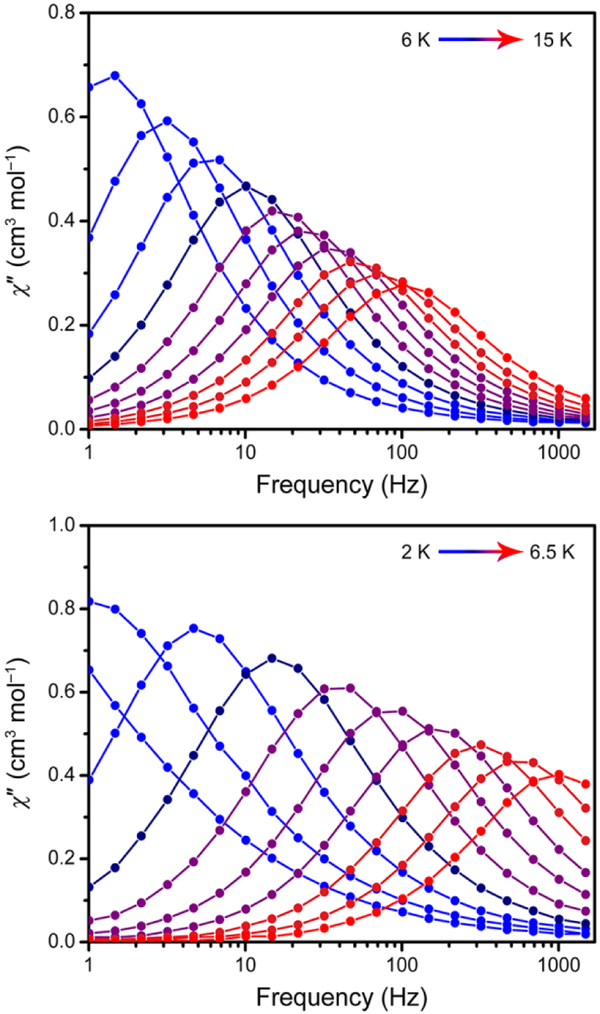
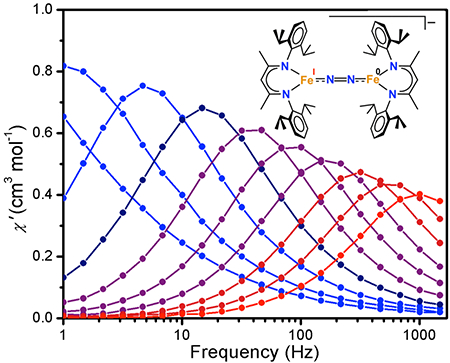
Given the evidence of magnetic anisotropy in both 1 and 2 from the dc susceptibility measurements, we collected ac magnetic susceptibility data to probe for slow magnetic relaxation. For 1, 2, and 4, non-zero signal was observed in the out-of-phase magnetic susceptibility (χ″) at the highest frequencies. However, in each case a small bias field was required to see fully resolved peaks within the measured frequency range of 1–1500 Hz (see Figure 5 for the data for 1 and 2), consistent with systems having both axial and transverse anisotropy. Temperature-dependent magnetic relaxation times (τ) were extracted for 1 and 2 from Cole-Cole fits to the in- and out-of-phase magnetic susceptibility data (the peaks for 4 were too broad for further analysis). Plots of the natural log of τ versus temperature for 1 and 2 are shown in Figures S-14 and S-18, respectively, and the pronounced curvature in both sets of data indicate that thermally-activated Orbach relaxation is not dominant over the entire measured temperature and frequency range. However, a linear fit to the high temperature data gives lower limits for the spin-reversal barriers, Ueff, and upper limits for the attempt times, τ0. For 1 these limits are Ueff ≥ 56 cm−1 and τ0 ≤ 6.8 × 10⁻⁶ s, and for 2 they are Ueff ≥ 27 cm−1 and τ0 ≤ 3.6 × 10⁻⁷ s. Thus, although both of these multinuclear systems exhibit significant magnetic anisotropy, their relaxation behavior is very similar to typical mononuclear single-molecule magnets, in that both sets of complexes are strongly affected by through-barrier pathways.
Figure 5.
(Top) Out-of-phase (χ″) magnetic susceptibility data for solid LMeFeNNFeLMe (1) collected under a 500 Oe dc field over temperatures ranging from 6 to 15 K. (Bottom) Out-of-phase magnetic susceptibility data for solid [K(18-c-6)][LMeFeNNFeLMe] (2) collected under a 1000 Oe dc field over temperatures ranging from 2 to 6.5 K. Solid lines are guides for the eye. In-phase (χ′) magnetic susceptibility and additional magnetic data are shown in the ESI.
In conclusion, we have described the preparation and characterization of the mixed-valent diiron compound [K(18-c-6)(THF)2][LMeFe(μ-N2)FeLMe], which contains a rare example of an N2–bridged complex that can be analyzed in several oxidation levels that vary by one electron.15 Probing the electronic structure and magnetism in greater detail will be the basis for interesting future studies.
Supplementary Material
Acknowledgements
We thank the National Institutes of Health (GM-065313 to PLH, GM-114787 to SFM), the Humboldt Foundation (Bessel Fellowship to PLH), and the National Science Foundation (MCB 1515981 to BMH, CHE-1800252 to JRL). We thank Dr. Katie R. Meihaus for critical feedback on the manuscript, and Eckhard Bill (Max Planck Institute for Energy Conversion, Mülheim an der Ruhr, Germany) for additional applied-field Mössbauer experiments.
The crystal structure of 2 has been deposited with the CCDC with accession code 1866500.
Footnotes
Electronic Supplementary Information (ESI) available: [details of any supplementary information available should be included here]. See DOI: 10.1039/x0xx00000x
Conflicts of interest
There are no conflicts to declare.
Notes and references
- 1.Burgess BK and Lowe DJ, Chem. Rev, 1996, 96, 2983–3012. [DOI] [PubMed] [Google Scholar]
- 2.(a) Hoffman BM, Lukoyanov D, Yang Z-Y, Dean DR and Seefeldt LC, Chem. Rev, 2014, 114, 4041. [DOI] [PMC free article] [PubMed] [Google Scholar]; (b) Hoffman BM, Lukoyanov D, Dean DR and Seefeldt LC, Acc. Chem. Res, 2013, 46, 587. [DOI] [PMC free article] [PubMed] [Google Scholar]
- 3.(a) Spatzal T, Schlesier J, Burger E-M, Sippel D, Zhang L, Andrade SLA, Rees DC and Einsle O, Nat. Commun, 2016, 7, 10902. [DOI] [PMC free article] [PubMed] [Google Scholar]; (b) Bjornsson R, Neese F and DeBeer S, Inorg. Chem, 2017, 56, 1470–1477. [DOI] [PubMed] [Google Scholar]
- 4.(a) Schlögl R, Handbook of Heterogeneous Catalysis, 2nd ed., Wiley-VCH, Weinheim, 2008. [Google Scholar]; (b) Connor GP and Holland PL, Catal. Today, 2017, 286, 21–40. [DOI] [PMC free article] [PubMed] [Google Scholar]
- 5.(a) Betley TA and Peters JC, J. Am. Chem. Soc, 2003, 125, 10782–10783. [DOI] [PubMed] [Google Scholar]; (b) Field LD, Guest RW and Turner P, Inorg. Chem, 2010, 49, 9086–9093. [DOI] [PubMed] [Google Scholar]; (c) Grubel K, Brennessel WW, Mercado BQ and Holland PL, J. Am. Chem. Soc, 2014, 136, 16807–16816. [DOI] [PMC free article] [PubMed] [Google Scholar]
- 6.Robin MB and Day P, in Advances in Inorganic Chemistry and Radiochemistry, eds. Emeléus HJ and Sharpe AG, Academic Press, 1968, vol. 10, pp. 247–422. [Google Scholar]
- 7.(a) Smith JM, Sadique AR, Cundari TR, Rodgers KR, Lukat-Rodgers G, Lachicotte RJ, Flaschenriem CJ, Vela J and Holland PL, J. Am. Chem. Soc, 2006, 128, 756–769. [DOI] [PubMed] [Google Scholar]; (b) McWilliams SF, Bill E, Lukat-Rodgers G, Rodgers KR, Mercado BQ and Holland PL, J. Am. Chem. Soc, 2018, 140, 8586–8598. [DOI] [PMC free article] [PubMed] [Google Scholar]
- 8.Shimanouchi T Molecular Vibrational Frequencies. In NIST Chemistry WebBook; Linstrom PJ, Mallard WG, Eds.; NIST Standard Reference Database Number 69; National Institute of Standards and Technology: Gaithersburg, MD; http://webbook.nist.gov (accessed Aug 01, 2018). [Google Scholar]
- 9.(a) Smith JM, Lachicotte RJ, Pittard KA, Cundari TR, Lukat-Rodgers G, Rodgers KR and Holland PL, J. Am. Chem. Soc, 2001, 123, 9222–9223. [DOI] [PubMed] [Google Scholar]; (b) Ding K, Pierpont AW, Brennessel WW, Lukat-Rodgers G, Rodgers KR, Cundari TR, Bill E and Holland PL, J. Am. Chem. Soc, 2009, 131, 9471–9472. [DOI] [PMC free article] [PubMed] [Google Scholar]; (c) Pfirrmann S, Yao S, Ziemer B, Stösser R, Driess M and Limberg C, Organometallics, 2009, 28, 6855–6860. [Google Scholar]; (d) Horn B, Pfirrmann S, Limberg C, Herwig C, Braun B, Mebs S and Metzinger R, Z. Anorg. Allg. Chem, 2011, 637, 1169–1174. [Google Scholar]; (e) McWilliams SF, Rodgers KR, Lukat-Rodgers G, Mercado BQ, Grubel K and Holland PL, Inorg. Chem, 2016, 55, 2960–2968. [DOI] [PMC free article] [PubMed] [Google Scholar]
- 10.Pfirrmann S, Limberg C, Herwig C, Stößer R and Ziemer B, Angew. Chem. Int. Ed, 2009, 48, 3357–3361. [DOI] [PubMed] [Google Scholar]
- 11.Geri JB, Shanahan JP and Szymczak NK, J. Am. Chem. Soc, 2017, 139, 5952–5956. [DOI] [PMC free article] [PubMed] [Google Scholar]
- 12.Stoian SA, Vela J, Smith JM, Sadique AR, Holland PL, Münck E and Bominaar EL, J. Am. Chem. Soc, 2006, 128, 10181–10192. [DOI] [PubMed] [Google Scholar]
- 13.Andres H, Bominaar E, Smith JM, Eckert NA, Holland PL and Münck E, J. Am. Chem. Soc, 2002, 124, 3012–3025. [DOI] [PubMed] [Google Scholar]
- 14.Christou G, Gatteschi D, Hendrickson DN and Sessoli R, MRS Bulletin, 2000, 25, 66–71. [Google Scholar]
- 15.(a) Richardson DE, Sen JP, Buhr JD and Taube H, Inorg. Chem, 1982, 21, 3136–3140. [Google Scholar]; (b) Hoffert WA, Rappé AK and Shores MP, Inorg. Chem, 2010, 49, 9497–9507. [DOI] [PubMed] [Google Scholar]
Associated Data
This section collects any data citations, data availability statements, or supplementary materials included in this article.


