Abstract
Purpose
As gradient performance increases, Peripheral Nerve Stimulation (PNS) is becoming a significant constraint for fast MRI. Despite its impact, PNS is not directly included in the coil design process. Instead, the PNS characteristics of a gradient are assessed on healthy subjects after prototype construction. We attempt to develop a tool to inform coil design by predicting the PNS thresholds and activation locations in the human body using electromagnetic field simulations coupled to a neurodynamic model. We validate the approach by comparing simulated and experimentally determined thresholds for three gradient coils.
Methods
We first compute the electric field induced by the switching fields within a detailed electromagnetic body model, which includes a detailed atlas of peripheral nerves. We then calculate potential changes along the nerves and evaluate their response using a neurodynamic model. Both a male and female body model are used to study two body gradients and one head gradient.
Results
There was good agreement between the average simulated thresholds of the male and female models with the experimental average (NRMSE: <10% and <5% in most cases). The simulation could also interrogate thresholds above those accessible by the experimental setup and allowed identification of the site of stimulation.
Conclusions
Our simulation framework allows accurate prediction of gradient coil PNS thresholds and provides detailed information on location and “next nerve” thresholds that are not available experimentally. As such, we hope that PNS simulations can have a potential role in the design phase of high performance MRI gradient coils.
Keywords: Peripheral Nerve Stimulation, Magnetostimulation Thresholds, MRI Gradient Coil Switching, Electromagnetic Field Simulation, Neurodynamic Model, EM Exposure Safety
Introduction
With recent improvements in the hardware performance of MRI gradient coils, Peripheral Nerve Stimulation (PNS) (1, 2, 3, 4, 5, 6) has become a significant limitation to the full use of these systems for fast imaging. The PNS limitation is especially acute for imaging sequences such as EPI and bSSFP during encoding with whole-body gradients (7, 8). Despite its impact on how gradient coils can be used in humans, the PNS metric is not constrained explicitly during the coil design phase. Instead, gradient coils are characterized by experimental PNS thresholds that are obtained using constructed coil prototypes and healthy human subjects. The experimental thresholds are determined for varying gradient ramp durations, yielding characteristic PNS threshold curves (9, 10, 11, 12, 13). This data allows a compact analysis of the threshold for a given applied waveform (14) but does not allow a gradient design to be evaluated before construction. Additionally, design rules have been developed through comparisons of gradient designs and PNS threshold experiments to guide the design process (15). An example of this is the inverse scaling relationship between the size of the imaging volume and the PNS threshold (i.e., increasing the FOV usually reduces the PNS threshold). While informing the design for this particular variable within the range of gradient designs for which it was developed, it is difficult to span the space of gradient design parameters with similar experimental models.
In contrast, a framework for the prediction of PNS thresholds from an arbitrary wire geometry could potentially enable the evaluation of a large number of hypothetical strategies, identifying “PNS critical” coil features and iterative optimization. Additionally, new approaches such as composite gradient systems (16), multiple-region gradient arrays (17), and PATLOC gradient arrays (18, 19) provide multiple degrees of freedom for creating encoding fields, and would require extensive experimental characterization to explore the PNS ramifications of this space. Finally, PNS mitigation ideas such as the use of additional coils for reducing PNS (20, 21) are likely difficult to explore without full simulation of the PNS threshold changes they produce.
The induction of nerve stimulation (action potentials within the nerves) by the switching gradient fields can be viewed as a two-part process: induction of an electric field pattern in the body shaped by the conductive tissue geometry, and the effect of these fields on the nerve membrane potentials, possibly triggering action potential generation (22, 23). The first part (electric field determination) has been approached by electromagnetic simulations in realistic body models (24). While electric field hotspots are informative, they are not the complete story behind PNS. The development of an action potential, of course, requires the presence of a nerve. Although present in a fine web on the surface, peripheral nerves are sparser deep in the body. Additionally, it is known from experimental observations (25, 26) and theoretical predictions (27, 28, 29) that larger diameter nerves have lower stimulation thresholds, suggesting that electric field hotspots coinciding with large nerves are important to identify. Additionally, the relative nerve/field geometry is crucial, since it is the tangential component of the electric field that initiates action potentials. Additionally, analysis of nerve models shows that the second spatial derivative of the potentials along the nerve is the important metric (27, 30), suggesting the significance of the spatial characteristics of the hotspot as well as the local curvature of the nerve. Together, these considerations point to the importance of considering a full model of the complex field distribution and nerve geometry inside the human body.
In work toward a more predictive model of the field/body/nerve interactions, simulations have been recently performed to assess the interaction between the electric field and the nerve to inform nerve response (31, 32, 33, 28, 34, 35, 36, 37). These investigations were begun as simplified straight nerve segments placed in small body models (approximately 10 cm) to evaluate the effect of the electric field on the neurodynamics and extended by Neufeld and colleagues to study segments of the ulnar and sciatic nerves within a detailed body model (38, 39). Although this work gives insight into several important parameters such the temperature dependence of the neurodynamics, comparisons to experimental thresholds were not possible since the nerve atlas was limited. We recently developed a more complete nerve atlas within a detailed electromagnetic body model and demonstrated that coupling electrodynamic and neurodynamic simulations could predict the thresholds from simple solenoid coils (40, 41).
In this work, we use this combined electromagnetic and neurodynamic modelling approach to simulate the PNS thresholds of three MRI gradient coils (two body gradients and one head gradient) for sinusoidal and trapezoidal waveforms with varying gradient rise times (42). The simulation uses a two-step approach: first, we compute the electromagnetic fields in realistic body models using a validated FEM solver. Second, we simulate the nerve response within the labeled nerve atlas using an established neurodynamic model. We also extend our simulations to both a male and female body/nerve models. We show that the male-female average of our framework provides accurate prediction (within 10%) of the PNS thresholds of these widely different gradient coils and correctly ranks the coils and the gradient axes in terms of PNS. The simulations also identify the site of activation, and can assess areas, which are next most likely to be stimulated.
Methods
Our framework for simulating magnetostimulation thresholds of the peripheral nervous system has been previously described in detail (40). First, we use a realistic body model and the detailed winding pattern of the gradient coil to compute the electromagnetic (EM) fields induced by the time-varying current applied to the coil. The model contains the location of the peripheral nerves allowing the evaluation of the field at the location of each nerve segment. Second, we simulate the dynamic response of the nerve membrane potentials to the electric field induced by the gradient. The generation of an action potential (AP) traveling along the nerve fiber is identified as peripheral nerve stimulation (PNS). Thus, a fundamental ingredient to our approach is the realistic surface-based body model with a co-registered labeled nerve atlas and careful attention to the tissue geometry in the immediate vicinity of the nerves. The electric field map is converted to a more relevant neurodynamic metric by projecting the electric fields onto the nerve fibers of the atlas and integrating the result to obtain the electric potential changes along the nerves. This physical entity is the driving function of typical neurodynamic models, and can then be employed to assess whether or not an AP is generated for a given gradient waveform.
Gradient Coils
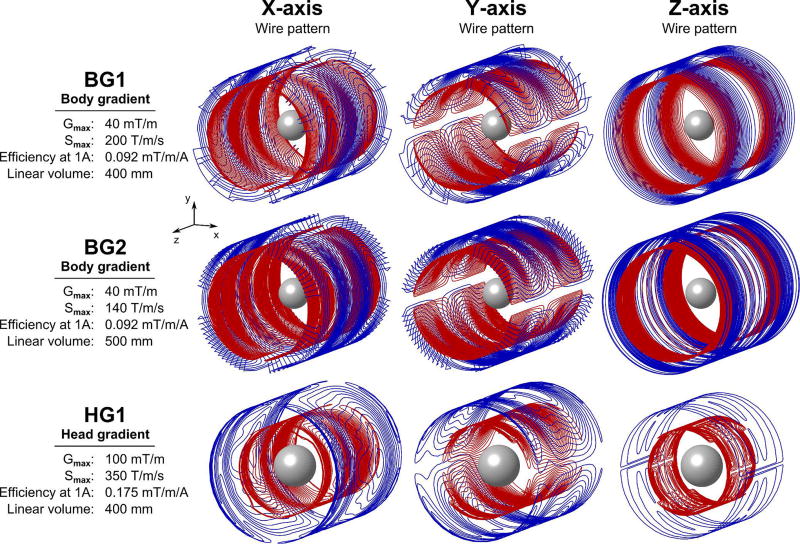
We simulated PNS thresholds for the three commercial gradient coils shown in Fig 1. All gradient coils are actively shielded. The first coil was the Siemens “Sonata” body gradient, a short gradient coil developed for high slew rate, which we refer to as “BG1”. We also simulate a higher inductance (lower slew rate) and higher linearity body gradient coil, distributed as the Siemens “Quantum” gradient. We refer to this as “BG2”. Finally, we simulate the Siemens AC84 asymmetric head-only gradient, a fast, strong 400 mm diameter clear-bore head gradient coil with shoulder cut-outs. We refer to this coil as “HG1”. We compare the predicted PNS thresholds in our body models to experimental PNS thresholds previously obtained by the manufacturer in studies of 65 (27.7 ± 6.5 years old, 31 female, 34 male), 79 (30.5 ± 8.9 years old, 33 female, 46 male) and 32 healthy subjects (29.7 ± 10.6 years old, 12 female, 20 male) for BG1, BG2 and HG1, respectively. The head was placed at gradient iso-center for all simulations and experiments. It was not always experimentally possible to create PNS for each gradient axis, due to limitations of the driving amplifiers. For the BG1 gradient, stimulation could only be experimentally induced in the Y single-axis mode and in the X+Y and X+Y+Z combined-axes modes. For the BG2 gradient, stimulation was experimentally achieved for Y, X+Y, Y+Z, and X+Y+Z combinations. Similarly, HG1 produced stimulation in the X, X+Y, X+Z, and X+Y+Z operation modes. In contrast, simulations allow the study of arbitrarily high gradient fields and provide thresholds for all gradient axes, but their comparison to measured thresholds is limited to the experimentally accessible parameter space.
Figure 1.
Wire patterns for three actively shielded gradient coils investigated in this work: Two body coils (BG1 and BG2) and one head gradient system (HG1). The primary winding patterns in blue are mainly designed for generation of the linear gradient fields, whereas the secondary windings in red are primarily designed for achieving zero field outside the gradient volume (active shielding). For reference, we show a 20 cm diameter sphere at the iso-center. Modeling of multiple coils in this work allows us not only to validate the accuracy of our PNS simulations framework but also to verify that we correctly rank different coil designs with respect to PNS.
Body Model and Nerve Atlas
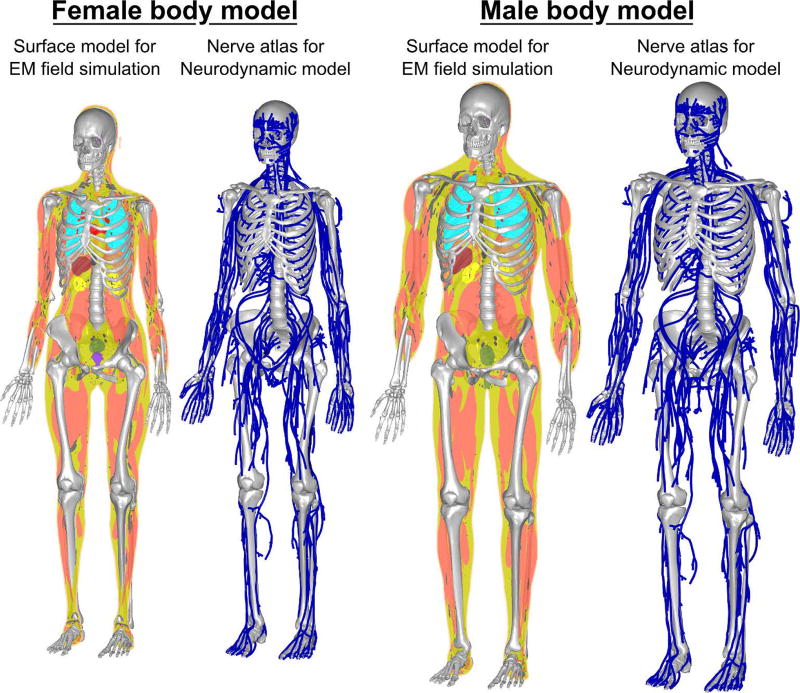
We derived detailed surface-based body models, including the nerve locations, from anatomical surface data provided by Zygote Media Group Inc (American Fork, UT, USA). The surface model from Zygote was not suitable for EM simulations since it lacked watertight structures and included self-intersections. Therefore, it was processed as previously described (40, 43). In short, we discretize and resegment the surface model to eliminate intersecting faces and generate a solid body model. In a second step, we remove non-manifold and low-quality features to ensure that the body models can be used in tetrahedral and hexahedral FEM simulations. We prepared both the Zygote adult male (height: 176cm, weight: 81.6 kg, BMI: 26.3) and adult female (height: 162.6cm, weight: 52.6, BMI: 19.9) body model with 21 tissue classes: connective tissue, lungs, blood vessels, brain, large and small intestine, trachea, spleen, heart, bone, liver, bladder, skin, dura, body fluid, gland tissues, stomach, nervous tissue, reproductive system, fatty tissue, and muscle (Fig. 2). Tissue electrical parameters were taken from the Gabriel database (44) for a frequency of 1 kHz.
Figure 2.
Female (left) and male (right) body models used in this work for prediction of PNS thresholds. The models were derived from the Zygote surface models and were modified to be suitable for simulation. Each body model contains topology corrected surfaces modeling 21 tissue classes as well as a co-registered atlas of the largest peripheral nerves (about 1900 nerve tracks per model).
The Zygote models include a detailed description of the major nerve tracks in the body; ~1900 individual nerve tracks are provided per model. We extracted 1D labeled representations of the nerves using the previously described methodology (40). This reduced each nerve track to a centerline curve. We defined parent/children nerves (i.e., the connectivity between the individual nerve tracks) and labeled each segment with the fiber diameter (which, in turn, determines the chosen parameters for the neurodynamic model). The process retains the nerve’s registration to the volume from which the electric fields are calculated. In contrast to earlier investigations (40), we ensure that all fiber paths of the nerve atlas are embedded in the nervous tissue class in the body model.
EM Field Simulations
The EM fields produced by the gradient inside the body were simulated using Sim4Life (Zurich MedTech, Switzerland) electromagnetic simulation software. EM fields were solved using an FEM magneto quasi-static solver on a hexahedral mesh. In the field simulation, we used an isotropic spatial resolution (i.e., hexahedral mesh size) of 1 mm, yielding about 190M mesh cells for the male body model. The three gradient axes were simulated individually. The resulting fields were then combined to model simultaneous operation of multiple gradient axes (such as X+Y or X+Y+Z). The EM fields were simulated using a 1 A coil current modulated at 1 kHz. We then determined the unit electric field per unit slew rate (i.e., the electric field generated when the gradient is switched at a slew rate of 1.0 T/m/s), which determines the electric field’s time course for specific sinusoidal and trapezoidal gradient waveforms.
Neurodynamic Simulation
After the EM field simulation, we projected the electric fields onto the 3D tracks of the nerve atlas and integrated the result along the nerves to obtain the electric potential changes along the nerves. Note that the electric potentials vary both spatially along the nerves and temporally, as they are modulated by the coil’s driving waveform.
The electric potentials computed along all nerve fibers were input into our implementation of the McIntyre-Richardson-Grill (MRG) neurodynamic model (45, 46) to compute the response of the nerve fibers to the imposed electric fields, including possible action potential generation. The MRG model is an electrical circuit representation of myelinated nerve fibers designed for mammalian nerves with explicit modeling of the nodes of Ranvier, the axon, and the myelin insulation sheath. The model is characterized by a set of coupled differential equations describing the dynamics of ion concentrations (mainly sodium and potassium) and membrane potentials that determine the nerve excitation and inhibition. The differential equations are solved for every nerve track independently using backward-Euler numerical integration, as previously described in detail (40).
Although the spacing between the nodes of Ranvier is dictated by the MRG model parameters, the exact position of the neurodynamic model along the nerve path with respect to the external field potential is a free parameter not specified by the nerve atlas or the MRG model. We found that this shift parameter can have an effect on the PNS threshold of up to 10%. In a fiber bundle, there are thousands of nerves; therefore, one or several of them are likely to be at the “worst-case” location with respect to the external potential in term of PNS. Therefore, we always attempt to simulate the shift parameter value yielding the most conservative PNS thresholds. To do so, we translate the MRG model compartments for each nerve segment from 0 to R, where R is the inter-Ranvier distance, in 10 steps and chose the shift value yielding the lowest PNS threshold.
The stimulation threshold is identified by increasing the coil driving waveform amplitude until an action potential is created (titration process), marking the PNS threshold for that waveform. This process is repeated for different rise times of trapezoidal/sinusoidal waveforms in order to obtain the PNS threshold as a function of the applied waveform’s rise time (47). These curves are typically used in MRI to characterize a gradient coil’s PNS thresholds (9, 10, 11, 12, 13).
Gradient waveform parameters
The experimental and simulation studies used gradient waveforms with ramp times between 100 µs and 1000 µs and a 500 µs constant flat top duration between the ramps. Both linear ramps (i.e., trapezoidal waveforms) and sine-shaped ramp waveforms were assessed. In the experimental PNS measurements, the gradient waveforms consisted of 128 bipolar pulses, resulting in overall train lengths between 89.6 ms (0.2 ms pulse duration) and 217.6 ms (1.2 ms pulse duration). Due to computational limitations, we simulated the PNS thresholds using only 16 bipolar pulses and scaled the PNS thresholds to 128 bipolar pulses. We derived the scaling factor from the experimental data previously measured in human experiments by Hebrank et al. in the context of the development of the “SAFE” model (14, 48). In this work, the authors investigated the relation between the number of gradient pulses and the stimulation threshold and found that increasing the number of pulses from 16 to 128 reduces the threshold by approximately 7%.
Results
Magnetic Fields
Based on the simulated magnetic fields, we determined the gradient efficiency to define the unit electric field induced per unit gradient switching rate. For the BG1 coil, the nominal gradient efficiency determined by the manufacturer was approximately 0.092 mT/m/A for all gradient axes. The gradient efficiencies of the simulated coils agreed well with the experimental values (≤ 3.1% error). For the BG2 coil, the nominal gradient efficiency was approximately 0.094 mT/m/A, which was reproduced in the EM simulations by ≤ 1.8% error. For the HG1 coil, the nominal gradient efficiency of approximately 0.175 mT/m/A was achieved in the simulation with ≤ 1.0% error. Magnetic field maps of the three gradient coils are shown in supplemental figure S1.
Electric Fields
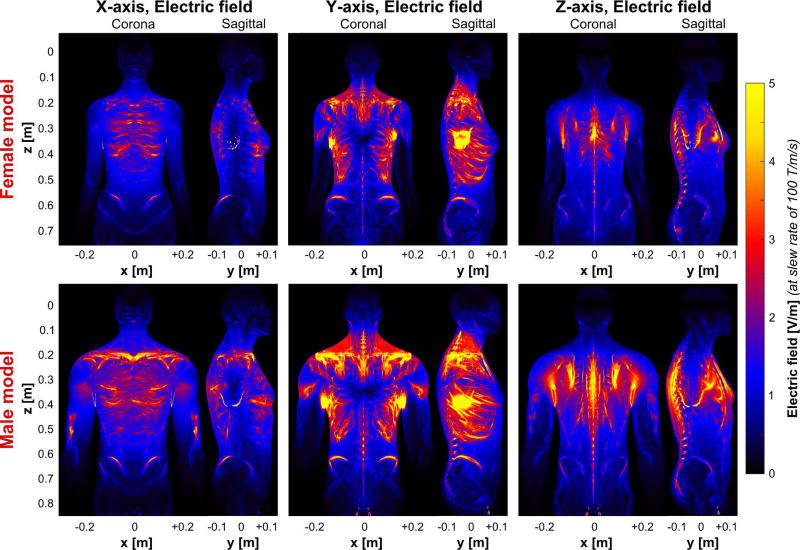
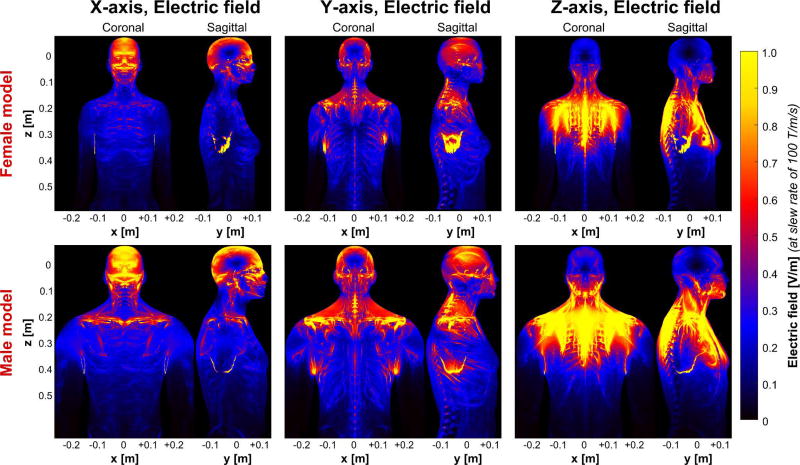
In Figs. 3 and 4, we show the electric field magnitude produced by the BG1 and HG1 coils, when the gradient fields are switched at a slew rate of 100 T/m/s (a similar plot for BG2 is provided in supplemental figure S2). The maps are maximum intensity projections in the coronal and sagittal planes. The three gradient axes (left to right) and both the female and male body models are shown.
Figure 3.
Electric field maps (maximum intensity projection) induced by the BG1 coil in the female (top) and the male body models (bottom). The coil driving waveform is scaled so as to achieve a slew rate of 100 T/m/s (note that the electric field varies with dB/dt and not with B). For better visibility, the electric field in bone is set to zero (the electric field in the bones is usually very high and would dominate the color scale otherwise).
Figure 4.
Electric field maps (maximum intensity projection) induced by the HG1 coil in the female (top) and the male body models (bottom). The coil driving waveform is scaled so as to achieve a slew rate of 100 T/m/s (note that the electric field varies with dB/dt and not with B). For better visibility, the electric field in bone is set to zero (the electric field in the bones is usually very high and would dominate the color scale otherwise).
The electric fields are heavily shaped by the conductive body tissues, creating a highly heterogeneous field pattern. This is in contrast to the magnetic fields for which the body is mostly transparent. For the body gradients, the abdominal/chest region experiences the highest electric fields, with the largest fields induced by the Y-axis, followed by the Z-axis and the X-axis. The Y-axis caused high electric field magnitudes in the shoulder regions, at the left/right regions of the ribs, as well as close to the hipbones. The electric fields imposed by the Z-axis are predominantly located close to the spine and to the sternum. The X-axis produces electric fields at the dorsal and ventral parts of the rib bones and close to the hips. Note, that for all three gradient axes, the fields induced in the male body model are significantly higher (up to 30%), than those induced in the female model. Although the two body gradients have very similar gradient efficiencies, the electric fields imposed by the more linear BG2 coil (Fig. 4) are substantially higher than those induced by the BG1. Beyond this scaling, the induced electric field patterns of the two body gradients are rather similar.
As is expected, the electric field patterns of the head gradient differ substantially from those of the body gradients both in terms of overall field strength (approximately 80% reduction) and field distribution. More specifically, the X-axis predominantly creates electric fields in the facial area (front and back) and close to the collarbone, and the Y-axis induces electric fields at the left and right side of the head as well as in the shoulder region. The Z-axis produces electric fields at the lower part of the head (jaw region) and significant electric fields in the shoulders and upper chest.
Neural Activation Function
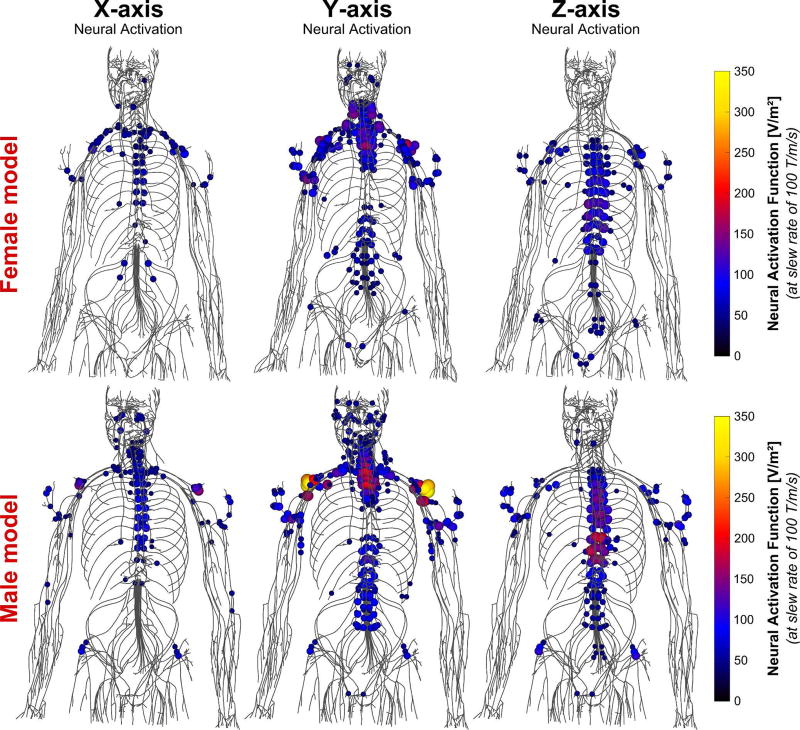
Figure 5 shows the neural activation function of the BG1 scaled to a slew rate of 100 T/m/s in both the female and male body model (a similar plot for BG2 is shown in the supplemental figure S3). The activation function is obtained by projecting the electric field onto the nerve fibers and taking the spatial derivative of this entity along the nerves (27, 30). More precisely, the derivative is computed based on the electric field at the node of Ranvier locations where the largest transmembrane currents are allowed to flow. The spacing of the nodes of Ranvier is chosen according to the axon diameter (e.g., approximately 1.3 mm for a 12 µm nerve fiber as reported in the literature (45, 46)). Unfortunately, precise locations of the nodes of Ranvier are not specified in our model. There for we used a “worst case” approximation of the node locations by shifting the model to achieve the lowest threshold. Note that the activation function does not incorporate any information of the nerve’s myelination or membrane dynamics, i.e., the nerves with the largest activation function do not necessarily coincide with the nerves having the lowest PNS threshold. The combination of high activation function and sensitive (large diameter) nerve creates a likely low-threshold situation.
Figure 5.
Maxima of the neural activation function (i.e., second derivative of the electric field projected onto the nerve tracks) induced by the BG1 in the female (top) and male (bottom) body models at slew rate of 100 T/m/s. Only the 10% greatest activation function values are shown for clarity.
The Y-axis of the BG1 creates significant neural activation of the shoulder nerves and the upper intercostal nerves close to the vertebrae, whereas the Z-axis stimulates the lower intercostal nerves. The X-axis causes only minor stimulation of the upper intercostal nerves and nerves of the upper arm.
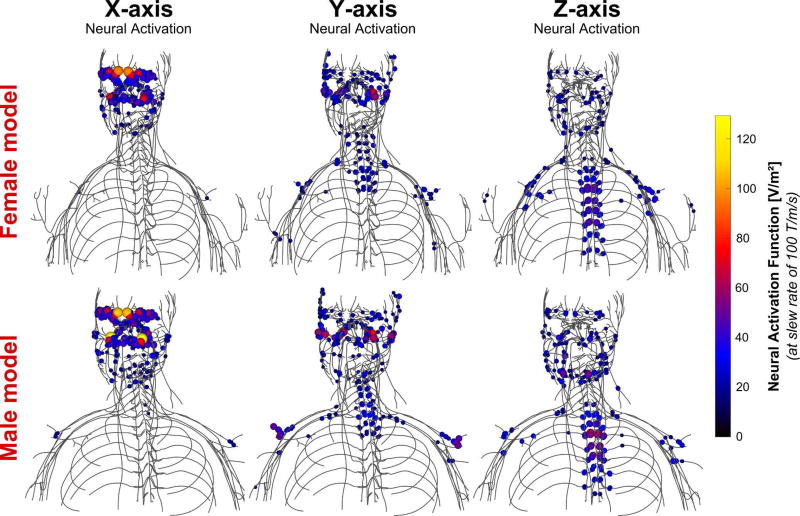
Figure 6 shows the neural activation function of the HG1 coil. Focusing on the head nerves, the X-axis creates significant stimulation of nerves in the forehead and close to the nasal wings, the Y-axis mainly causes stimulations in the left/right side of the head, and the Z-axis generates neural activation of the lower facial nerves in the jaw region. In the chest and abdomen, the electric fields generated by the head gradient create neural activation in similar places to that of the BG1 coil (shoulder nerves and upper intercostal nerves for the Y-axis, lower intercostal nerves for the Z-axis, but almost no interaction for the X-axis).
Figure 6.
Maxima of the neural activation function (i.e., second derivative of the electric field projected onto the nerve tracks) induced by the HG1 coil in the female (top) and male (bottom) body models at slew rate of 100 T/m/s. Only the 10% greatest activation function values are shown for clarity.
PNS Threshold Curves
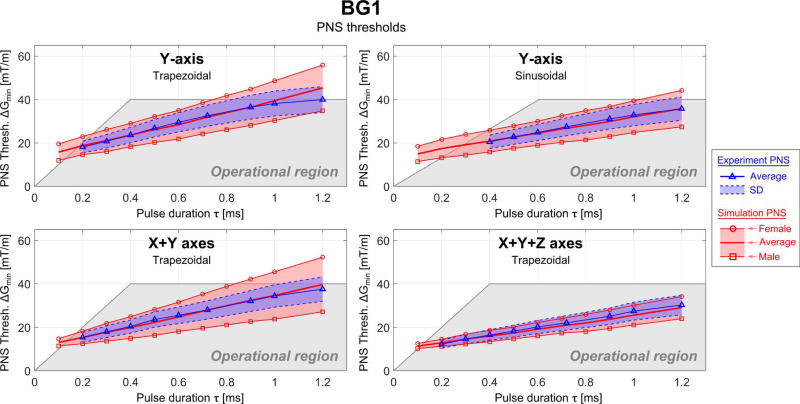
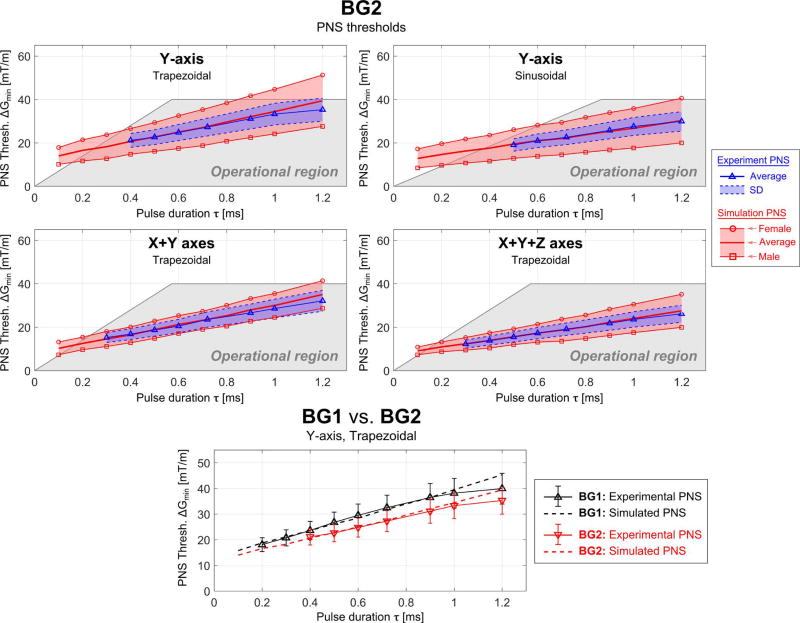
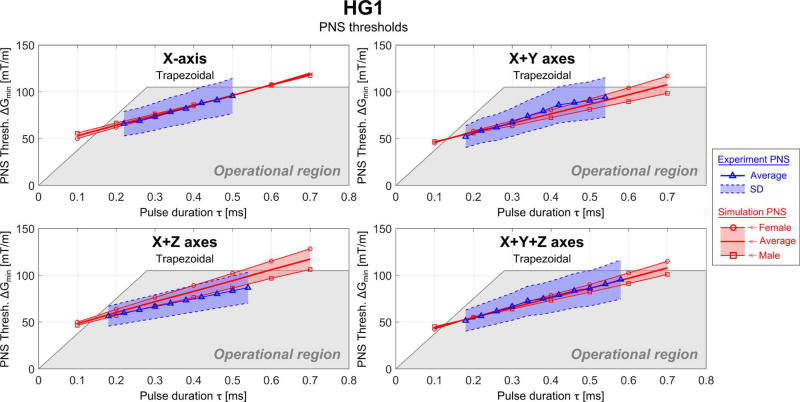
Figures 7, 8 and 9 show experimental and simulated PNS thresholds as a function of the pulse duration of the applied current waveform (rise time) for the three gradients studied. In all figures, the blue curve shows the experimental thresholds determined from the healthy subjects and the measurement SD over the population (shaded blue region). The red curves show the simulated results for the male and female anatomical model as well as the average of the two models. The shaded grey region is the experimentally accessible region for each gradient. PNS thresholds are given as the largest sub-threshold gradient modulation strength (ΔGmin) for a given pulse duration, τ. Results from both trapezoidal and sinusoidal ramps are shown. The thresholds are shown for each single gradient axis and combinations of axes for which experimental stimulation was observed. For the body gradients BG1 and BG2, this was Y, X+Y, and X+Y+Z. For the HG1, these were X, X+Y and X+Y+Z.
Figure 7.
Simulated (red) and experimental (blue) PNS threshold curves for the BG1 coil in terms of the minimum gradient magnitude as a function of the pulse duration for trapezoidal and sinusoidal current waveforms (the pulse duration is the “ramp” part of the trapezoidal/sinusoidal waveform) applied to different combinations of gradient axis. The shaded grey region is the experimentally accessible region (determined by Gmax and Smax).
Figure 8.
Simulated (red) and experimental (blue) PNS threshold curves for the BG2 coil in terms of the minimum gradient magnitude as a function of the pulse duration for trapezoidal and sinusoidal current waveforms (the pulse duration is the “ramp” part of the trapezoidal/sinusoidal waveform) applied to different combinations of gradient axis. The shaded grey region is the experimentally accessible region (determined by Gmax and Smax). The bottom plot shows the threshold results for the BG1 and BG2 coils on the same plot for comparison.
Figure 9.
Simulated (red) and experimental (blue) PNS threshold curves for the HG1 coil in terms of the minimum gradient magnitude as a function of the pulse duration for trapezoidal and sinusoidal current waveforms (the pulse duration is the “ramp” part of the trapezoidal/sinusoidal waveform) applied to different combinations of gradient axis. The shaded grey region is the experimentally accessible region (determined by Gmax and Smax).
The female body model produced higher thresholds than the male model with the exception of the head gradient X-axis, where both genders had essentially the same threshold. The experimental results (from a mixture of sexes) were in good agreement with the average thresholds of the male and female models. The NRMSE differences were below 5% in most cases and a maximum of 10.0% (HG1, X+Z axes). For the BG1 coil the NRMSE between average experimental and simulated PNS thresholds is 4.4% and 2.5% for the Y-axis (trapezoidal and sinusoidal waveform, respectively), 3.8% for the X+Y axes and 5.6% for the X+Y+Z axes (both for trapezoidal waveforms). Unfortunately, the experimental thresholds were not identified by gender.
In Fig. 8, the experimental and simulated PNS thresholds are shown for the BG2 coil. Again, there is a good match between simulated data average of the two models and experimental PNS threshold curves. The NRMSE of the simulated thresholds is 4.8% and 2.8% for the Y-axis (trapezoidal and sinusoidal waveform, respectively), 4.0% for the X+Y axes and 1.8% for the X+Y+Z axes (both for trapezoidal waveforms). The bottom panel of Fig. 9 compares the PNS threshold results (Y-axis, trapezoidal waveform) for the two body gradients on the same plot. The PNS thresholds of the BG2 coil were found to be about 15% lower than the thresholds of the BG1 coil as would be expected from the more linear (large FOV) gradient.
The PNS thresholds for HG1 are substantially higher than the thresholds of the body gradients. There is good agreement between the experiments (blue) and the simulations (red): for the different gradient axes combination modes, the NRMSE was 1.4% (X-axis), 3.8% (X+Y axes), 10.0% (X+Z axes), and 1.4% (X+Y+Z axes).
In addition to the thresholds for the gradient axis combinations shown in Figs. 7–9 for which stimulation was experimentally accessible, we are able to provide simulated threshold curves for the other axes (although there is no experimental data to compare to). These thresholds are shown as supplementary figure S4.
Sites of Stimulation
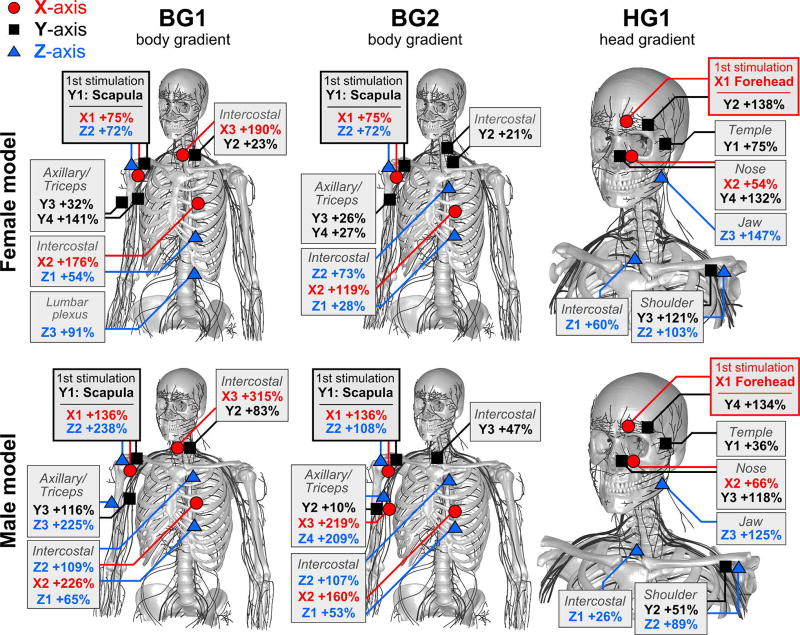
Figure 10 illustrates the locations of the body predicted to be stimulated by our PNS simulation framework. We mark the location of the most sensitive nerve in each case (from which the PNS threshold is taken) and also identify the next most sensitive nerves. These are labeled by their percentage increase in drive current needed to stimulate these regions relative to that of the most sensitive nerve.
Figure 10.
Visual depiction of the sites of stimulation of the female (top row) and male model (bottom row) for the three gradient coils (BG1, BG2, HG1). Stimulations due to the X-axis, Y-axis, and Z-axis are shown in red, black, and blue, respectively. For each gradient/body model combination, we indicate the most sensitive sites, e.g., by “X1”, “X2”, “X3” (for the first, second, third site stimulated by the X-axis). The stated percentage describes the PNS threshold increase relative to the nerve with the lowest stimulation threshold in each gradient/body model combination. The shaded boxes are used to group equivalent stimulation sites.
For BG1, we found that the first stimulation occurred in the scapula and was induced by the Y-axis. Other sensitive nerves stimulated by the Y-axis were the axillary nerve (possibly leading to muscle contractions in the shoulder/triceps) and intercostal (IC) nerves (possibly leading to muscle contractions in the hip region). Following these, the Z-axis was found to mostly likely cause PNS (threshold increase of 54% for IC 11 and 72% in the scapula nerve). Furthermore, we found that in most cases, the thresholds in the male and female model scale differently when comparing the most sensitive nerves (i.e., the scapula in this case) to less sensitive nerve fibers.
The BG2 coil showed a similar distribution of sensitive body parts. Again, the first stimulation occurred in the scapula and was caused by switching of the Y-axis. Increasing the gradient modulation strength beyond the initial PNS threshold will then most likely stimulate the axillary (+10% to +26%), upper intercostal nerves (+21% to +47%), the triceps (+26%), and lower intercostal nerves (28% to 53%).
In contrast to the two body gradients, HG1 showed substantially different stimulation sites. In this case, the first stimulation occurred in the forehead and was induced by switching of the X-axis. Following the forehead, further increased current waveforms will most likely stimulate upper intercostal nerves (+26%), nerves in the temple area (+36% to +75%), and in the nose area (+54% to 66%). When comparing the increase in PNS thresholds for the different body parts between the male and female model, we found that for the facial nerves PNS thresholds increased rather consistently for the male/female model. However, for the shoulder/chest nerves, the PNS thresholds changed very differently between male and female (i.e., in a way similar to the two body gradients).
Discussion
We demonstrate a simulation framework capable of accurate prediction of the peripheral nerve stimulation (PNS) thresholds of MRI gradient coils. The approach employs electromagnetic field simulations in realistic body models followed by a simulation of action potential generation in myelinated peripheral nerves using a neurodynamic model. Our approach was evaluated by comparing simulated and measured PNS thresholds for two commercial body gradient coils and one head gradient coil. Various modes of operations of these coils were evaluated, namely single-axis (e.g., Y-only) and multi-axes modes (e.g., “X+Y” and “X+Y+Z”) as well as different gradient waveform shapes (i.e., trapezoidal and sinusoidal ramps) and a range gradient ramp times. For all simulations, the NRMSE between simulation and measurements was below 10%, showing that the simulation framework is capable of predicting the PNS limitation of gradient coils prior to coil construction. We believe that our framework can be beneficial for a variety of applications, including assessment of novel gradient designs, as well as strategies for PNS reduction, which might result from gradient waveform optimization (49), or the use of external field coils (21). Additionally, it might be useful for optimization of non-MRI related hardware such as devices for nerve conduction studies (NCS) (50) and nerve stimulators for diverse applications (from anesthesia to sleep apnea). We hope that the framework might also be extended to the central nervous system to inform Transcranial Magnetic Stimulation (TMS) studies (51).
The PNS simulation approach provides more specific information about the interactions between a gradient coil and the human body than a simple threshold measurement. Firstly, PNS thresholds can only be obtained for gradient axes for which the gradient amplifiers can generate super-threshold gradient pulses. The simulation can show more precisely, where stimulation occurred and the site can be examined to provide some insight into its magnetostimulation sensitivity. For example, electric field hotspots with a large diameter (e.g. sensitive) nerve running through them are obvious problems, but the relative orientation of the nerve to the field is also a factor as is the curvature of the nerve. Finally, it is not practical to experimentally determine PNS thresholds of the second or third most sensitive nerve. In contrast, simulations allow for a complete characterization of different body parts with respect to their stimulation threshold. Such a characterization (like the one shown in Fig. 10) might provide important information for gradient coil designers to consider modification of winding details to shift the site of the first stimulation. For example, for unshielded head gradient coils, the site of the first stimulation is often located in the shoulder region, because the magnetic fields leaving the coil at the patient end fully penetrate the shoulders (causing PNS in this region). On the other hand, active shielding can protect the switching fields from reaching the shoulder, shifting the site of the first stimulation to the facial area.
Despite the broad agreement between electric field hotspot locations and locations of onset nerve stimulation, the electric field and neural activation maps are not the same. Mismatches between these two metrics are due to the fact that neural activation by the external electric field is heavily dependent on (i) the presence of large axon-diameter nerves in the vicinity of the electric field hotspot and (ii) the local direction of the electric field relative to the nerve path. More precisely, the nerve’s excitability is heavily influenced by changes in the value of the electric field component parallel to the fiber. These changes may arise from variations in the electric field direction in the case of a relatively straight fiber or variations in fiber direction in the presence of a spatially smooth electric field. In a sense, the nerve atlas “filters out” components and locations of the electric fields that have little impact on the nerves. This filter is the result of the operations of projection of the electric field onto the nerve path and integration of the result along that path. For example, a nerve passing through an electric field hotspot can be unaffected by it as long as it is largely orthogonal to the local electric field. We observe this in Figs. 3 and 5, which show both electric field and neural activation function maps for BG1. Although the X-axis induces significant electric fields in the abdomen/chest region, the nerves in this body part only interact mildly with the electric fields. This is because the electric fields predominantly run in the sagittal plane, whereas the relevant nerve fibers (e.g. intercostal nerves) mostly run in the transverse plane. The neural activation function or perhaps the neural activation function weighted by the local axon diameter might provide a more meaningful metric than the electric field alone. However, this requires the nerve geometry since projections and spatial derivatives of the field along the nerve path are needed.
An interesting observation is that most stimulations occurred in sub-branches of the major nerve trunks. For example, the X and Y axes of the body gradients BG1 and BG2 induced stimulations of a branch of the scapula nerve, rather than stimulating the nearby much larger radial or ulnar nerves. This may be due to the fact that nerve trunks with large diameters follow a rather smooth path (with low curvature kinks) whereas smaller nerves tend to take very sharp turns. Because the neural activation function along the nerves is computed from the spatial derivative of the electric field component along the fiber, it is heavily modulated by these sharp kinks. Thus, the primary sub-branches of the major nerve tracks are particularly sensitive to stimulation due to their combination of relatively large axon-diameter nerve fibers and sharp kinks in their nerve paths.
The use of both a male and female body model proved necessary to match the population average experimental thresholds, especially for the body gradient coils. The threshold differences between our male model and our female model largely account for the population variation observed in the experimental data for the body gradients, but they over-represent that variance. The experimental data SD ranges from 15–20% for the body gradients whereas the male-female difference in our simulation was about 30%. Interestingly, for the head gradient coil, the simulation difference between the male and female body models was less than the experimental SD. Some of the over-estimation of the range of the body gradient experimental data could have been driven by the nature of the body models: a heavy and muscular male model and relatively small female model. The simulations revealed lower thresholds for the male model, especially for the body gradient coils. We attribute this to the larger body cross-section of the male model, giving rise to larger eddy current loops and higher electric fields. For the head gradient, the anatomical size difference (in the head region) is less pronounced and the electric field differences are less significant. We also suspect that the higher body fat content of the female model plays a role. Peripheral nerves tend to run in the fat regions between muscles. The electric field map details suggest that two conductive muscle regions separated by a dielectric fat layer act as a capacitor with a nerve potentially running between its plates. With a thicker fat layer, the capacitance is reduced and similarly the electric field experienced by the nerve. The fact that the male-female difference overestimated the experimental SD in the body gradient and underestimated it for the head gradient is harder to explain. It is clear that similar to SAR simulations, access to a wide range of body models will ultimately be useful. In addition, the role of subject position variations needs to be explored.
In practice, all anatomical models omit some features and represent simplifications. Clearly, our nerve model is limited to only the larger of the peripheral nerves and many nerve tracks are not included. Fortunately, small nerves are more difficult to excite than larger diameter nerves, so accurate PNS prediction only requires simulation of the biggest nerves. Nonetheless, a missing smaller nerve in a high electric field region could cause the model to miss a stimulation site. Until more is known, the nerve diameter cutoff for deciding which nerves to include is not clear. Our nerve atlas derived from the Zygote anatomical models contains more than 1900 nerves. The general agreement with the experiments suggests that this is adequate for making comparisons between gradient coils.
Another limitation of our PNS framework is the uncertainty of nerve axon diameters in different body regions. The diameter of the entire nerve bundle does not have a particular impact on the nerves excitability (e.g., the sciatic nerve’s diameter can reach a few centimeters). It is the composition of the nerve trunk by different types of nerve fibers and the individual nerve’s diameter that largely determines the parameters of the neurodynamic model and thus plays an important role in determining the sensitivity of the nerve to an applied electric field. For example, motor nerves have diameters ≤ 20 µm and sensory nerves ≤ 12 µm. The stimulation threshold of a motor nerve fiber with an axon diameter of 20 µm is approximately 50% lower than for sensory nerve fibers with an axon diameter of 12 µm. Unfortunately, exact fiber diameter distributions have only been investigated for a few major nerve tracks (like the sciatic or radial nerves) using nerve conduction studies (50) or excisions. For all other nerve tracks, we relied on knowledge of the type of innervation (i.e., motor, sensory, or autonomous innervation) and assigned the largest common diameters for these three types (20 µm, 12 µm, and 2 µm, respectively).
Finally, the nature of the nerve locations; tucked next to bone and between muscles and organs suggests that a high spatial resolution is needed for the electric field simulation. Because we use an FEM solver on a hexahedral mesh, the spatial resolution of the EM field simulation is limited to about 1 mm. This resolution does not permit an explicit representation of the nerves on a microscopic level (like the myelin sheath or individual nerve fibers) in the EM simulation. In the latest version of the body models, we include the nervous tissue to ensure that the fibers of the nerve atlas are embedded in the correct tissue class. The diameter of each nerve track in the electromagnetic simulation is, therefore, over-represented since it cannot fall under 2 mm (i.e., two voxels), precluding the representation of the smaller nerves with their correct size. Another limitation of the EM simulation step used is that it does not include detailed modeling of the anisotropic conductivity of nerve fibers and muscle tissues. It is possible that the anisotropic conductivity of nerve fibers especially has an impact on computed PNS thresholds. Such a hypothesis can only be tested using simulation of this effect, which needs further work.
In this work, we have demonstrated the ability to accurately predict experimental PNS thresholds of specific MRI gradient coils using electromagnetic and neurodynamic simulations in female and male body models. Good agreement between experimental and simulated PNS thresholds was found for the three different MRI gradient coils studied, suggesting that the PNS simulation framework can be used to compare the PNS properties of different coil geometries at the design stage. By providing a tool to inform gradient design prior to construction, we hope to expand the range of design features that can be characterized, with an ultimate goal of easing the restrictions caused by PNS in human MRI.
Supplementary Material
Figure S1: Magnetic fields produced by the three gradient coils (top to bottom: BG1, BG2, HG1) in central coronal and sagittal planes, scaled to a gradient strength of 10 mT/m. The colorbar for the body gradients BG1 and BG2 is scaled differently (max: 4.0 mT), than for the head gradient, HG1 (max: 2.0 mT). Note that in this plot of the magnetic field, the simple linear “gradient” is not visible due to the concomitant magnetic fields (the linear gradient is only visible in a plot of the Bz field component).
Figure S2: electric field maps (maximum intensity projection) induced by the BG2 coil in the female (top) and the male body model (bottom), scaled to a slew rate of 100 T/m/s. For better visibility, the electric fields in bone are set to zero (the electric field in the bones is usually very high and would dominate the color scale otherwise).
Figure S3: Maxima of the neural activation function (i.e., second derivative of the electric field projected onto the nerve tracks) induced by the BG2 coil in the female (top) and male (bottom) body models at slew rate of 100 T/m/s. Only the 10% greatest activation function values are shown for clarity.
Figure S4: Simulated PNS threshold curves for BG1 and BG2 (X and Z axes) and for HG1 (Y and Z axes) in terms of the minimum gradient magnitude as a function of the pulse duration for trapezoidal current waveforms. For these gradient axes, the experimental setup did not achieve significant stimulation (i.e., no experimental data is shown). The shaded grey region is the experimentally accessible region.
Acknowledgments
The authors would like to acknowledge the help of past and present members of the gradient coil group at Siemens Healthineers, including Eva Eberlein, Peter Dietz, Ralph Kimmlingen, and Franz Hebrank.
Research reported in this publication was supported by National Institute of Biomedical Imaging and Bioengineering, and the National Institute for Mental Health of the National Institutes of Health under award numbers R24MH106053, R00EB019482, U01EB025121, and U01EB025162. The content is solely the responsibility of the authors and does not necessarily represent the official views of the National Institutes of Health.
References
- 1.Mansfield P, Harvey PR. Limits to neural stimulation in echo-planar imaging. Magn Reson Med. 1993;29:746–758. doi: 10.1002/mrm.1910290606. [DOI] [PubMed] [Google Scholar]
- 2.Irnich W, Schmitt F. Magnetostimulation in MRI. Magn Reson Med. 1995;33:619–623. doi: 10.1002/mrm.1910330506. [DOI] [PubMed] [Google Scholar]
- 3.Glover PM. Interaction of MRI field gradients with the human body. Phys Med Biol. 2009;54:99. doi: 10.1088/0031-9155/54/21/R01. [DOI] [PubMed] [Google Scholar]
- 4.Recoskie BJ, Scholl TJ, ZinkeAllmang M, Chronik BA. Sensory and motor stimulation thresholds of the ulnar nerve from electric and magnetic field stimuli: Implications to gradient coil operation. Magn Reson Med. 2010;64:1567–1579. doi: 10.1002/mrm.22505. [DOI] [PubMed] [Google Scholar]
- 5.Chronik BA, Ramachandran M. Simple anatomical measurements do not correlate significantly to individual peripheral nerve stimulation thresholds as measured in MRI gradient coils. J Magn Reson Im. 2003;17:716–721. doi: 10.1002/jmri.10300. [DOI] [PubMed] [Google Scholar]
- 6.Basser PJ, Roth BJ. Stimulation of a myelinated nerve axon by electromagnetic induction. Med Biol Eng Comput. 1991;29:261–268. doi: 10.1007/BF02446708. [DOI] [PubMed] [Google Scholar]
- 7.Ham CLG, Engels JML, van de Wiel GT, Machielsen A. Peripheral nerve stimulation during MRI: Effects of high gradient amplitudes and switching rates. J Magn Reson. 1997;7:933–937. doi: 10.1002/jmri.1880070524. [DOI] [PubMed] [Google Scholar]
- 8.Feng X, Deistung A, Reichenbach JR. Quantitative susceptibility mapping (QSM) and R2* in the human brain at 3T: Evaluation of intra-scanner repeatability. Z Med Phys. 2018;28:36–48. doi: 10.1016/j.zemedi.2017.05.003. [DOI] [PubMed] [Google Scholar]
- 9.Feldman RE, Hardy CJ, Aksel B, Schenck J, Chronik BA. Experimental determination of human peripheral nerve stimulation thresholds in a 3-axis planar gradient system. Magn Reson Med. 2009;62:763–770. doi: 10.1002/mrm.22050. [DOI] [PubMed] [Google Scholar]
- 10.Setsompop K, Kimmlingen R, Eberlein E, Witzel T, CohenAdad J, McNab J, Keil B, Tisdall M, Hoecht P, Dietz P, Cauley S, Tountcheva V, Matschl V, Lenz V, Heberlein K, Potthast A, Thein H, Horn JV, Toga A, Schmitt F, Lehne D, Rosen B, Wedeen V, Wald L. Pushing the limits of in vivo diffusion MRI for the human connectome project. NeuroImage. 2013;80:220–233. doi: 10.1016/j.neuroimage.2013.05.078. [DOI] [PMC free article] [PubMed] [Google Scholar]
- 11.Lee SK, Mathieu JB, Graziani D, Piel J, Budesheim E, Fiveland E, Hardy CJ, Tan ET, Amm B, Foo TKF, et al. Peripheral nerve stimulation characteristics of an asymmetric head-only gradient coil compatible with a high-channel-count receiver array. Magn Reson Med. 2015;76:1939–1950. doi: 10.1002/mrm.26044. [DOI] [PMC free article] [PubMed] [Google Scholar]
- 12.Wade TP, Alejski A, McKenzie CA, Rutt BK. Peripheral nerve stimulation thresholds of a high performance insertable head gradient coil; Proceedings of the 24th Annual Meeting of ISMRM; Singapore. 2016; p. 3552. [Google Scholar]
- 13.Weiger M, Overweg J, Rösler MB, Froidevaux R, Hennel F, Wilm BJ, Penn A, Sturzenegger U, Schuth W, Mathlener M, Borgo M, Börnert P, Leussler C, Luechinger R, Dietrich BE, Reber J, Brunner DO, Schmid T, Vionnet L, Pruessmann KP. A high-performance gradient insert for rapid and short-T2 imaging at full duty cycle. Magn Reson Med. 2017 doi: 10.1002/mrm.26954. [DOI] [PubMed] [Google Scholar]
- 14.Hebrank FX, Gebhardt M. SAFE model – A new method for predicting peripheral nerve stimulation in MRI; Proceedings of the 8th Annual Meeting of ISMRM; Denver. 2000; p. 2007. [Google Scholar]
- 15.Zhang B, Yen YF, Chronik BA, McKinnon GC, Schaefer DJ, Rutt BK. Peripheral nerve stimulation properties of head and body gradient coils of various sizes. Magn Reson Med. 2003;50:50–58. doi: 10.1002/mrm.10508. [DOI] [PubMed] [Google Scholar]
- 16.Goodrich KC, Hadley JR, Kim SE, Kaggie JD, Handler WB, Chronik BA, Bolster BD, Parker DL. Peripheral nerve stimulation measures in a composite gradient system. Concept Magn Reson B. 2014;44:66–74. [Google Scholar]
- 17.Parker DL, Hadley JR. Multiple-region gradient arrays for extended field of view, increased performance, and reduced nerve stimulation in magnetic resonance imaging. Magn Reson Med. 2006;56:1251–1260. doi: 10.1002/mrm.21063. [DOI] [PubMed] [Google Scholar]
- 18.Kroboth S, Layton KJ, Jia F, Littin S, Yu H, Hennig J, Zaitsev M. Optimization of a switching circuit for a matrix gradient coil; Proceedings of the 24th Annual Meeting of ISMRM; Singapore. 2016; p. 2208. [Google Scholar]
- 19.Littin S, Jia F, Layton KJ, Kroboth S, Yu H, Hennig J, Zaitsev M. Development and implementation of an 84-channel matrix gradient coil. Magn Reson Med. 2018;79:1181–1191. doi: 10.1002/mrm.26700. [DOI] [PubMed] [Google Scholar]
- 20.Bowtell R, Bencsik M, Bowley R. Reducing peripheral nerve stimulation due to switched transverse field gradients using an additional concomitant field coil; Proceedings of the 11th Annual Meeting of ISMRM; Toronto, Canada. 2003; p. 2424. [Google Scholar]
- 21.HidalgoTobon SS, Bencsik M, Bowtell R. Reducing peripheral nerve stimulation due to gradient switching using an additional uniform field coil. Magn Reson Med. 2011;66:1498–1509. doi: 10.1002/mrm.22926. [DOI] [PubMed] [Google Scholar]
- 22.Cohen MS, Weisskoff RM, Rzedzian RR, Kantor HL. Sensory stimulation by time-varying magnetic fields. Magn Reson Med. 1990;14:409–414. doi: 10.1002/mrm.1910140226. [DOI] [PubMed] [Google Scholar]
- 23.Budinger TF, Fischer H, Hentschel D, Reinfelder HE, Schmitt F. Physiological effects of fast oscillating magnetic field gradients. J Comput Assist Tomo. 1991;15:909–914. doi: 10.1097/00004728-199111000-00001. [DOI] [PubMed] [Google Scholar]
- 24.So P, Stuchly M, Nyenhuis J. Peripheral nerve stimulation by gradient switching fields in magnetic resonance imaging. IEEE Trans Biomed Eng. 2004;51:1907–1914. doi: 10.1109/TBME.2004.834251. [DOI] [PubMed] [Google Scholar]
- 25.Verveen A. Axon diameter and fluctuation in excitability. Acta Morphol Neerl Scand. 1962;5:79–85. [PubMed] [Google Scholar]
- 26.Enoka RM. Activation order of motor axons in electrically evoked contractions. Muscle & Nerve. 2002;25:763–764. doi: 10.1002/mus.10117. [DOI] [PubMed] [Google Scholar]
- 27.Rattay F. Analysis of models for external stimulation of axons. IEEE Trans Biomed Eng. 1986;33:974–977. doi: 10.1109/TBME.1986.325670. [DOI] [PubMed] [Google Scholar]
- 28.Carbunaru R, Durand DM. Axonal stimulation under MRI magnetic field z gradients: A modeling study. Magn Reson Med. 1997;38:750–758. doi: 10.1002/mrm.1910380511. [DOI] [PubMed] [Google Scholar]
- 29.Basser PJ. Scaling laws for myelinated axons derived from an electronic core-conductor model. J Integr Neurosci. 2004;03:227–244. doi: 10.1142/s0219635204000427. [DOI] [PubMed] [Google Scholar]
- 30.Basser PJ, Wijesinghe RS, Roth BJ. The activating function for magnetic stimulation derived from a three-dimensional volume conductor model. IEEE Trans Biomed Eng. 1992;39:1207–1210. doi: 10.1109/10.168686. [DOI] [PubMed] [Google Scholar]
- 31.Roth BJ, Cohen LG, Hallett M, Friauf W, Basser PJ. A theoretical calculation of the electric field induced by magnetic stimulation of a peripheral nerve. Muscle Nerve. 1990;13:734–741. doi: 10.1002/mus.880130812. [DOI] [PubMed] [Google Scholar]
- 32.Davey KR, Cheng CH, Epstein CM. Prediction of magnetically induced electric fields in biological tissue. IEEE Trans Biomed Eng. 1991;38:418–422. doi: 10.1109/10.81560. [DOI] [PubMed] [Google Scholar]
- 33.Ruohonen J, Ravazzani P, Grandori F. An analytical model to predict the electric field and excitation zones due to magnetic stimulation of peripheral nerves. IEEE Trans Biomed Eng. 1995;42:158–161. doi: 10.1109/10.341828. [DOI] [PubMed] [Google Scholar]
- 34.Krasteva VT, Papazov SP, Daskalov IK. Peripheral nerve magnetic stimulation: influence of tissue non-homogeneity. Biomed Eng Online. 2003;2:19. doi: 10.1186/1475-925X-2-19. [DOI] [PMC free article] [PubMed] [Google Scholar]
- 35.Ye H, Cotic M, Fehlings MG, Carlen PL. Transmembrane potential generated by a magnetically induced transverse electric field in a cylindrical axonal model. Med Biol Eng Comput. 2011;49:107–119. doi: 10.1007/s11517-010-0704-0. [DOI] [PubMed] [Google Scholar]
- 36.Pisa S. A complete model for the evaluation of the magnetic stimulation of peripheral nerves. Open Biomed. Eng. J. 2014;8:1–12. doi: 10.2174/1874120701408010001. [DOI] [PMC free article] [PubMed] [Google Scholar]
- 37.RamRakhyani AK, Kagan ZB, Warren DJ, Normann RA, Lazzi G. A um-scale computational model of magnetic neural stimulation in multifascicular peripheral nerves. IEEE Trans Biomed Eng. 2015;62:2837–2849. doi: 10.1109/TBME.2015.2446761. [DOI] [PubMed] [Google Scholar]
- 38.Neufeld E, Oikonomidis IV, Iacono MI, Angelone LM, Kainz W, Kuster N. Investigation of assumptions underlying current safety guidelines on EM-induced nerve stimulation. Phys Med Biol. 2016;61:4466–4478. doi: 10.1088/0031-9155/61/12/4466. [DOI] [PMC free article] [PubMed] [Google Scholar]
- 39.Neufeld E, Cassará AM, Montanaro H, Kuster N, Kainz W. Functionalized anatomical models for EM-neuron interaction modeling. Phys Med Biol. 2016;61:4390–4401. doi: 10.1088/0031-9155/61/12/4390. [DOI] [PMC free article] [PubMed] [Google Scholar]
- 40.Davids M, Guérin B, Schad LR, Wald LL. Predicting magnetostimulation thresholds in the peripheral nervous system using realistic body models. Sci Rep UK. 2017;7:5316. doi: 10.1038/s41598-017-05493-9. [DOI] [PMC free article] [PubMed] [Google Scholar]
- 41.Davids M, Guérin B, Schad LR, Wald LL. Modeling of peripheral nervous stimulation thresholds in realistic body models; Proceedings of the 25th Annual Meeting of ISMRM; Honolulu, HI, USA. 2017; p. 3. [Google Scholar]
- 42.Davids M, Guérin B, Klein V, Schad LR, Wald LL. Simulation of peripheral nerve stimulation thresholds of MRI gradient coils; Proceedings of the 26th Annual Meeting of ISMRM; Paris, France. 2018. [Google Scholar]
- 43.Davids M, Guérin B, Wald LL, Schad LR. Automatic generation of topologically correct, high quality, finite-element tetrahedral body models from voxel and surface data; Proceedings of the 26th Annual Meeting of ISMRM; Paris, France. 2018. [Google Scholar]
- 44.Gabriel C. Tech. Rep. King’s College London UK: Department of Physics; 1996. Compilation of the dielectric properties of body tissues at RF and microwave frequencies. [Google Scholar]
- 45.McIntyre CC, Richardson AG, Grill WM. Modeling the excitability of mammalian nerve fibers: Influence of afterpotentials on the recovery cycle. J Neurophysiol. 2002;87:995–1006. doi: 10.1152/jn.00353.2001. [DOI] [PubMed] [Google Scholar]
- 46.McIntyre CC, Grill WM. Extracellular stimulation of central neurons: Influence of stimulus waveform and frequency on neuronal output. J Neurophysiol. 2002;88:1592–1604. doi: 10.1152/jn.2002.88.4.1592. [DOI] [PubMed] [Google Scholar]
- 47.Irnich W, Hebrank FX. Stimulation threshold comparison of time-varying magnetic pulses with different waveforms. J Magn Reson Im. 2009;29:229–236. doi: 10.1002/jmri.21573. [DOI] [PubMed] [Google Scholar]
- 48.Hebrank FX, Storch T, Eberhardt K. Determination of magnetostimulation thresholds and their effective control during clinical MRI. Technical Report. 2000 [Google Scholar]
- 49.Davids M, Guérin B, Schmelz M, Schad LR, Wald LL. Reduction of peripheral nerve stimulation (PNS) using pre-excitation targeting the potassium system (PRE-TAPS); Proceedings of the 26th Annual Meeting of ISMRM; Paris, France. 2018. [Google Scholar]
- 50.Daube JR, Rubin DI. Nerve conduction studies. Aminoff’s Electrodiagnosis in Clinical Neurology. 2012;6:290–6. [Google Scholar]
- 51.Groppa S, Oliviero A, Eisen A, Quartarone A, Cohen L, Mall V, KaelinLang A, Mima T, Rossi S, Thickbroom G, et al. A practical guide to diagnostic transcranial magnetic stimulation: report of an IFCN committee. Clin Neurophysiol. 2012;123:858–882. doi: 10.1016/j.clinph.2012.01.010. [DOI] [PMC free article] [PubMed] [Google Scholar]
Associated Data
This section collects any data citations, data availability statements, or supplementary materials included in this article.
Supplementary Materials
Figure S1: Magnetic fields produced by the three gradient coils (top to bottom: BG1, BG2, HG1) in central coronal and sagittal planes, scaled to a gradient strength of 10 mT/m. The colorbar for the body gradients BG1 and BG2 is scaled differently (max: 4.0 mT), than for the head gradient, HG1 (max: 2.0 mT). Note that in this plot of the magnetic field, the simple linear “gradient” is not visible due to the concomitant magnetic fields (the linear gradient is only visible in a plot of the Bz field component).
Figure S2: electric field maps (maximum intensity projection) induced by the BG2 coil in the female (top) and the male body model (bottom), scaled to a slew rate of 100 T/m/s. For better visibility, the electric fields in bone are set to zero (the electric field in the bones is usually very high and would dominate the color scale otherwise).
Figure S3: Maxima of the neural activation function (i.e., second derivative of the electric field projected onto the nerve tracks) induced by the BG2 coil in the female (top) and male (bottom) body models at slew rate of 100 T/m/s. Only the 10% greatest activation function values are shown for clarity.
Figure S4: Simulated PNS threshold curves for BG1 and BG2 (X and Z axes) and for HG1 (Y and Z axes) in terms of the minimum gradient magnitude as a function of the pulse duration for trapezoidal current waveforms. For these gradient axes, the experimental setup did not achieve significant stimulation (i.e., no experimental data is shown). The shaded grey region is the experimentally accessible region.


