Abstract
Purpose
To investigate the effect of a frequency drift of the static magnetic field on three-dimensional (3D) chemical exchange saturation transfer (CEST) MRI based on glycosaminoglycans (GAG) of articular cartilage at 7T and to introduce a retrospective correction method that utilizes the phase images of the gradient echo (GRE) readout.
Methods
Repeated gagCEST and B0 measurements were performed in a glucose model solution and in vivo in the knee joint of three healthy volunteers at 7T. Phase images of the modified 3D rectangular spiral centric reordered GRE CEST sequence were used to quantify and compensate the apparent frequency drift in repeated gagCEST measurements.
Results
The frequency drift of the MRI scanner strongly influences the gagCEST signal in the articular cartilage of the human knee joint. The gagCEST signal in the articular cartilage is changed by 0.18%/Hz while an average drift of 0.7 ± 0.2 Hz/min was observed. The proposed correction method can be applied retrospectively without the need of additional measurements and provides improved comparability, and reproducibility for gagCEST studies. This correction method may also be of interest for other applications of CEST MRI.
Conclusion
Prospective or retrospective correction of the frequency drift of the MRI scanner is essential for reproducible gagCEST measurements. The proposed retrospective correction method fulfills this requirement without the need of additional measurements.
Introduction
In chemical exchange saturation transfer (CEST) imaging, the selective saturation of chemically exchanging protons enables the indirect detection of metabolites or mobile proteins of millimolar concentration (1,2). Variation of the saturation offset frequency Δω leads to the so-called Z-spectrum in each voxel of the CEST MRI acquisition. CEST MRI is a quickly developing field with a large variety of in vivo applications (3–5). One of them is the quantification of glycosaminoglycan (GAG) content in cartilage by utilizing exchangeable hydroxyl protons, called gagCEST (6,7). GAGs are side chains of the proteoglycan macromolecules, which provide the ability to attract and store water and are responsible for the compressive load bearing properties of cartilage. Cartilage degeneration is accepted to be one of the predominant initiating events during the onset of osteoarthritis (OA) (8–10). Even before macroscopic alterations become apparent, changes in cartilage architecture and extracellular matrix composition have been reported (11). In particular, a decrease in proteoglycan content has been observed (8), which makes gagCEST MRI a promising technique for detection of the early onset of OA.
Especially for CEST effects close to the water resonance, the high RF power used for the selective saturation results in strong, water-T2-dependent spillover effects from the direct water saturation (12,13). Hence, in vivo CEST MRI contrast is highly susceptible to local variations of the static magnetic field B0. In principle, intrinsic B0 correction can be performed by acquiring a full Z-spectrum and shifting the minimum of the direct water saturation to 0 ppm (14). However, this is only feasible for low amplitudes of the saturation field B1 (15). Alternatively, separate B0 maps can be acquired for a more accurate estimation of the local B0 field. For example, methods like WASSR (16), WASABI (17), multiple echoes (18,19) and echo shifts (20) of repeated measurements have been developed and used. The importance to correct for local B0 variations in CEST has already been discussed in detail (21,22). For gagCEST imaging in the articular cartilage in the knee, it has been shown that external B0 mapping and accurate corrections are essential due to short T2 and high saturation amplitude (7,19,23).
The B0 field varies locally but is generally stable over time. However, gradient intensive MR sequences deposit power that heat various scanner components (24–26) can result in a drift of the B0 field. The severity of such gradient-induced field drifts depends on the scanner and the gradient duty-cycle (25–27). In earlier CEST studies, a change of signal intensity over the course of the CEST experiment has been observed, which was suspected to be “similar to the baseline drift found in fMRI” (28). Whereas this led to the introduction of a baseline correction that uses multiple unsaturated images over the course of a CEST experiment, the direct effect of the field drift on the CEST contrast was not investigated further. It has been shown that frequency drift is also a problem in other fields of MRI, such as diffusion MRI, fMRI, and MR spectroscopy. Multiple correction techniques have already been established (26,27,29). However, they either require additional measurements or are not applicable for CEST MRI.
In this study, we investigate the effects of a frequency drift of a MRI scanner on gagCEST contrast in the human knee at 7T. We show that the observed frequency drift of 0.7 Hz/min significantly alters the gagCEST contrast. Furthermore, we propose a correction approach that combines previous methods, namely the acquisition of a separate B0 map and the utilization of phase images of the GRE readout. This allows a compensation of the frequency drift during post-processing without further adjustments to the protocol. We compare this new dynamic correction method to the standard B0 correction that uses only the first separate B0 map. The quality of the method is tested by comparing it a correction using multiple, interpolated B0 maps.
Methods
Magnetization preparation
For frequency selective saturation, a train of 5 Gaussian pulses with 100 ms duration, saturation power B1=1.5 µT (B1rms = 1.85µT), and 99% duty cycle with spoiling after each pulse was used, based on parameters optimized in other studies (30,31). Each gagCEST acquisition consisted of 41 saturation offsets equally distributed between −2 and 2 ppm, in steps of 0.1 ppm, which form the Msat acquisitions. For normalization and baseline correction (28), six additional images with offsets far off-resonant from water at −300 ppm, dubbed M0, were acquired as pairs of two before, after, and in the middle of the CEST acquisition. A long delay of 4 s before each Msat and with additional 6 s before each M0 allowed for the complete recovery of the water signal to exclude any influences due to saturation. The time stamp of each offset was saved in a log file. For separate B0 maps, the WASABI method (17) was used with a 5 ms rectangular pulse with B1 = 3.7 µT (B1rms= 4.57). The same GRE readout as the CEST acquisition was used with 41 evenly distributed offsets between −2 and 2 ppm. The WASABI method was chosen instead of the WASSR approach, because of the higher accuracy in mapping the local B0 field (17).
3D MRI pulse sequence
Following the magnetization preparation, fast 3D acquisition was achieved using the snapshot-CEST sequence (32) with TR = 4.6 ms, TE = 2.4 ms, FA = 5°, matrix 176 × 166 × 12, FOV = 150 × 141 × 36 mm3, GRAPPA = 2, elongation E = 0.6, and elliptical scanning. The rectangular spiral centric reordering allowed for a fast acquisition of k-space with reduced in-plane blurring. Both TE and TR were chosen as small as possible in order to maximize the gagCEST contrast. With this setting the number of k-space lines is the main limitation for the preservation of the CEST contrast in the MR images as explained by Zaiss et al. (32). For improved phase maps, the raw images were reconstructed in MATLAB (MathWorks, Natick, MA, USA) using a modification of Walsh’s adaptive coil combination algorithm (33) by Inati et al. (34) that enforces a smoothing similar to a homodyne-filtered phase image.
Acquisition Protocol
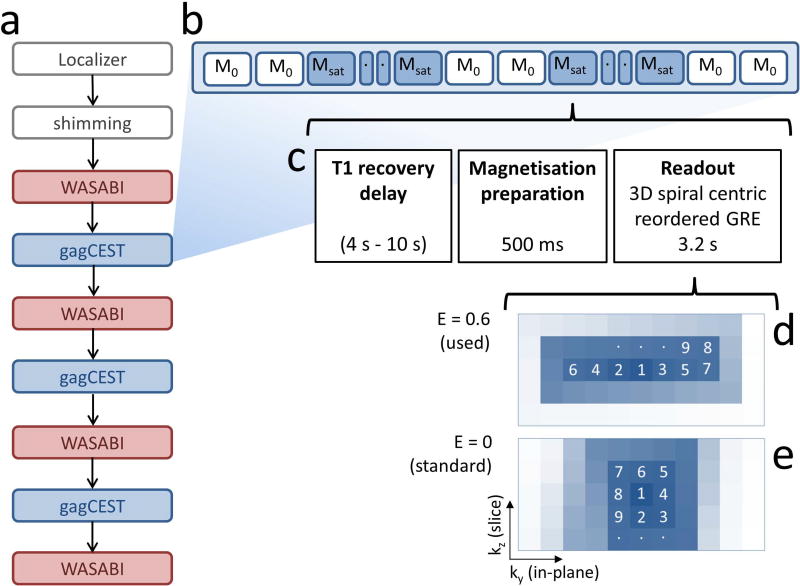
All experiments were performed on a Siemens 7T whole-body MRI scanner (Siemens Healthineers, Erlangen, Germany) using a circularly polarized (CP) transmit / 28-channel receive array knee coil (Quality Electrodynamics, Mayfield Village, OH, USA). After localization and shimming, the WASABI and gagCEST acquisitions were performed in an alternating fashion as illustrated in Figure 1, with 4 WASABI acquisitions and 3 identical gagCEST acquisitions in total. The duration of the complete protocol was 50 min.
Figure 1.
Flowchart of the measurements for investigating the impact of frequency drift on gagCEST (a) with schematic view of the order of M0 and Msat acquisitions during the 3D gagCEST sequence (b), consisting of T1 recovery block, magnetization preparation block, and readout block (c). The 3D centric rectangular spiral GRE sequence (d) reduces in-plane blurring in comparison to the standard spiral readout (e), due to an elongation E = 0.6 of the spiral in the in-plane phase encoding direction ky. The numbers in this schematic image indicate the order of k-space line acquisitions.
Phantom preparation and human knee cartilage study
To mimic gagCEST contrast in articular cartilage, a model solution with 20 mM glucose, 3.4% (w/v) Agarose, and Gadavist® (Bayer Pharma AG, Berlin, Germany) was prepared, resulting in T1 = 1.6 s and T2 = 60 ms at 7T, which is similar to values obtained in articular cartilage at 7T (35).
All human knee scans were performed with approval from the Institutional Review Board of the New York University Langone Medical Center and after signed informed consent was obtained. The left knee joints of 3 healthy volunteers age 29–32 were investigated (2 female, 1 male), with the male volunteer being measured a second time after one month.
B0 correction methods
Three different B0 correction methods were compared in this study, which were all performed on a voxel-by-voxel basis:
For the standard B0 correction, only the B0 map of the first WASABI acquisition was used, corresponding to the implementation in other studies (23,36,37).
For the dynamic WASABI correction, all WASABI B0 maps were linearly interpolated over time to get ΔB0(t). Then, every offset of the gagCEST acquisition was corrected using ΔB0 at its specific time of acquisition. For maps of the relative shift of the static magnetic field δB0(t), the WASABI B0 map at t = 0 was subtracted from the interpolated ΔB0 maps.
- For the dynamical combined WASABI/phase correction, the phase images of each pair of M0 images were averaged to improve SNR. The relative shift δB0(t) was calculated based on equation 1, with phase θ in rad and time t’ of the first M0 acquisition. In order to obtain absolute ΔB0(t), δB0(t) was extrapolated linearly to t = 0, the time of the first WASABI acquisition, and shifted to the corresponding value of the WASABI B0 map.
[1]
Quantification of gagCEST contrast
The gagCEST contrast gagCESTM0 (23) is evaluated as the average of at Δω = 0.9 ppm, 1.0 ppm, and 1.1 ppm.
Influence of B0 shift
To quantify the effect of B0 shifts on gagCEST data, a Z-spectrum corrected with the dynamic WASABI correction averaged over a ROI in the femoral cartilage of subject 1 was used. The interpolated and smoothed Z-spectrum was shifted by values between −0.05 ppm and 0.05 ppm ( = 14.8 Hz) in steps of 0.0025 ppm ( = 0.74 Hz) along the offset axis and the corresponding MTRasym curves were calculated for each shift.
Results
The 3D snapshot-CEST GRE provided good signal to noise ratio (SNR), with SNR > 90 across the ROIs in the articular cartilage in all subjects. The modified adaptive combine algorithm removed the background phase sufficiently, hence phase unwrapping was not necessary.
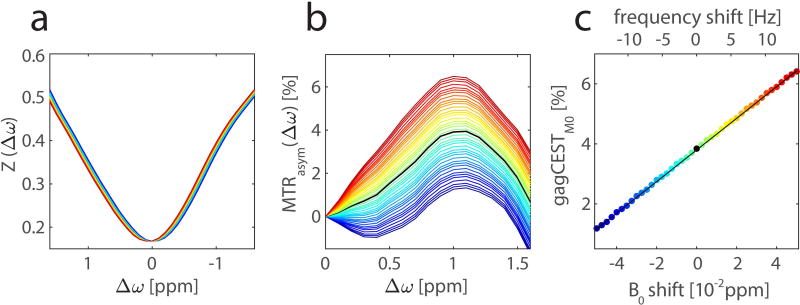
Figure 2 shows data averaged and smoothed for a ROI on femoral cartilage of subject 1. As expected, the MTRasym curve peaks at 1.0 – 1.1 ppm with a maximum of MTRasym(1.1 ppm) = 3.94%. Whereas the artificially introduced B0 shift is barely visible in the Z-spectra, MTRasym curves show a strong dispersion. Note that a positive shift of the center frequency of the scanner results in a shift of the Z-spectrum towards positive offsets, leading to an increase in MTRasym. Since the Z-spectrum has only minimal curvature around 1 ppm, gagCESTM0 shows a linear dependence on the B0 shift. A linear fit was applied to the gagCESTM0 values, which gives a slope of 0.53%/0.01 ppm (0.18%/Hz).
Figure 2.
Influence of a B0 shift on gagCEST data. Smoothed Z-spectra from an ROI in the femoral cartilage of a 32-year-old healthy volunteer at 7T with B0 shifts of −0.05 to 0.05 ppm, frequency shift from −14.85 Hz to 14.85 Hz, respectively, are plotted from blue to red (a). Corresponding MTRasym curves (b) show a strong dispersion upon the B0 shift. In the considered range, the gagCEST contrast depends linearly on the B0 shift with a slope of 0.53%/0.01 ppm (0.18%/Hz) (c). The corresponding linear fit of the gagCESTM0 values is illustrated with a black line.
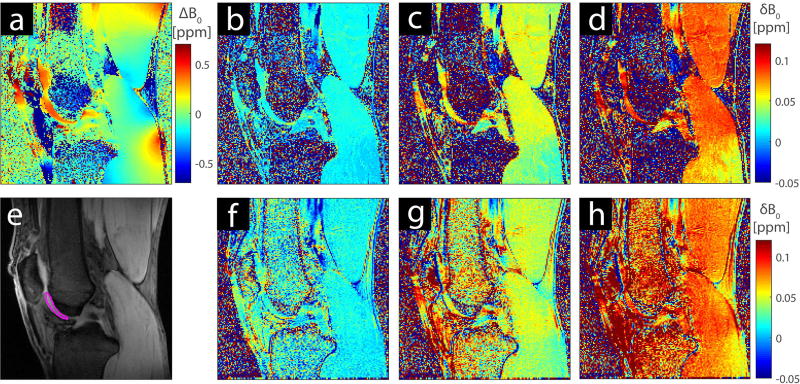
Figure 3 shows the first B0 map and maps of the relative change of the B0 field over time in the knee of one volunteer. The first WASABI B0 map (Fig. 3a) shows local inhomogeneity of up to ±0.4 ppm even after rigorous shimming of the volume was performed. The relative field shifts estimated by the WASABI B0 maps (Figs. 3b, 3c, and 3d) and the M0 phase images (Figs. 3f, 3g, and 3h) are in good agreement. Local variations of the field drift are visible for both methods. For example, the field drift in the distal part of the gastrocnemius is 0.02 ppm smaller than in the other parts of the muscle.
Figure 3.
B0 map of the left knee of a 32-year-old healthy volunteer at 7T from the first WASABI acquisition (a) and M0 image of the same slice with ROI (e). Interpolated WASABI B0 maps showing the B0 shift δB0 at t = 6 min (b), t = 18 min (c), and t = 30 min (d) relative to the first B0 map (a) at t=0. The δB0 maps obtained using the GRE phase images at t = 6 min (f), t = 18 min (g), and t = 30 min (h) are smooth and show the similar local variations.
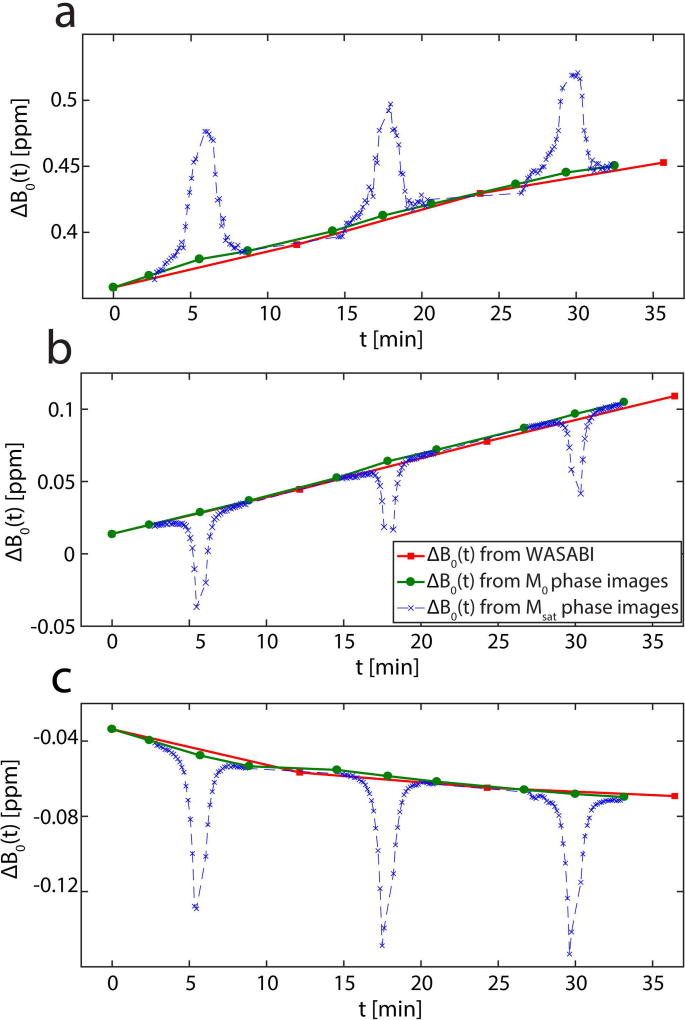
ROI-averaged evaluation of the WASABI B0 maps yielded a positive and linear frequency drift of 0.7 ± 0.2 Hz/min during the measurements on the human subjects, as illustrated exemplarily for one volunteer in Figure 4a. A positive linear drift and a negative non-linear drift were observed during separate measurements of the glucose phantom (Figs. 4b and 4c). The decision of linearity vs. non-linearity is based on the coefficient of determination R2. More details about this decision together with fit results of a linear fit (Tab. S1), an exponential fit (Tab. S2) and the visual representation of both fits on ROI-averaged data of the glucose phantom (Fig. S1) can be found in the Supplementary Information. Figure 4 also shows the estimation of ΔB0(t) using phase images compared to the estimation using the WASABI B0 maps. Phase maps of Msat images are clearly affected by the pre-saturation, which is revealed as a dip or peak in the estimated ΔB0(t). The ROI based comparison confirms the agreement of ΔB0(t) between the combined WASABI/phase approach using the M0 images and the direct measurement using the WASABI B0 maps.
Figure 4.
ROI averaged ΔB0 as a function of measurement time t in the femoral cartilage of a 32-year-old healthy volunteer (a) and in a glucose phantom after an idle period of the MRI scanner (b) and after a gradient intensive fMRI study (c) acquired at 7T. Data points are calculated using WASABI acquisitions (red squares) phase images of M0 images (green circles) and phase images of Msat images (blue crosses). The ΔB0 from WASABI and M0 phase images are in good agreement, whereas the ΔB0 of the Msat phase images clearly depends on the CEST saturation offset.
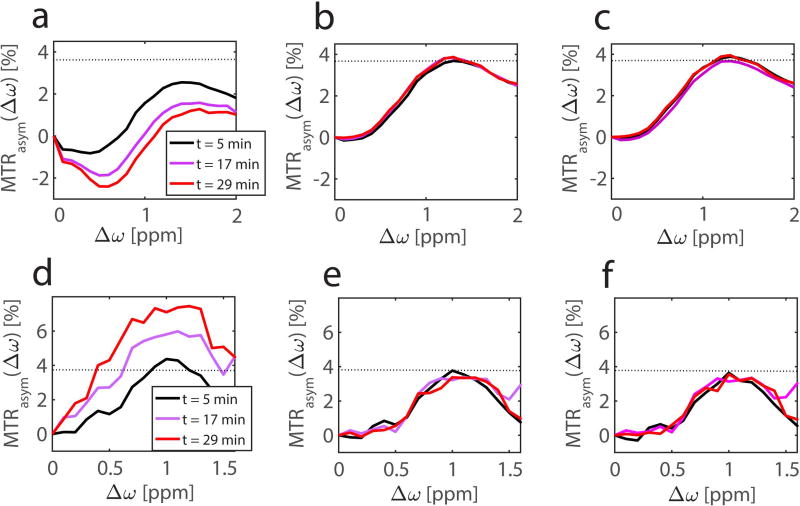
Accordingly MTRasym values of the three identical CEST measurements are significantly different if the frequency drift is not compensated, as shown for the same ROI in Figures 5a and 5d. As expected, MTRasym values around Δω = 1.0 ppm decrease upon the negative frequency drift and vice versa. Upon compensation with the dynamic WASABI correction approach, the differences vanish and almost identical MTRasym curves are obtained (Figs. 5b and 5e). The same holds for the dynamic WASABI/phase correction (Fig. 5c and 5f). Note that the MTRasym curve of the first CEST acquisition, which directly follows the first B0 map, is already significantly altered unless the dynamic correction is applied.
Figure 5.
MTRasym curves at different time relative to the first WASABI acquisition of a ROI in the glucose phantom (top row) and in a ROI in the femoral cartilage of a 32-year-old healthy volunteer (bottom row) at 7T. The MTRasym curves of data corrected with the standard B0 correction (a,d) vary with acquisition time, whereas the data corrected with dynamic WASABI (b,e) or WASABI/phase correction method (c,f) are stable over time. The dotted line shows the maximum of the MTRasym curve of the first acquisition using the dynamic WASABI correction.
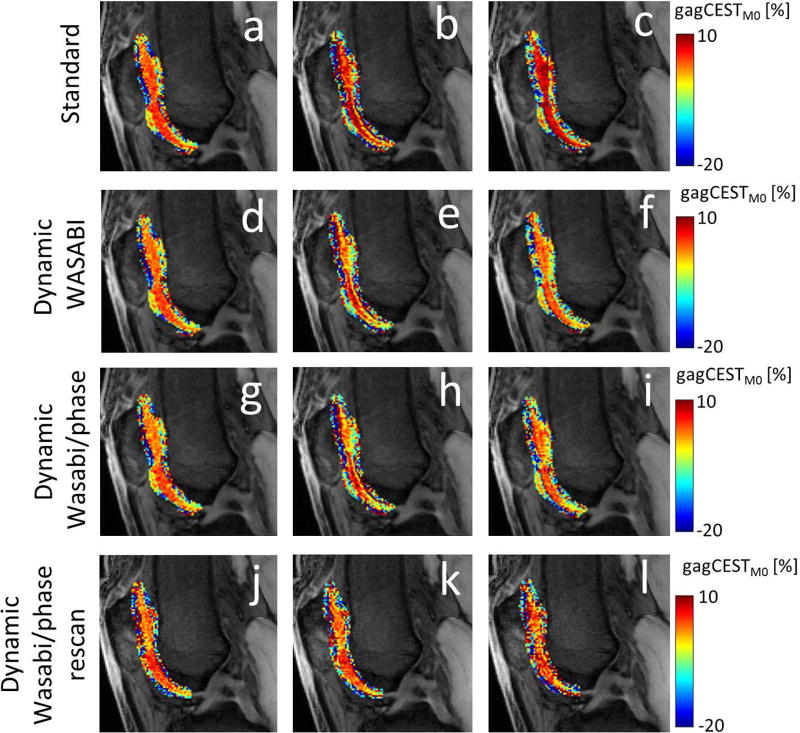
Figure 6 shows a slice from the knee scan of subject 1, in which a M0 image is superimposed with gagCESTM0 contrast in femoral and patella cartilage tissues. An overall increase of the gagCEST contrast is visible if the frequency drift is not compensated (Figs. 6a-c). The gagCEST contrast remains much more stable upon correction of the frequency drift. Both dynamic methods produce very similar results, supporting the applicability of phase maps for frequency drift estimation. For both methods, the gagCEST contrasts of the first and third CEST acquisitions are almost identical. The variations in the gagCEST contrast of the second CEST acquisition (Figs. 6e and 6h) most likely originate from a small displacement due to motion of the subject, which could not be compensated any better. The last row in Figure 6 shows gagCEST contrast from a repeated measurement with the same subject, indicating the repeatability and reproducibility of the presented method.
Figure 6.
Cropped M0 images superimposed with gagCESTM0 contrast in patellar and femoral cartilage from identical measurements from a 32-year-old healthy volunteer, acquired at t = 5 min (a,d,g,j), t =17 min (b,e,h,k), and t =29 min (c,f,I,l). The gagCESTM0 contrast of data using the standard B0 correction (a,b,c) shows an increase over time, whereas the dynamic WASABI correction (d,e,f) and the dynamic WASABI/phase correction method (g,h,i) provide a stable contrast. The last row represents data from the same subject acquired one month later (j,k,l).
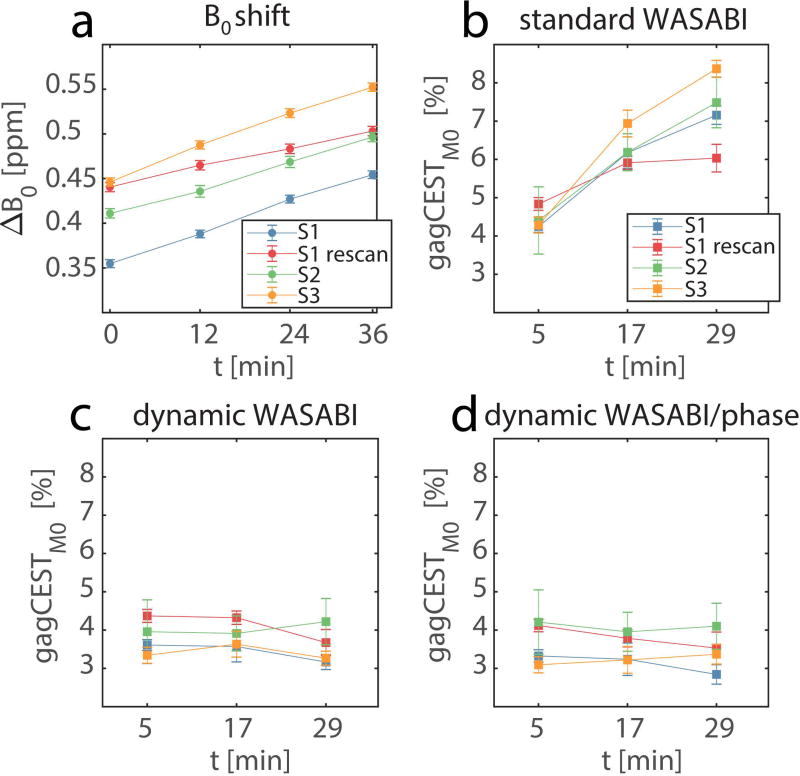
The results of the measurements from all volunteers are summarized in Figure 7. As mentioned above, the frequency drift is similar in all measurements with an average of 0.7 ± 0.2 Hz/min. Both corrections, dynamic WASABI and dynamic WASABI/phase, show good stability of the gagCESTM0 contrast across subjects and time. In contrast, the standard B0 correction method shows a clear trend towards higher gagCEST contrast and stronger dispersion with increasing time in all subjects. The ROI averaged dynamic WASABI corrected gagCESTM0 = 3.75% ± 0.41% and dynamic WASABI/phase corrected gagCESTM0 = 3.57% ± 0.46% of all acquisitions are in good agreement with the results of other studies with comparable saturation settings (23,30).
Figure 7.
B0 drift (a) and gagCESTM0 values (b-d) averaged over ROIs in the femoral cartilage in all subjects (S1-S3) for different correction methods. Each subject is plotted separately as a function of measurement time t. Data corrected with standard B0 correction (b) shows a strong increase and a larger dispersion of values over time. Data corrected with the dynamic WASABI (c) or the dynamic combined WASABI/phase approach (d) show good stability over time. Error bars represent the standard deviation of the mean.
Discussion
In this study, we identified the frequency drift of the MRI scanner as an important factor compromising reproducibility and stability of CEST measurements, in particular gagCEST measurements. To compensate this effect, a straight forward correction method using the GRE phase images is introduced. The differences in the gagCEST contrasts measured at 3T between damaged and healthy cartilage and measured at 7T between repaired and healthy cartilage were 0.6 ± 1.4% (19) and 2.8 ± 2.8% (7), respectively. Hence, it is essential that researchers are aware of the importance to correct for this frequency drift. Moreover, experiments to optimize the gagCEST contrast require the acquisition of multiple measurements subsequently (36) and thus are prone to misinterpretation if no frequency drift compensation is applied.
With proper configuration of WASSR or WASABI acquisition, B0 maps with accuracy below 0.3 Hz are possible (16,17). While there are attempts to further increase the accuracy of the WASSR technique (38), this accuracy would be lost within the first minute of acquisition following the B0 mapping due to the global frequency drift of 0.7 Hz/min observed in this study. Besides, even higher frequency drifts of up to 3 Hz/min have been observed in other studies (29,39). However, even with smaller drifts, delays of less than 10 minutes are sufficient to alter the gagCEST contrast drastically.
Other CEST effects that are evaluated with MTRasym may also be affected by this frequency drift. Especially CEST effects close to the water resonance (5,40–42). In particular, subtraction methods such as glucoCEST (43–45) could be affected. However, depending on the water relaxation parameters, saturation settings, and static field strength, even CEST effects further away from the water resonance may be altered significantly by a frequency drift. In cases where methods like Lorentzian or Bloch fitting are applicable, the B0 drift can be compensated, since these methods often include B0 as a fitting parameter.
Using phase images in MRI always comes with certain restrictions, namely phase jumps due to errors in the phase unwrapping process or false values due to low SNR. However, the implemented adaptive combine algorithm provides excellent smoothing of the phase images of M0 acquisitions, without the need for further unwrapping methods. Phase images of Msat acquisitions with saturation close to water are not suitable for estimating the frequency shift, due to the saturation induced dip in the phase (Fig. 4). Even extensive spoiling (tspoil = 20 ms) after the saturation train did not reduce this effect. It cannot result from low SNR alone, since a clear dip is visible instead of strong fluctuations. Further investigations are necessary to identify the source of this effect, maybe allowing the utilization of all CEST images to track the frequency drift in the future. Other studies also successfully used phase maps of two or more echo times for B0 mapping (19,46). These methods need to repeat the readout with varying echo times but provide absolute B0 maps. Hence by using only M0 images for this mapping, a reduction in measurement time by eliminating the need for a separate B0 map may be feasible.
Since the frequency drift observed during the measurement on the human subjects is linear (Fig. 7a), a linear fit model could improve the stability of the WASABI/phase correction approach. However, since also non-linear drifts are possible, as observed in the phantom study, the linearity of the drift would have to be verified first. We showed that even the more general linear interpolation approach provides sufficient stability for in vivo application.
The observed difference in the direction of the drifts between the phantom experiment and the in vivo study is most likely related to a gradient-intensive fMRI study prior to the phantom measurement, which heated up the gradient system. A repetition of the phantom measurement after an idle period of the scanner also showed a positive linear frequency drift (Fig. 4). More extensive cooling of the gradient systems could avoid problems induced by such gradient-intensive fMRI or similar studies.
All venders now provide an option for dynamic adjustment of the center frequency for state-of-the-art scanners namely “Dynamic Stabilization” on Philips, “Real Time Field Adjustment” on General Electric, and “Frequency Stabilization” on Siemens (29). However, these are not readily available for all scanners. Furthermore these methods, are prospective and have to be implemented with caution (29). Our proposed method can be applied during post-processing and allows correction of the data retrospectively if raw data or phase images are available, which is a realistic assumption since custom GRE sequences are the method of choice for gagCEST MRI (7,23,36,37).
Furthermore, the voxel based character of the WASABI/phase correction also has the potential to correct CEST contrast for subtle local changes of the B0 field due to motion or changes in temperature without the need of any additional measurement time, which may not be possible by a simple global frequency adjustment.
Conclusion
The main finding of this study is the high sensitivity of gagCEST measurements to drifts of the static magnetic field. By introducing a retrospective correction method based on GRE phase images, we were able to show that errors due to this frequency drift could be eliminated in post-processing while offering the potential to correct even dynamic local changes of B0, without additional measurement time.
Supplementary Material
Table S1: Results of a linear fit y=a*x + b to ROI averaged ΔB0 of all measurements.
Table S2: Results of an exponential fit y = a*exp(b*x) + c to ROI averaged ΔB0 of the first phantom measurement.
Figure S1: B0 drift in glucose phantom after gradient-intensive fMRI measurement prior to the study. The linear fit (red line) clearly does not represent the data points (R2 = 0.8151), the exponential fit (blue line) shows a better correspondence to the data points (R2 = 0.9993).
Acknowledgments
This study was supported by National Institutes of Health (NIH) grants R01EB016045, R01-AR060238, R01-AR067156, and R01-AR068966.
References
- 1.Wolff SD, Balaban RS. NMR Imaging of Labile Proton Exchange. J. Magn. Reson. 1990;86:164–169. [Google Scholar]
- 2.Ward K, Aletras A, Balaban R. A New Class of Contrast Agents for MRI Based on Proton Chemical Exchange Dependent Saturation Transfer (CEST) J. Magn. Reson. 2000;143:79–87. doi: 10.1006/jmre.1999.1956. [DOI] [PubMed] [Google Scholar]
- 3.Zhou J, Payen J-F, Wilson D, Traystman R, Van Zijl P. Using the amide proton signals of intracellular proteins and peptides to detect pH effects in MRI. Nat. Med. 2003;9:1085–1090. doi: 10.1038/nm907. [DOI] [PubMed] [Google Scholar]
- 4.Walker-Samuel S, Ramasawmy R, Torrealdea F, et al. In vivo imaging of glucose uptake and metabolism in tumors. Nat. Med. 2013;19:1067–72. doi: 10.1038/nm.3252. [DOI] [PMC free article] [PubMed] [Google Scholar]
- 5.Cai K, Haris M, Singh A, Kogan F, Greenberg JH, Hariharan H, Detre JA, Reddy R. Magnetic resonance imaging of glutamate. Nat. Med. 2012;18:302–306. doi: 10.1038/nm.2615. [DOI] [PMC free article] [PubMed] [Google Scholar]
- 6.Ling W, Regatte RR, Navon G, Jerschow A. Assessment of glycosaminoglycan concentration in vivo by chemical exchange-dependent saturation transfer (gagCEST) Proc. Natl. Acad. Sci. U. S. A. 2008;105:2266–70. doi: 10.1073/pnas.0707666105. [DOI] [PMC free article] [PubMed] [Google Scholar]
- 7.Schmitt B, Zbyn S, Stelzeneder D. Cartilage Quality Assessment by Using Glycosaminoglycan Chemical Exchange Saturation Transfer and 23Na MR Imaging at 7 T. Radiology. 2011;260:257–264. doi: 10.1148/radiol.11101841. [DOI] [PubMed] [Google Scholar]
- 8.Blumenfeld J, Majumdar S, Krug R. Advances in MRI of the Knee for Osteoarthritis. 2010. Singapore: World Scientific Publishing Co. Pte. Ltd.; pp. 207–228. [Google Scholar]
- 9.Eckstein F, Burstein D, Link TM. Quantitative MRI of cartilage and bone: degenerative changes in osteoarthritis. NMR Biomed. 2006;19:822–854. doi: 10.1002/nbm.1063. [DOI] [PubMed] [Google Scholar]
- 10.Peterfy CG, Guermazi A, Zaim S, et al. Whole-organ Magnetic Resonance Imaging Score (WORMS) of the knee in osteoarthritis. Osteoarthr. Cartil. 2004;12:177–190. doi: 10.1016/j.joca.2003.11.003. [DOI] [PubMed] [Google Scholar]
- 11.Venn M, Maroudas A. Chemical composition and swelling of normal and osteoarthrotic femoral head cartilage. Ann. Rheum. Dis. 1977;36:121–9. doi: 10.1136/ard.36.2.121. [DOI] [PMC free article] [PubMed] [Google Scholar]
- 12.Zaiss M, Bachert P. Chemical exchange saturation transfer (CEST) and MR Z-spectroscopy in vivo : a review of theoretical approaches and methods. Phys. Med. Biol. 2013;58:221–269. doi: 10.1088/0031-9155/58/22/R221. [DOI] [PubMed] [Google Scholar]
- 13.van Zijl PCM, Sehgal AA. Proton Chemical Exchange Saturation Transfer (CEST) MRS and MRI. eMagRes. 2016;5:1307–1332. [Google Scholar]
- 14.Stancanello J, Terreno E, Delli Castelli D, Cabella C, Uggeri F, Aime S. Development and validation of a smoothing-splines-based correction method for improving the analysis of CEST-MR images. Contrast Media Mol. Imaging. 2008;3:136–149. doi: 10.1002/cmmi.240. [DOI] [PubMed] [Google Scholar]
- 15.van Zijl PCM, Lam WW, Xu J, Knutsson L, Stanisz GJ, Stanisz GJ, Contrast MT. Magnetization Transfer Contrast and Chemical Exchange Saturation Transfer MRI. Features and Analysis of the Field-Dependent Saturation Spectrum. Neuroimage. 2017 doi: 10.1016/j.neuroimage.2017.04.045. [DOI] [PMC free article] [PubMed] [Google Scholar]
- 16.Kim M, Gillen J, Landman BA, Zhou J, Van Zijl PCM. Water Saturation Shift Referencing (WASSR) for Chemical Exchange Saturation Transfer (CEST) Experiments. Magn. Reson. Med. 2009;61:1441–1450. doi: 10.1002/mrm.21873. [DOI] [PMC free article] [PubMed] [Google Scholar]
- 17.Schuenke P, Windschuh J, Roeloffs V, Ladd ME, Bachert P, Zaiss M. Simultaneous Mapping of Water Shift and B1 (WASABI)-Application to Field-Inhomogeneity Correction of CEST MRI Data. Magn. Reson. Med. 2017;77:571–580. doi: 10.1002/mrm.26133. [DOI] [PubMed] [Google Scholar]
- 18.Keupp J, Eggers H. CEST-Dixon MRI for Sensitive and Accurate Measurement of Amide Proton Transfer in Humans at 3T. Intl. Soc. Mag. Reson. Med. 2010;18:2010. [Google Scholar]
- 19.Wei W, Jia G, Flanigan D, Zhou J, Knopp M V. Chemical exchange saturation transfer MR imaging of articular cartilage glycosaminoglycans at 3T: Accuracy of B0 Field Inhomogeneity corrections with gradient echo method. Magn. Reson. Imaging. 2014;32:41–47. doi: 10.1016/j.mri.2013.07.009. [DOI] [PMC free article] [PubMed] [Google Scholar]
- 20.Togao O, Keupp J, Hiwatashi A, Yamashita K, Kikuchi K, Yoneyama M, Honda H. Amide Proton Transfer Imaging of Brain Tumors Using a Self-Corrected 3D Fast Spin-Echo Dixon Method: Comparison With Separate B0 Correction. Magn. Reson. Med. 2017;77:2272–2279. doi: 10.1002/mrm.26322. [DOI] [PubMed] [Google Scholar]
- 21.Zhou J, Blakeley JO, Hua J, Kim M, Laterra J, Pomper MG, Van Zijl PCM. Practical Data Acquisition Method for Human Brain Tumor Amide Proton Transfer (APT) Imaging. Magn. Reson. Med. 2008;60:842–849. doi: 10.1002/mrm.21712. [DOI] [PMC free article] [PubMed] [Google Scholar]
- 22.van Zijl PCM, Yadav NN. Chemical Exchange Saturation Transfer (CEST): What is in a Name and What Isn’t? Magn. Reson. Med. 2011;65:927–948. doi: 10.1002/mrm.22761. [DOI] [PMC free article] [PubMed] [Google Scholar]
- 23.Krishnamoorthy G, Nanga RPR, Bagga P, Hariharan H, Reddy R. High Quality Three-Dimensional gagCEST Imaging of In Vivo Human Knee Cartilage at 7 Tesla. Magn. Reson. Med. 2017;77:1866–1873. doi: 10.1002/mrm.26265. [DOI] [PMC free article] [PubMed] [Google Scholar]
- 24.Foerster BU, Tomasi D, Caparelli EC. Magnetic Field Shift due to Mechanical Vibration in Functional Magnetic Resonance Imaging. Magn. Reson. Med. 2005;54:1261–1267. doi: 10.1002/mrm.20695. [DOI] [PMC free article] [PubMed] [Google Scholar]
- 25.Harris AD, Glaubitz B, Near J, John Evans C, Puts NAJ, Schmidt-Wilcke T, Tegenthoff M, Barker PB, Edden RAE. Impact of Frequency Drift on Gamma-Aminobutyric Acid-Edited MR Spectroscopy. Magn. Reson. Med. 2014;72:941–948. doi: 10.1002/mrm.25009. [DOI] [PMC free article] [PubMed] [Google Scholar]
- 26.El-Sharkawy AM, Schär M, Bottomley PA, Atalar E. Monitoring and correcting spatio-temporal variations of the MR scanner’s static magnetic field. MAGMA. 2006;19:223–236. doi: 10.1007/s10334-006-0050-2. [DOI] [PMC free article] [PubMed] [Google Scholar]
- 27.Lange T, Zaitsev M, Buechert M. Correction of Frequency Drifts Induced by Gradient Heating in 1H Spectra Using Interleaved Reference Spectroscopy. J. Magn. Reson. Imaging. 2011;33:748–754. doi: 10.1002/jmri.22471. [DOI] [PubMed] [Google Scholar]
- 28.Jones CK, Huang A, Xu J, et al. Nuclear Overhauser enhancement (NOE) imaging in the human brain at 7T. Neuroimage. 2013;77:114–124. doi: 10.1016/j.neuroimage.2013.03.047. [DOI] [PMC free article] [PubMed] [Google Scholar]
- 29.Vos SB, Tax CMW, Luijten PR, Ourselin S, Leemans A, Froeling M. The Importance of Correcting for Signal Drift in Diffusion MRI. Magn. Reson. Med. 2017;77:285–299. doi: 10.1002/mrm.26124. [DOI] [PubMed] [Google Scholar]
- 30.Singh A, Haris M, Cai K, Kassey VB, Kogan F, Reddy D, Hariharan H, Reddy R. Chemical Exchange Saturation Transfer Magnetic Resonance Imaging of Human Knee Cartilage at 3 T and 7 T. Magn. Reson. Med. 2012;68:588–594. doi: 10.1002/mrm.23250. [DOI] [PMC free article] [PubMed] [Google Scholar]
- 31.Kogan F, Singh A, Cai K, Haris M, Hariharan H, Reddy R. Investigation of chemical exchange at intermediate exchange rates using a combination of chemical exchange saturation transfer (CEST) and spin-locking methods (CESTrho) Magn. Reson. Med. 2012;68:107–119. doi: 10.1002/mrm.23213. [DOI] [PMC free article] [PubMed] [Google Scholar]
- 32.Zaiss M, Ehses P, Scheffler K. Snapshot-CEST: Optimizing spiral-centric-reordered gradient echo acquisition for fast and robust 3D CEST MRI at 9.4 T. NMR Biomed. 2018:1–14. doi: 10.1002/nbm.3879. [DOI] [PubMed] [Google Scholar]
- 33.Walsh DO, Gmitro AF, Marcellin MW. Adaptive Reconstruction of Phased Array MR Imagery. Magn. Reson. Med. 2000;43:682–690. doi: 10.1002/(sici)1522-2594(200005)43:5<682::aid-mrm10>3.0.co;2-g. [DOI] [PubMed] [Google Scholar]
- 34.Inati SJ, Hansen MS, Peter K. A Solution to the Phase Problem in Adaptive Coil Combination. Proc. ISMRM 21. 2013;21:2672. [Google Scholar]
- 35.Regatte RR, Schweitzer ME. Ultra-High-Field MRI of the Musculoskeletal System at 7.0T. J. Magn. Reson. Imaging. 2007;25:262–269. doi: 10.1002/jmri.20814. [DOI] [PubMed] [Google Scholar]
- 36.Kogan F, Hargreaves BA, Gold GE. Volumetric Multislice GagCEST Imaging of Articular Cartilage: Optimization and Comparison with T1rho. Magn. Reson. Med. 2017;77:1134–1141. doi: 10.1002/mrm.26200. [DOI] [PMC free article] [PubMed] [Google Scholar]
- 37.Schreiner MM, Zbýň Š, Schmitt B, Weber M, Domayer S, Windhager R, Trattnig S, Mlynárik V. Reproducibility and regional variations of an improved gagCEST protocol for the in vivo evaluation of knee cartilage at 7T. Magn. Reson. Mater. Physics, Biol. Med. 2016;29:513–521. doi: 10.1007/s10334-016-0544-5. [DOI] [PubMed] [Google Scholar]
- 38.Müller-Lutz A, Matuschke F, Schleich C, Wickrath F, Boos J, Schmitt B, Wittsack HJ. Improvement of water saturation shift referencing by sequence and analysis optimization to enhance chemical exchange saturation transfer imaging. Magn. Reson. Imaging. 2016;34:771–778. doi: 10.1016/j.mri.2016.03.013. [DOI] [PubMed] [Google Scholar]
- 39.Sotiropoulos SN, Jbabdi S, Xu J, et al. Advances in diffusion MRI acquisition and processing in the Human Connectome Project. Neuroimage. 2013;80:125–143. doi: 10.1016/j.neuroimage.2013.05.057. [DOI] [PMC free article] [PubMed] [Google Scholar]
- 40.Cai K, Singh A, Roalf DR, Nanga RPR, Haris M, Hariharan H, Gur R, Reddy R. Mapping glutamate in subcortical brain structures using high-resolution GluCEST MRI. NMR Biomed. 2013;26:1278–1284. doi: 10.1002/nbm.2949. [DOI] [PMC free article] [PubMed] [Google Scholar]
- 41.Roalf DR, Nanga RPR, Rupert PE, et al. Glutamate imaging (GluCEST) reveals lower brain GluCEST contrast in patients on the psychosis spectrum. Mol. Psychiatry. 2017;22:1298–1305. doi: 10.1038/mp.2016.258. [DOI] [PMC free article] [PubMed] [Google Scholar]
- 42.Haris M, Cai K, Singh A, Hariharan H, Reddy R. In vivo mapping of brain myo-inositol. Neuroimage. 2011;54:2079–2085. doi: 10.1016/j.neuroimage.2010.10.017. [DOI] [PMC free article] [PubMed] [Google Scholar]
- 43.Nasrallah FA, Pagès G, Kuchel PW, Golay X, Chuang K-H. Imaging brain deoxyglucose uptake and metabolism by glucoCEST MRI. J. Cereb. Blood Flow Metab. 2013;33:1270–1278. doi: 10.1038/jcbfm.2013.79. [DOI] [PMC free article] [PubMed] [Google Scholar]
- 44.Xu X, Yadav NN, Knutsson L, et al. Dynamic Glucose-Enhanced (DGE) MRI: Translation to Human Scanning and First Results in Glioma Patients. Tomography. 2016;1:105–114. doi: 10.18383/j.tom.2015.00175. [DOI] [PMC free article] [PubMed] [Google Scholar]
- 45.Wang J, Weygand J, Hwang K-P, Mohamed ASR, Ding Y, Fuller CD, Lai SY, Frank SJ, Zhou J. Magnetic Resonance Imaging of Glucose Uptake and Metabolism in Patients with Head and Neck Cancer. Sci. Rep. 2016;6:30618. doi: 10.1038/srep30618. [DOI] [PMC free article] [PubMed] [Google Scholar]
- 46.Togao O, Yoshiura T, Keupp J, et al. Amide proton transfer imaging of adult diffuse gliomas: correlation with histopathological grades. Neuro. Oncol. 2014;16:441–448. doi: 10.1093/neuonc/not158. [DOI] [PMC free article] [PubMed] [Google Scholar]
Associated Data
This section collects any data citations, data availability statements, or supplementary materials included in this article.
Supplementary Materials
Table S1: Results of a linear fit y=a*x + b to ROI averaged ΔB0 of all measurements.
Table S2: Results of an exponential fit y = a*exp(b*x) + c to ROI averaged ΔB0 of the first phantom measurement.
Figure S1: B0 drift in glucose phantom after gradient-intensive fMRI measurement prior to the study. The linear fit (red line) clearly does not represent the data points (R2 = 0.8151), the exponential fit (blue line) shows a better correspondence to the data points (R2 = 0.9993).


