Abstract
Purpose
Recently, a new relayed nuclear Overhauser enhancement (rNOE) saturation transfer effect at around -1.6 ppm, termed NOE(-1.6), and its potential applications in tumor and stroke were reported by several institutes. However, there is a concern of the reproducibility of NOE(-1.6) measurements since it is not reported by many other publications. This paper aims to study the influence of typically overlooked experimental settings on the NOE(-1.6) signal, and to build a framework for more reliable measurements of NOE(-1.6) at 9.4 T.
Methods
Z-spectra were obtained in rat brains. A fitting approach was performed to quantify all known saturation transfer effects except NOE(-1.6). Residual signals were obtained by removing these confounding effects from Z-spectra and used to quantify NOE(-1.6). Multiple-slice imaging was performed to study the NOE(-1.6) dependence on brain regions. The influence of euthanasia, anesthesia, breathing gases, and RF irradiation power was also evaluated.
Results
Results demonstrate that the NOE(-1.6) signal contributions are often not clearly observable in raw Z-spectra at relatively high irradiation powers due to e.g. the direct water saturation (DS) effect, but can be visualized after removing other non-specific effects; also, the NOE(-1.6) effect depends on brain region, decreases postmortem, shifts after long-duration anesthesia, and may be enhanced by increasing O2 and N2O breathing air concentrations.
Conclusion
Since the NOE(-1.6) effect is more susceptible to the DS effect and more sensitive to physiological conditions than are other CEST effects, incorporating known sensitivities into the experimental design and data analysis is necessary to ensure more reliable NOE(-1.6) results.
Keywords: MRI, chemical exchange saturation transfer (CEST), nuclear Overhauser enhencement (NOE), NOE(-1.6)
INTRODUCTION
Magnetization exchange between solute protons and water protons is a common phenomenon in biological tissues. Such interactions form the basis for chemical exchange saturation transfer (CEST) and magnetization transfer (MT) methods that provide information on the molecular content, chemical environment (e.g. pH and temperature), and proton mobility (1-9). In CEST and MT imaging, a frequency selective RF irradiation pulse is typically applied to saturate the solute protons for a few second. The saturated protons chemically exchange or have (a possibly multi-step interaction) cross-relaxation with water protons, which causes a significant reduction in the measured water signal. By measuring the change in water signal, the solute protons can be indirectly detected. This indirect measurement facilitates 1) relatively higher sensitivity than proton magnetic resonance spectroscopy (1H-MRS) in detecting mobile small molecules; 2) detection of macromolecules or restricted small molecules with short transverse relaxation time that are not (or partially not) observable by 1H-MRS.
In CEST or MT experiments, a Z-spectrum is created by plotting the water signal as a function of RF irradiation frequency (10). In a Z-spectrum from biological tissues, the broad signal dip far from the water resonance (> 5 ppm or < -5 ppm) represents dipolar interactions between semi-solid component and water protons (also named magnetization transfer contrast (MTC) or semi-solid MT); signals obtained downfield of water (5 ppm to 0 ppm) mostly represent CEST effects from free metabolites and mobile proteins/peptides; and signals obtained upfield of water (0 ppm to -5 ppm) represent relayed nuclear Overhauser enhancement (rNOE) saturation transfer effects from mobile macromolecules (11,12). Selective RF irradiation of a proton of interest with a specific resonance frequency offset may provide MT or CEST contrast reflecting a specific molecule.
In previous studies, amide proton transfer (APT) at 3.5 ppm (1,7,13), amine-water exchange effect at 2 ppm (14,15), and a broad rNOE saturation transfer effect centered at around -3.5 ppm (NOE(-3.5)) (16-19) have been widely observed. Recently, a new relayed nuclear Overhauser enhancement (rNOE) saturation transfer effect at around -1.6 ppm, termed NOE(-1.6), has been observed and its potential for diagnosing tumor and ischemic stroke in rodents has been reported by several groups at high fields (20-24). In addition, a similar rNOE peak near -2 ppm was noticed in mice in an earlier publication (17), and an rNOE peak in a range from -1 ppm to -2 ppm can also be observed in healthy tissue, but not in tumor, in a previous human brain study, although the rNOE effect was not discussed (Fig. 8a and 8b in Ref (25)). However, this signal was not reported in many other previous publications (14,26), raising questions about the reproducibility and underlying signal dependencies of the rNOE(-1.6) effect. In this paper, we aim to (1) enhance the visualization of NOE(-1.6) signals by removing other known confounding saturation transfer effects from the Z-spectrum; and (2) study the influence of variations in several conventional experimental settings and physiological conditions. This study aims to build a framework to guide relatively more reliable measurements of NOE(-1.6) effects.
METHODS
Animal Preparation
All animal procedures were approved by the Animal Care and Usage Committee of Vanderbilt University. All rats were immobilized and anesthetized before MR imaging. Respiration and rectal temperature were continuously measured. Respiration rate was monitored to be in a range from 40 to 70 breaths per minute, and a rectal temperature of 37°C was maintained throughout the experiments using a warm-air feedback system (SA Instruments, Stony Brook, NY). Animals were anesthetized with 2-3% isoflurane (ISO) for both induction and maintenance during the experiments.
Five sets of experiments were completed:
Five healthy rats were scanned with a series of RF irradiation powers to study their influences on the visibility of NOE(-1.6) in Z-spectra. Air was used for both induction and maintenance during these experiments.
Multiple-slice axial imaging on seven healthy rats were obtained to study the spatial variation of NOE(-1.6) in rat brains. 97-98% O2 were used for both induction and maintenance during these experiments.
Six healthy rats were scanned to study the variation of NOE(-1.6) at different time points after rats were anesthetized. 97-98% O2 were used for both induction and maintenance during these experiments.
Four healthy rats before and after death were scanned to study the variation of NOE(-1.6) postmortem. 97-98% O2 were used for both induction and maintenance during these experiments. Rats were killed by high dose (5%) of ISO, and postmortem measurements were performed at around 10 mins after no respiratory monitored.
Ten healthy rats with first intake of air and then 97-98% O2 (air was used for induction); Eight healthy rats with first intake of 97-98% O2 and then 97-98% mixture of 70 : 30 N2O/O2 were scanned to study the variation of NOE(-1.6) in different physiological conditions. Among those rats, three rats first breathe air, then 97-98% O2, and then 70 : 30 N2O/O2.
MRI
All measurements were performed on a Varian DirectDrive™ horizontal 9.4 T magnet with a 38-mm Litz RF coil (Doty Scientific Inc. Columbia, SC). CEST measurements were performed by applying a continuous wave (CW)-CEST sequence with a 5-s CW irradiation pulse followed by single-shot spin-echo echo planar imaging (SE-EPI) acquisition. Z-spectra were acquired with RF offsets at ±4000, ±3500, ±3000, and from -2000 to 2000 Hz with a step of 50 Hz (-10 to 10 ppm on 9.4 T) (21). Control signals (S0) were obtained by setting the RF offset to 100 kHz (250 ppm on 9.4 T). Apparent water longitudinal relaxation rate (R1obs) and semi-solid MT pool concentration (fm) were obtained using a selective inversion recovery (SIR) method with inversion times of 4, 5, 6, 8, 10, 12, 15, 20, 50, 200, 500, 800, 1000, 2000, 4000, and 6000 ms (27). All images were acquired with matrix size 64 × 64, field of view 30 × 30 mm2, and one acquisition. Shimming was carefully performed so that the root mean square (RMS) deviation of B0 field map for each of our measurements is less than 6 Hz (corresponding to 0.015 ppm on 9.4 T).
Axial images showing four slices (slice #1, #2, #3, #4 in Fig. 1) with different distances to the rat nose were obtained to study the spatial variation of the NOE(-1.6) in rat brain. Axial images from slice #2 on live and postmortem rats, and rats with intake of difference gases were obtained to study the variation of NOE(-1.6) under varying physiological conditions. In addition, axial images of slice # 2 were acquired with four different durations of anesthesia: 0-0.5 h, 1-1.5 h, 2-2.5 h, and 3-3.5 h. These above studies were performed with an RF irradiation power of 1 μT. The multiple-power studies were performed with RF irradiation powers of 0.25 μT, 0.5 μT, 1 μT, and 1.5 μT and were also acquired from slice #2. All studies except that for different durations of anesthesia were finished in 2 hours after the induction of anesthesia to avoid the influence from long-time intake of isoflurane.
Fig. 1.

Sagittal scheme of rat brain showing the positions of the different slices.
Data analysis
We performed a two-step procedure to quantify the NOE(-1.6) spectra. First, we fitted the CEST Z-spectra to remove background direct water saturation (DS) and semi-solid MT effects. A previous report shows that MT and DS effects in a frequency range close to the water resonance can be modeled using Lorentzian functions (16). In this method, a two-pool model (water and semi-solid pools) Lorentzian fit was performed on Z-spectra with frequency offsets of ±4000, ±3500, ±3000, ±200, ±150, ±100, ±50, and 0 Hz (-10 to -7.5 ppm, -0.5 to 0.5 ppm, and 7.5 to 10 ppm at 9.4 T). Supporting Table S1 lists the starting points and boundaries of this two-pool model fit. The fitted spectra were used as reference signals (Sfit) which represent the background DS and semi-solid MT effects. Magnetization transfer ratio (MTR) residual spectra (Eq. (1)) were then obtained by subtracting measured signals (Smea) from Sfit. To provide more specific quantification, CEST exchange-dependent relaxation (AREX) residual spectra (Eq. (2)), were also obtained by inversely subtracting measured signals (Smea) from Sfit and correcting for R1obs (28-30).
| (1) |
| (2) |
Here, Δω is RF frequency offset. 1+fm was added in Eq. (2) to make the inverse method more specific, as shown in the previous publication (30).
After this first round of fitting, a secondary fitting was performed to isolate NOE(-1.6) peaks from the broad NOE(-3.5) peaks in the AREX residual spectra. Specifically, a one-pool model Lorentzian fit was performed to process the AREX residual spectra ranging from -3.5 to -5 ppm to quantify NOE(-3.5) peak by assuming that this pool has a symmetric CEST peak centered at -3.5 ppm. Supporting Table S2 lists the starting points and boundaries of this one-pool model fit. We then subtracted the one-pool model fitted NOE(-3.5) spectra from the AREX residual spectra to quantify NOE(-1.6) peaks. The fitting was performed to achieve the lowest RMS of residuals between the data and model in the selected segment.
All fits for in vivo experiments were performed voxel-by-voxel with images smoothed by a 3 × 3 median filter before fitting. The values of saturation transfer effects from amide, amine, and NOE(-3.5) were obtained from the AREX residual signals at 3.5 ppm, 2 ppm, and -3.5 ppm, respectively. The value of NOE(-1.6) was obtained by averaging signals in the fitted NOE(-1.6) spectrum ranging from -1 to -2 ppm due to the shifting of the peak. NOE(-1.6) spectrum was interpolated and the frequency offset of NOE(-1.6) was defined in this paper by the frequency offset of the maximum value in the fitted NOE(-1.6) spectrum from -1 to -2 ppm.
Statistics
Student’s t-test was employed to evaluate the signal difference. It was considered to be statistically significant when P < 0.05. All data analysis and statistical analyses were performed using Matlab R2013b (Mathworks, Natick, MA, USA).
RESULTS
NOE(-1.6) dips in Z-spectra acquired with multiple RF irradiation powers
Fig. 2 shows the averaged Z-spectra from one slice of rat brains (N=5) acquired with a series of RF irradiation powers. Note that although the dips centered at 3.5 ppm, 2 ppm, and -3.5 ppm can be observed from the Z-spectra acquired with all these RF irradiation powers, the NOE(-1.6) dips can only be clearly observed at relatively low RF irradiation powers (e.g. 0.25 μT and 0.5 μT in Fig. 2a and 2b, respectively).
Fig. 2.
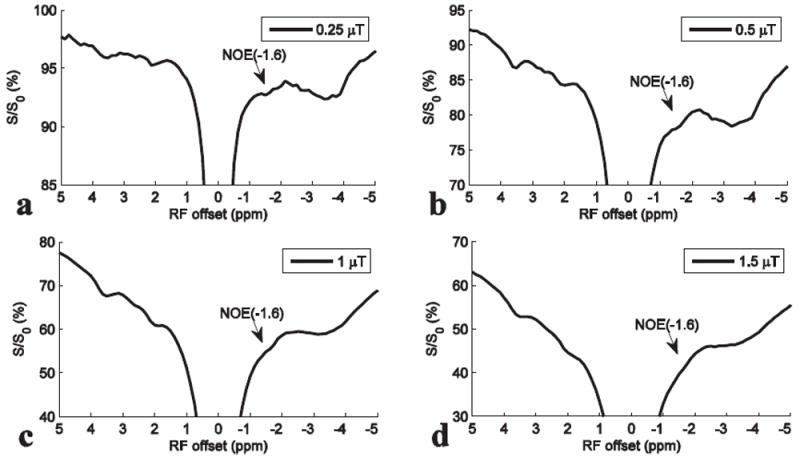
Averaged Z-spectra from the slice #2 of five rat brains with intake of air and RF irradiation powers of 0.25 μT (a), 0.5 μT (b), 1 μT (c), and 1.5 μT (d), respectively.
Regional difference of NOE(-1.6) in live rat brains
Fig. 3 shows the results from the multiple-slice axial CEST imaging with 1 μT on rat brains (N=7) with ROI chosen from cortex (C), corpus callosum (CC), and whole brain (W) in each slice, respectively. The positions of the slices were shown in the sagittal scheme of rat brain in Fig. 1. Similar to Fig. 2d, dips centered at 3.5 ppm, 2 ppm, and -3.5 ppm can be observed from all slices in Fig. 3a-3c. However, no clear dip can be observed in the frequency range from -1 to -2 ppm until the background DS and semi-solid MT effects are removed, leaving MTR residual spectra (in Fig. 3d-3f) or AREX residual spectra (in Fig. 3g-3i). In addition, these figures shows that the most significant variation of saturation transfer signals across slices is in the frequency range from -1 to -2 ppm. Fig. 3j-3l show the fitted NOE(-3.5) spectra and the remaining NOE(-1.6) spectra.
Fig. 3.
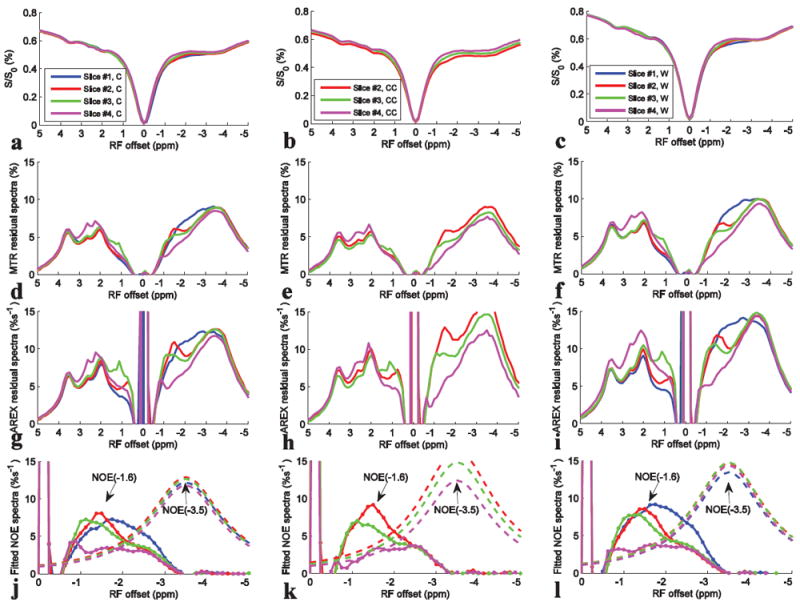
Z-spectra, MTR residual spectra, AREX residual spectra, and the fitted NOE(-1.6) spectra (dotted line) and NOE(-3.5) spectra (dashed line) from Cortex (C) (a, d, g, j), Corpus Callosum (CC) (b, e, h, k), and whole brain (W) (c, f, i, l) from different slices, respectively. CEST data were from average of seven rat brains.
We also compared the statistical results of NOE(-1.6) with those of other saturation transfer effects as well as R1obs and fm from different slices in Fig. 4. Note that NOE(-1.6) from slice #4 has significant decrease compared with that from slice #1 to #3 (P<0.01); R1obs and fm from slice #4 also have significant increase compared with that from slice #1 to #3 (P<0.01). Also note that NOE(-1.6) shows the most significant variation across slices compared with other effects. Fig. 5 shows the axial images of NOE(-1.6) from different slices of a representative rat brain. Supporting Fig. S1 shows the axial images of all other saturation transfer effects as well as R1obs and fm from different slices of the representative rat brain. Note that the NOE(-1.6) value in slice #4 is very weak compared with those in other slices.
Fig. 4.
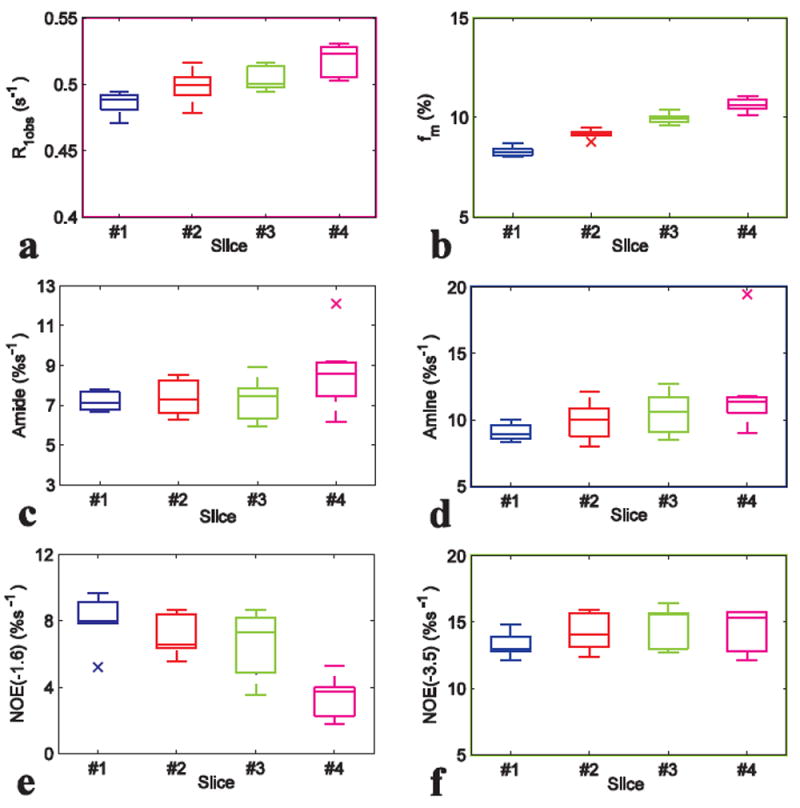
Statistics of R1obs (a), fm (b), amide (c), amine (d), NOE(-1.6) (e), and NOE(-3.5) (f) from different slices of seven rat brains. ROI was drawn from the whole rat brain of each slice.
Fig. 5.

Axial images of NOE(-1.6) from different slices of a representative rat brain. Images from left to right are from slice #1, #2, #3, and #4, respectively.
Variation of NOE(-1.6) after long-time anesthesia
Fig. 6 shows the results from CEST experiments on rat brains (N=6) at different time points after anesthesia. In Fig. 6a-6d, the most significant variation of saturation transfer signal is in the frequency range from -1 to -2 ppm at 3h after anesthesia. Fig. 6e and 6f shows that although the NOE(-1.6) values (note that the NOE(-1.6) value is defined to be the average of signals in the NOE(-1.6) spectrum from -1 to -2 ppm) have no significant variation, the central frequency of the NOE(-1.6) peak shifts significantly towards water peak when animals were anesthetized after 3h (P<0.01).
Fig. 6.
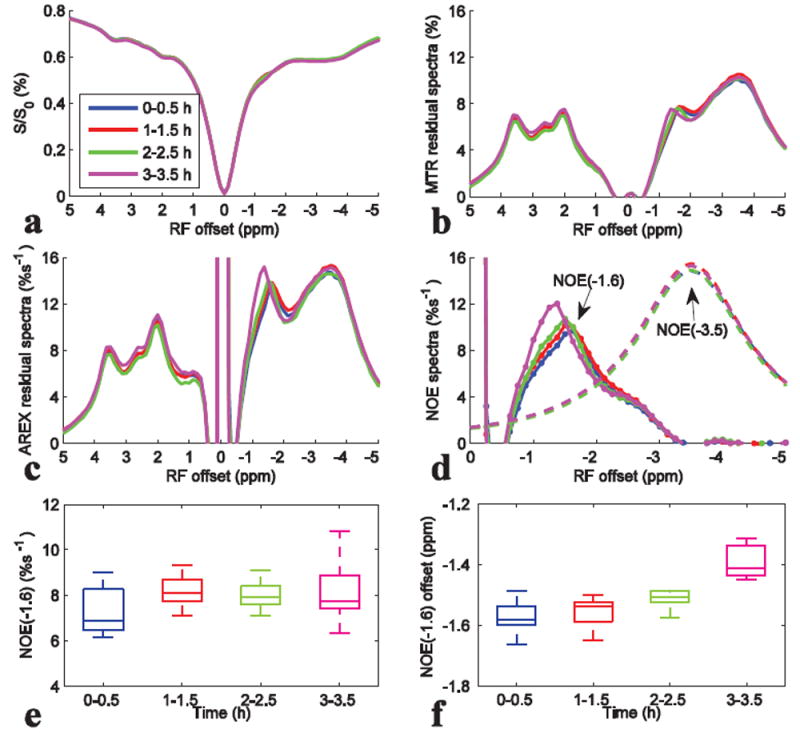
Z-spectra (a), MTR residual spectra (b), AREX residual spectra (c), fitted NOE(-3.5) spectra (dashed line) and remaining NOE(-1.6) spectra (dotted line) (d), the statistics of the NOE(-1.6) value (e), and the statistics of the frequency offset of NOE(-1.6) (f) at different time point after anesthesia. CEST data were from average of six rat brains. ROI was drawn from the whole rat brain of slice #2.
Variation of NOE(-1.6) in live and postmortem rat brains
Fig. 7 compares the results from CEST experiments on rat brains before and after death (N=4). Fig. 7a-7d shows that the dips or peaks ranging from -1 to -2 ppm become weak after death. The statistical result of the NOE(-1.6) value in Fig. 7e shows significant decrease after death.
Fig. 7.
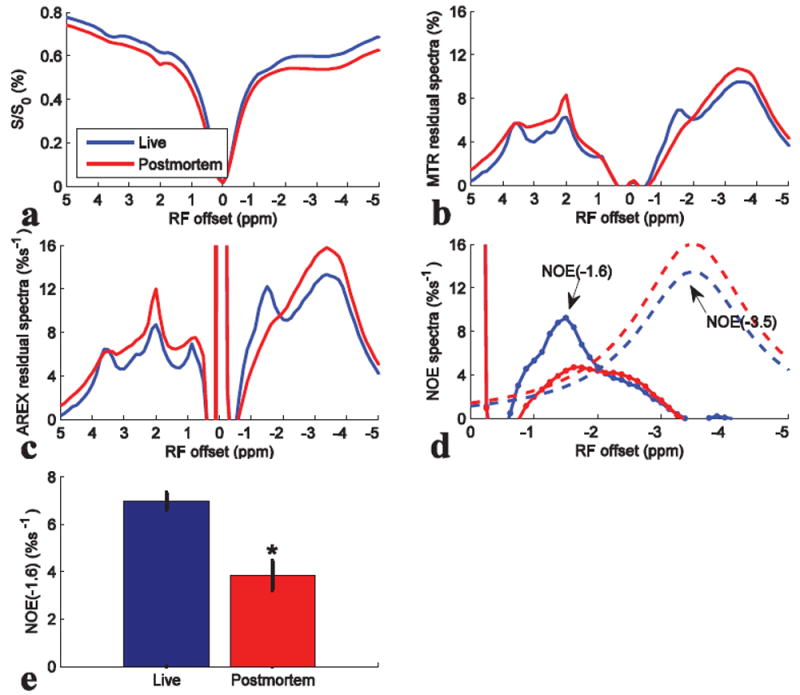
Z-spectra (a), MTR residual spectra (b), AREX residual spectra (c), fitted NOE(-3.5) spectra (dashed line) and remaining NOE(-1.6) spectra (dotted line) (d), and the statistics of NOE(-1.6) (e) from live and postmortem rats. CEST data were average of four rat brains. ROI was drawn from the whole rat brain of slice #2. *P < 0.05.
Variation of NOE(-1.6) in rats with intake of different gases
Fig. 8 compares the results from CEST experiments on rat brains with first intake of air and then O2 (N=10). Fig. 8b-8d shows that the peaks ranging from -1 to -2 ppm are enhanced after intake of O2, with significant average difference (Fig. 8e). The NOE(-1.6) values are 6.01 ± 1.3 %s-1 and 7.7 ± 0.6 %s-1 for intake of air and O2, respectively. Fig. 8f shows the comparison of NOE(-1.6) from 10 individual rats. It was found that when the NOE(-1.6) is very small in rats with intake of air (e.g. rat #1 and #2), O2 may enhance the signal. However, when the NOE(-1.6) is already very big in rats with intake of air (e.g. rat #4 and #5), O2 may not enhance it greatly. Fig. 9 shows the change of NOE(-1.6) after intake of O2 vs. NOE(-1.6) with intake of air for the 10 rats. Note that with the increase of NOE(-1.6) value for rats with intake of air, the change of NOE(-1.6) after intake of O2 becomes small, suggesting a signal saturation effect. Fig. 10 compares the results from CEST experiments on rat brains with first intake of O2 and then N2O/O2 (N=8). Fig. 10b-10d shows that the peaks ranging from -1 to -2 ppm are enhanced after intake of N2O/O2. The statistical result of NOE(-1.6) value in Fig. 10e shows significant difference between the two conditions. The NOE(-1.6) values are 7.5 ± 0.9 %s-1 and 8.4 ± 0.8 %s-1 for intake of O2 and N2O/O2, respectively. Fig. 10f shows the NOE(-1.6) value from each rat.
Fig. 8.
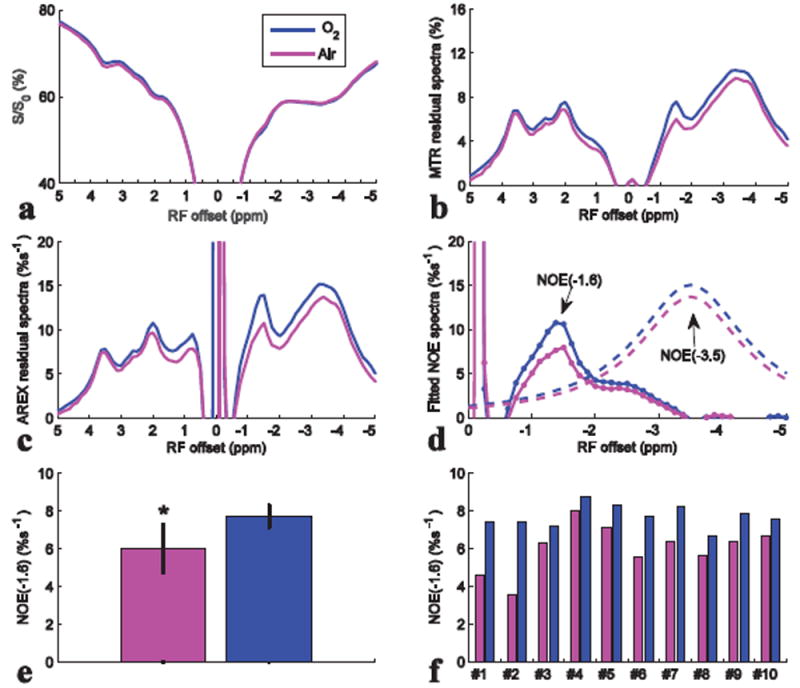
Z-spectra (a), MTR residual spectra (b), AREX residual spectra (c), fitted NOE(-3.5) spectra (dashed line) and remaining NOE(-1.6) spectra (dotted line) (d), statistics of NOE(-1.6) (e), and NOE(-1.6) of each rat (f) with intake of air and O2. CEST data were from average of ten rat brains. ROI was drawn from the whole rat brain of slice #2. *P < 0.05.
Fig. 9.
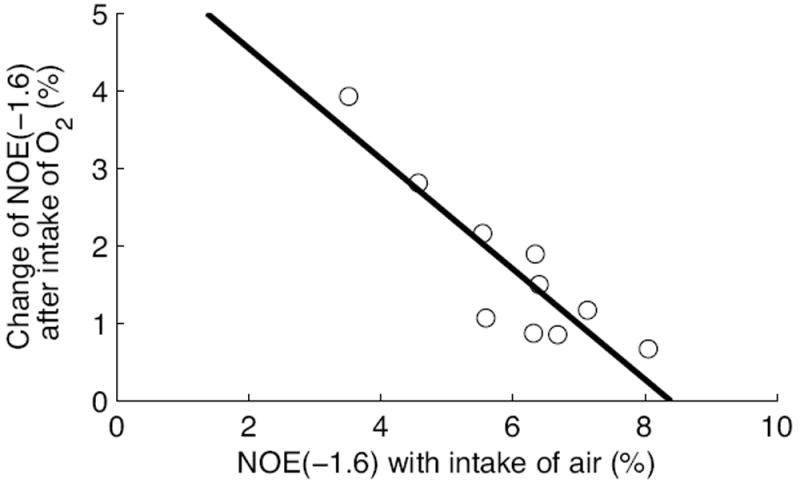
Change of NOE(-1.6) from rats after intake of O2 vs. NOE(-1.6) with intake of air. The rats first breathe air and then O2. The solid line is the least squares linear regression fit.
Fig. 10.
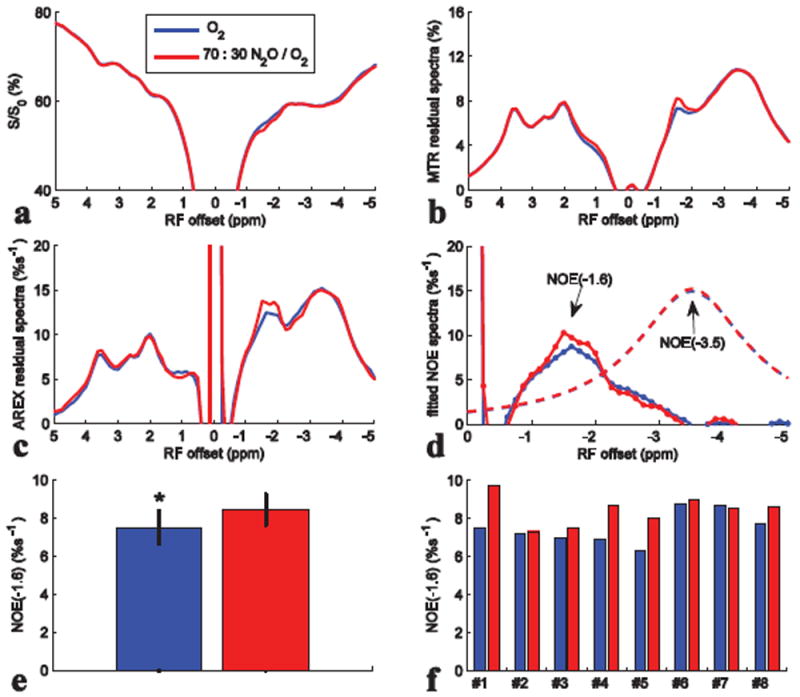
Z-spectra (a), MTR residual spectra (b), AREX residual spectra (c), fitted NOE(-3.5) spectra (dashed line) and remaining NOE(-1.6) spectra (dotted line) (d), statistics of NOE(-1.6) (e), and NOE(-1.6) of each rat (f) with intake of O2 and N2O/O2. CEST data were from average of eight rat brains. ROI was drawn from the whole rat brain of slice #2. *P < 0.05.
DISCUSSION
The dips at around -1.6 ppm in Z-spectra acquired at relatively low RF irradiation powers can be clearly observed in Fig 2a and 2b, which suggests that the NOE(-1.6) is a real signal that has been overlooked. Our studies indicate several factors that may decrease the NOE(-1.6) effect or reduce the visibility of NOE(-1.6):
The challenge in NOE(-1.6) quantification
While saturation transfer effects from amide, amine, and NOE(-3.5) produce clear dips in the water signal Z-spectra, saturation transfer effects from NOE(-1.6) are subtle and difficult to observe (Fig. 3a-3c). The indistinct nature of this dip is partially due to its resonance frequency being close to that of water, resulting in the NOE(-1.6) dip being buried by the sloping DS effect and thus not visible in the CEST Z-spectrum. Further complicating detection, our result in Fig. 3j-3l show that the NOE(-1.6) has a broad peak, which may be due to: (1) negative rNOE effects arising from macromolecules with broad line widths; (2) the center of the NOE(-1.6) peak shifting in different brain regions, effectively broadening the peak when there are partial volume effects. Moreover, we only studied the CW RF irradiation at high field scanners in this paper. Pulsed-CEST imaging with very short pulse duration may further increase the width of both NOE(-1.6) peak and DS peak, and thus would make it more difficult to be observed. At lower field scanners, the NOE(-1.6) is closer to water resonance and should be more difficult to be isolated from the water peak.
Traditionally, MTR was used to mitigate the effects of DS. Nonetheless, MTR can not fully remove the DS effect (28). Therefore, the NOE(-1.6) is still decreased by the shine-through effect from the significant DS effect near water resonance in the MTR spectra (Fig. 3d-3f). This can reduce the visibility of NOE(-1.6). In this paper, we applied a specific fitting approach to process CEST Z-spectra to remove all known saturation transfer effects including DS, semi-solid MT, and the NOE(-3.5), to enhance the detection ability to NOE(-1.6). Fig. 3j-3l show that the residual spectra from slice #1 to #3 have significant peaks centered in a frequency range from -1 ppm to -2 ppm.
The factors that may affect NOE(-1.6) in vivo
In many previous publications, axial images from different slices are typically reported. However, our results indicate that the NOE(-1.6) becomes very weak in ROIs or slices towards the posterior of the brain (e.g. slice #4 in Fig. 3). This sensitive dependence on different brain regions may be another reason responsible for the ‘invisible’ NOE(-1.6) in some previous reports. In rats after long-time anesthesia (Fig. 6), the center of the NOE(-1.6) peak shifts towards water peak. The shift of this peak makes the NOE(-1.6) more susceptible to the sloping DS effect and thus more difficult to be observed in the Z-spectrum. Our results also indicate that the NOE(-1.6) is relatively weak with intake of air (Fig. 8), drastically decreases in dead rats (Fig. 7), but may be enhanced in rats with intake of O2 (Fig. 8) or N2O/O2 (Fig. 10). In addition, our previous studies show that the NOE(-1.6) decreases in ischemic stroke (20) and tumors (21). This sensitivity to physiological conditions should be taken into account when designing future measurements of NOE(-1.6). The coefficient of variation (CoV) of NOE(-1.6) from all rats with intake of O2 from slice #2 acquired in 3h after anesthesia is 12.1% (N=32), which indicates that the NOE(-1.6) can be reliably measured by using our suggested experimental settings.
The possible mechanism of NOE(-1.6)
The upfield rNOE saturation transfer effects in the CEST Z-spectrum from 0 to -5 ppm may contain many small components (25). Previously, these rNOE saturation transfer effects were roughly viewed as a single broad peak centered at 3.5 ppm (16-19). However, our results show at least two main upfield rNOE peaks. Here, we tentatively name the rNOE peak close to water resonance as NOE(-1.6), although its peak shifts between -1 to -2 ppm and it may arise from several components. The NOE(-1.6) may have different signal mechanism from the NOE(-3.5), which is suggested by their different behaviors: (1) the NOE(-1.6) amplitude has bigger spatial variation than the NOE(-3.5); (2) the NOE(-1.6) peak shifts after long-time anesthesia; (3) the NOE(-1.6) amplitude decreases postmortem and increase with intake of O2 compared with intake of air. In contrast, the NOE(-3.5) amplitude is relatively stable at different conditions. The mechanism for the shift of the NOE(-1.6) peak after long-time anesthesia is unknown. Since all experimental conditions for the measurements at different time after long-time anesthesia are same, this peak shift may not be an artifact, but reflect the variation of biophysical or chemical properties of the solute molecule due to the long-time anesthesia.
Gas challenges are typical experimental settings in fMRI which may suggest the possible contribution from blood or blood-oxygen-level dependent (BOLD) effect. Previously, the semi-solid MT effect was found to change under CO2 challenge (31). This is explained as being due to the variation of blood fraction which changes the total semi-solid MT effect from both tissues and blood which have quite different semi-solid MT effects (the semi-solid MT effect from blood is very small compared with that from tissues). If the NOE(-1.6) magnitudes in tissues and blood are different, the variation of blood fraction under gas challenge may also cause the change of the total NOE(-1.6) effect from both tissues and blood. However, the measured fm are 9.6 ± 0.1 % and 9.3 ± 0.3 % for rats with intake of air and O2, respectively, and the change of fm is only -3 % after intake of O2, suggesting that the variation of blood fraction in our experiments with O2 challenge is negligible. Considering the bigger change of mean NOE(-1.6) magnitude (28 %) after intake of O2, we believe there may be other reasons causing the dependence of the NOE(-1.6) on gas challenges.
Similar to all other CEST and MT effects, NOE(-1.6) should depend on both the pool concentration and the coupling rate which is further regulated by many other factors (e.g. molecular mobility, temperature, and pH). These complex dependencies may cause the sensitivity of NOE(-1.6) to multiple physiological conditions. However, the signal mechanism of NOE(-1.6) is still not clear, and there are limited studies or previous reports on the NOE(-1.6). Therefore, we can not give an explanation for our experimental results currently.
Limitations
Here, we remove all other known saturation transfer effects from the Z-spectrum and use the residual signal to quantify the NOE(-1.6). The purpose of using this quantification method is to show that how NOE(-1.6) is buried in confounding effects in typical measurements. But this may not be the perfect method to quantify NOE(-1.6). The irregular shape of the fitted NOE(-1.6) spectra may be due to the inaccuracy of this fitting method and/or the combined effects of several other components. However, even if there are fitting errors, the conclusions drawn from this fitting result are still reliable because we only need the relative change, but not the absolute value, of the fitted NOE(-1.6) to evaluate its sensitivities to other factors. Simulations in supporting Fig. S2a to S2f show that the fitted NOE(-1.6) values and peak offsets can successfully reflect the relative change of solute concentration, solute-water exchanging/coupling rate, and solute resonance frequency offset. Gas challenge may change the water transverse relaxation time (T2w) (BOLD effect) and thus the signals around water resonance in the Z-spectra. However, simulations in supporting Fig. S2g and S2h show that the fitted NOE(-1.6) is insensitive to the change in T2. Future works may employ other quantification methods, e.g. multiple Lorentzian fit (16-18,20,21), Lorentzian difference analysis (25,32), extrapolated semi-solid MT reference (EMR) (33,34), and chemical exchange rotation transfer (35-38), which may be more accurate than the fitting method in this paper.
In this study, we chose four slices and a few ROIs from rat brain and studied several conventionally used experimental settings to evaluate the ‘reproducibility’ of NOE(-1.6). These four slices and the chosen ROIs are enough to show the regional variation of NOE(-1.6), but may not be small enough to present fine-defined structural and functional regions in rat brain. Further studies may perform high-resolution imaging to evaluate the distribution of NOE(-1.6). The relatively bigger cross-subject variation for rats with intake of air than that with intake of O2 in Fig. 8 suggests that NOE(-1.6) may be still sensitive to other factors that we have not evaluated in this paper. Rats under other physiological conditions may be also used, which may shed light on the signal mechanism of the NOE(-1.6). Cross-site and test-retest studies under our suggested experimental settings may be performed to further evaluate the reproducibility and repeatability of NOE(-1.6).
CONCLUSION
The NOE(-1.6) may not be observed (1) by direct observation of Z-spectrum at relatively high RF irradiation powers, (2) in the posterior part of rat brain, or (3) on dead rats, ischemic or tumor tissues, or after long-time anesthesia, but can be more clearly observed (1) by using specific quantification methods; (2) in the anterior part of rat brain; and (3) in healthy rats. The NOE(-1.6) may be also enhanced with intake of O2 and N2O compared with intake of air. Although we did not fully understand the signal mechanism of NOE(-1.6) and know all factors that influence NOE(-1.6), we provide a framework to guide relatively more reliable measurements of NOE(-1.6) effects which will help further studies on this novel NOE signal.
Supplementary Material
Supporting Table S1. Starting points and boundaries of the amplitude (A), width (W), and offset (Δ) of the exchanging pools in the two-pool model (water and semi-solid MT) Lorentzian fit. The unit of peak width and offset is ppm.
Supporting Table S2. Starting points and boundaries of the amplitude (A) and width (W) of the exchanging pool in the one-pool model (aliphatic NOE pool centered at -3.5 ppm) Lorentzian fit. Offset (Δ) of this pool was fixed at -3.5 ppm. The unit of peak width and offset is ppm.
Supporting Figure S1 Axial images of anatomy (a), R1obs (b), fm (c), amide (d), amine (e), NOE(-1.6) (f), and NOE(-3.5) (g) from different slices of a representative rat brain. Images from left to right are from slice #1, #2, #3, and #4, respectively.
Supporting Figure S2 Simulated Z-spectra and corresponding fitted NOE(-1.6) spectra (dotted line) and NOE(-3.5) spectra (dashed line) from the simulated Z-spectra with a series of solute concentration fs (a and b), exchanging/coupling rate ksw (c and d), solute resonance frequency offset (Δ) (e and f), and water transverse relaxation time (T2w) (g and h), respectively. Note that the fitted NOE(-1.6) peak depends on fs, ksw, Δ, but not on T2w. The shift of Δ changes the magnitude of the fitted NOE(-1.6) peak, but the change is very small. Simulated Z-spectra were created using a seven-pool (amide at 3.5 ppm, fast exchanging amine at 3 ppm, intermediate exchanging amine at 2 ppm, NOE at -1.6 ppm, NOE at -3.5 ppm, semi-solid MT centered at -2.3 ppm, and water at 0 ppm) model mimicking complex biological tissues at 9.4 T. The seven-pool model contains nineteen coupled Bloch equations and can be written as , where A is a 19 × 19 matrix. The water and solute pools each has three coupled equations representing their x, y, and z components. The semi-solid MT pool has a single coupled equation representing the z component, with a Lorentzian absorption lineshape. fs, ksw, Δ, and T2w were varied individually with all other parameters remaining at the value listed in the following table. T1 and T2 represent the longitudinal and transverse relaxation time of each pool.
Acknowledgments
Grant Sponsor: R21EB017873
References
- 1.Zhou JY, Tryggestad E, Wen ZB, Lal B, Zhou TT, Grossman R, Wang SL, Yan K, Fu DX, Ford E, Tyler B, Blakeley J, Laterra J, van Zijl PCM. Differentiation between glioma and radiation necrosis using molecular magnetic resonance imaging of endogenous proteins and peptides. Nature Medicine. 2011;17(1):130–U308. doi: 10.1038/nm.2268. [DOI] [PMC free article] [PubMed] [Google Scholar]
- 2.Cai KJ, Haris M, Singh A, Kogan F, Greenberg JH, Hariharan H, Detre JA, Reddy R. Magnetic resonance imaging of glutamate. Nature Medicine. 2012;18(2):302–306. doi: 10.1038/nm.2615. [DOI] [PMC free article] [PubMed] [Google Scholar]
- 3.Walker-Samuel S, Ramasawmy R, Torrealdea F, Rega M, Rajkumar V, Johnson SP, Richardson S, Goncalves M, Parkes HG, Arstad E, Thomas DL, Pedley RB, Lythgoe MF, Golay X. In vivo imaging of glucose uptake and metabolism in tumors. Nature Medicine. 2013;19(8):1067–1074. doi: 10.1038/nm.3252. [DOI] [PMC free article] [PubMed] [Google Scholar]
- 4.Haris M, Singh A, Cai KJ, Kogan F, McGarvey J, DeBrosse C, Zsido GA, Witschey WRT, Koomalsingh K, Pilla JJ, Chirinos JA, Ferrari VA, Gorman JH, Hariharan H, Gorman RC, Reddy R. A technique for in vivo mapping of myocardial creatine kinase metabolism. Nature Medicine. 2014;20(2):209–214. doi: 10.1038/nm.3436. [DOI] [PMC free article] [PubMed] [Google Scholar]
- 5.Haris M, Cai KJ, Singh A, Hariharan H, Reddy R. In vivo mapping of brain myo-inositol. Neuroimage. 2011;54(3):2079–2085. doi: 10.1016/j.neuroimage.2010.10.017. [DOI] [PMC free article] [PubMed] [Google Scholar]
- 6.Ling W, Regatte RR, Navon G, Jerschow A. Assessment of glycosaminoglycan concentration in vivo by chemical exchange-dependent saturation transfer (gagCEST) Proceedings of the National Academy of Sciences of the United States of America. 2008;105(7):2266–2270. doi: 10.1073/pnas.0707666105. [DOI] [PMC free article] [PubMed] [Google Scholar]
- 7.Zhou JY, Payen JF, Wilson DA, Traystman RJ, van Zijl PCM. Using the amide proton signals of intracellular proteins and peptides to detect pH effects in MRI. Nature Medicine. 2003;9(8):1085–1090. doi: 10.1038/nm907. [DOI] [PubMed] [Google Scholar]
- 8.Jones CK, Huang A, Xu J, Edden RA, Schar M, Hua J, Oskolkov N, Zaca D, Zhou J, McMahon MT, Pillai JJ, van Zijl PC. Nuclear Overhauser Enhancement (NOE) Imaging in the Human Brain at 7T. Neuroimage. 2013 doi: 10.1016/j.neuroimage.2013.03.047. [DOI] [PMC free article] [PubMed] [Google Scholar]
- 9.Leibfritz D, Dreher W. Magnetization transfer MRS. Nmr in Biomedicine. 2001;14(2):65–76. doi: 10.1002/nbm.681. [DOI] [PubMed] [Google Scholar]
- 10.Zhou JY, van Zijl PCM. Chemical exchange saturation transfer imaging and spectroscopy. Progress in Nuclear Magnetic Resonance Spectroscopy. 2006;48(2-3):109–136. [Google Scholar]
- 11.Gore JC, Zu ZL, Wang P, Li H, Xu JZ, Dortch RD, Gochberg DF. “Molecular” MR imaging at high fields. Magnetic Resonance Imaging. 2017;38:95–100. doi: 10.1016/j.mri.2016.12.008. [DOI] [PMC free article] [PubMed] [Google Scholar]
- 12.van Zijl PCM, Zhou J, Mori N, Payen JF, Wilson D, Mori S. Mechanism of magnetization transfer during on-resonance water saturation. A new approach to detect mobile proteins, peptides, and lipids. Magnetic Resonance in Medicine. 2003;49(3):440–449. doi: 10.1002/mrm.10398. [DOI] [PubMed] [Google Scholar]
- 13.Zhou JY, Lal B, Wilson DA, Laterra J, van Zijl PCM. Amide proton transfer (APT) contrast for imaging of brain tumors. Magnetic Resonance in Medicine. 2003;50(6):1120–1126. doi: 10.1002/mrm.10651. [DOI] [PubMed] [Google Scholar]
- 14.Cai KJ, Singh A, Poptani H, Li WG, Yang SL, Lu Y, Hariharan H, Zhou XHJ, Reddy R. CEST signal at 2ppm (CEST@2ppm) from Z-spectral fitting correlates with creatine distribution in brain tumor. Nmr in Biomedicine. 2015;28(1):1–8. doi: 10.1002/nbm.3216. [DOI] [PMC free article] [PubMed] [Google Scholar]
- 15.Cai KJ, Tain RW, Zhou XJ, Damen FC, Scotti AM, Hariharan H, Poptani H, Reddy R. Creatine CEST MRI for Differentiating Gliomas with Different Degrees of Aggressiveness. Mol Imaging Biol. 2016;19(2):225–232. doi: 10.1007/s11307-016-0995-0. [DOI] [PMC free article] [PubMed] [Google Scholar]
- 16.Zaiss M, Schmitt B, Bachert P. Quantitative separation of CEST effect from magnetization transfer and spillover effects by Lorentzian-line-fit analysis of z-spectra. Journal of Magnetic Resonance. 2011;211(2):149–155. doi: 10.1016/j.jmr.2011.05.001. [DOI] [PubMed] [Google Scholar]
- 17.Desmond KL, Moosvi F, Stanisz GJ. Mapping of Amide, Amine, and Aliphatic Peaks in the CEST Spectra of Murine Xenografts at 7 T. Magnetic Resonance in Medicine. 2014;71(5):1841–1853. doi: 10.1002/mrm.24822. [DOI] [PubMed] [Google Scholar]
- 18.Wang F, Qi HX, Zu ZL, Mishra A, Tang C, Gore JC, Chen LM. Multiparametric MRI reveals dynamic changes in molecular signatures of injured spinal cord in monkeys. Magnetic Resonance in Medicine. 2015;74(4):1125–1137. doi: 10.1002/mrm.25488. [DOI] [PMC free article] [PubMed] [Google Scholar]
- 19.Liu DP, Zhou JY, Xue R, Zuo ZT, An J, Wang DJJ. Quantitative Characterization of Nuclear Overhauser Enhancement and Amide Proton Transfer Effects in the Human Brain at 7 Tesla. Magnetic Resonance in Medicine. 2013;70(4):1070–1081. doi: 10.1002/mrm.24560. [DOI] [PMC free article] [PubMed] [Google Scholar]
- 20.Zhang XY, Wang F, Afzal A, Xu JZ, Gore JC, Gochberg DF, Zu ZL. A new NOE-mediated MT signal at around-1.6 ppm for detecting ischemic stroke in rat brain. Magnetic Resonance Imaging. 2016;34(8):1100–1106. doi: 10.1016/j.mri.2016.05.002. [DOI] [PMC free article] [PubMed] [Google Scholar]
- 21.Zhang XY, Wang F, Jin T, Xu JZ, Xie JP, Gochberg DF, Gore JC, Zu ZL. MR imaging of a novel NOE-mediated magnetization transfer with water in rat brain at 9.4 T. Magnetic Resonance in Medicine. 2017;78(2):588–597. doi: 10.1002/mrm.26396. [DOI] [PMC free article] [PubMed] [Google Scholar]
- 22.Heo HY, Jones CK, Hua J, Yadav N, Agarwal S, Zhou J, Van Zijl PC, Pillai JJ. Whole-brain amide proton transfer (APT) and nuclear overhauser enhancement (NOE) imaging in glioma patients usng low-power steady-state pulsed chemical exchange saturation transfer (CEST) imaging at 7T. Journal of Magnetic Resonance Imaging. 2016;44(1):41–50. doi: 10.1002/jmri.25108. [DOI] [PMC free article] [PubMed] [Google Scholar]
- 23.Zhou IY, Wang EF, Cheung JS, Zhang XA, Fulci G, Sun PZ. Quantitative chemical exchange saturation transfer (CEST) MRI of glioma using Image Downsampling Expedited Adaptive Least-squares (IDEAL) fitting. Scientific Reports. 2017;7(1):84. doi: 10.1038/s41598-017-00167-y. [DOI] [PMC free article] [PubMed] [Google Scholar]
- 24.Tee YK, Abidin B, Khrapitchev A, Sutherland BA, Larkin J, Ray K, Harston G, Buchan AM, Kennedy J, Sibson NR, Chappell MA. CEST and NOE signals in ischemic stroke at 9.4T evaluated using a Lorentzian multi-pool analysis: a drop, an increase or no change? ISMRM. 2017;3782 [Google Scholar]
- 25.Jones CK, Huang A, Xu JD, Edden RAE, Schar M, Hua J, Oskolkov N, Zaca D, Zhou JY, McMahon MT, Pillai JJ, van Zijl PCM. Nuclear Overhauser enhancement (NOE) imaging in the human brain at 7 T. Neuroimage. 2013;77:114–124. doi: 10.1016/j.neuroimage.2013.03.047. [DOI] [PMC free article] [PubMed] [Google Scholar]
- 26.Jin T, Wang P, Zong XP, Kim SG. MR imaging of the amide-proton transfer effect and the pH-insensitive nuclear overhauser effect at 9.4 T. Magnetic Resonance in Medicine. 2013;69(3):760–770. doi: 10.1002/mrm.24315. [DOI] [PMC free article] [PubMed] [Google Scholar]
- 27.Gochberg DF, Gore JC. Quantitative magnetization transfer imaging via selective inversion recovery with short repetition times. Magnetic Resonance in Medicine. 2007;57(2):437–441. doi: 10.1002/mrm.21143. [DOI] [PMC free article] [PubMed] [Google Scholar]
- 28.Zaiss M, Bachert P. Exchange-dependent relaxation in the rotating frame for slow and intermediate exchange - modeling off-resonant spin-lock and chemical exchange saturation transfer. Nmr in Biomedicine. 2013;26(5):507–518. doi: 10.1002/nbm.2887. [DOI] [PubMed] [Google Scholar]
- 29.Zaiss M, Xu J, Goerke S, Khan IS, Singer RJ, Gore JC, Gochberg DF, Bachert P. Inverse Z-spectrum analysis for spillover, MT-, and T1-corrected steady-state pulsed CEST-MRI-application to pH-weighted MRI of acute stroke. Nmr in Biomedicine. 2014;27(3):240–252. doi: 10.1002/nbm.3054. [DOI] [PMC free article] [PubMed] [Google Scholar]
- 30.Zaiss M, Zu ZL, Xu JZ, Schuenke P, Gochberg DF, Gore JC, Ladd ME, Bachert P. A combined analytical solution for chemical exchange saturation transfer and semi-solid magnetization transfer. Nmr in Biomedicine. 2015;28(2):217–230. doi: 10.1002/nbm.3237. [DOI] [PMC free article] [PubMed] [Google Scholar]
- 31.Zhou JY, Payen JF, van Zijl PCM. The interaction between magnetization transfer and blood-oxygen-level-dependent effects. Magnetic Resonance in Medicine. 2005;53(2):356–366. doi: 10.1002/mrm.20348. [DOI] [PubMed] [Google Scholar]
- 32.Jones CK, Polders D, Hua J, Zhu H, Hoogduin HJ, Zhou JY, Luijten P, van Zijl PCM. In vivo three-dimensional whole-brain pulsed steady-state chemical exchange saturation transfer at 7 T. Magnetic Resonance in Medicine. 2012;67(6):1579–1589. doi: 10.1002/mrm.23141. [DOI] [PMC free article] [PubMed] [Google Scholar]
- 33.Heo HY, Zhang Y, Lee DH, Hong XH, Zhou JY. Quantitative Assessment of Amide Proton Transfer (APT) and Nuclear Overhauser Enhancement (NOE) Imaging with Extrapolated Semi-Solid Magnetization Transfer Reference (EMR) Signals: Application to a Rat Glioma Model at 4.7 Tesla. Magnetic Resonance in Medicine. 2016;75(1):137–149. doi: 10.1002/mrm.25581. [DOI] [PMC free article] [PubMed] [Google Scholar]
- 34.Heo HY, Zhang Y, Jiang SS, Lee DH, Zhou JY. Quantitative Assessment of Amide Proton Transfer (APT) and Nuclear Overhauser Enhancement (NOE) Imaging with Extrapolated Semisolid Magnetization Transfer Reference (EMR) Signals: II. Comparison of Three EMR Models and Application to Human Brain Glioma at 3 Tesla. Magnetic Resonance in Medicine. 2016;75(4):1630–1639. doi: 10.1002/mrm.25795. [DOI] [PMC free article] [PubMed] [Google Scholar]
- 35.Zu ZL, Janve VA, Xu JZ, Does MD, Gore JC, Gochberg DF. A new method for detecting exchanging amide protons using chemical exchange rotation transfer. Magnetic Resonance in Medicine. 2013;69(3):637–647. doi: 10.1002/mrm.24284. [DOI] [PMC free article] [PubMed] [Google Scholar]
- 36.Zu ZL, Li H, Xu JZ, Zaiss M, Li K, Does MD, Gore JC, Gochberg DF. Measurement of APT using a combined CERT-AREX approach with varying duty cycles. Magnetic Resonance Imaging. 2017;17(42):22–31. doi: 10.1016/j.mri.2017.05.001. [DOI] [PMC free article] [PubMed] [Google Scholar]
- 37.Zu ZL, Louie EA, Lin EC, Jiang XY, Does MD, Gore JC, Gochberg DF. Chemical exchange rotation transfer imaging of intermediate-exchanging amines at 2 ppm. Nmr in Biomedicine. 2017 doi: 10.1002/nbm.3756. [DOI] [PMC free article] [PubMed] [Google Scholar]
- 38.Zu ZL, Xu JZ, Li H, Chekmenev EY, Quarles CC, Does MD, Gore JC, Gochberg DF. Imaging Amide Proton Transfer and Nuclear Overhauser Enhancement Using Chemical Exchange Rotation Transfer (CERT) Magnetic Resonance in Medicine. 2014;72(2):471–476. doi: 10.1002/mrm.24953. [DOI] [PMC free article] [PubMed] [Google Scholar]
Associated Data
This section collects any data citations, data availability statements, or supplementary materials included in this article.
Supplementary Materials
Supporting Table S1. Starting points and boundaries of the amplitude (A), width (W), and offset (Δ) of the exchanging pools in the two-pool model (water and semi-solid MT) Lorentzian fit. The unit of peak width and offset is ppm.
Supporting Table S2. Starting points and boundaries of the amplitude (A) and width (W) of the exchanging pool in the one-pool model (aliphatic NOE pool centered at -3.5 ppm) Lorentzian fit. Offset (Δ) of this pool was fixed at -3.5 ppm. The unit of peak width and offset is ppm.
Supporting Figure S1 Axial images of anatomy (a), R1obs (b), fm (c), amide (d), amine (e), NOE(-1.6) (f), and NOE(-3.5) (g) from different slices of a representative rat brain. Images from left to right are from slice #1, #2, #3, and #4, respectively.
Supporting Figure S2 Simulated Z-spectra and corresponding fitted NOE(-1.6) spectra (dotted line) and NOE(-3.5) spectra (dashed line) from the simulated Z-spectra with a series of solute concentration fs (a and b), exchanging/coupling rate ksw (c and d), solute resonance frequency offset (Δ) (e and f), and water transverse relaxation time (T2w) (g and h), respectively. Note that the fitted NOE(-1.6) peak depends on fs, ksw, Δ, but not on T2w. The shift of Δ changes the magnitude of the fitted NOE(-1.6) peak, but the change is very small. Simulated Z-spectra were created using a seven-pool (amide at 3.5 ppm, fast exchanging amine at 3 ppm, intermediate exchanging amine at 2 ppm, NOE at -1.6 ppm, NOE at -3.5 ppm, semi-solid MT centered at -2.3 ppm, and water at 0 ppm) model mimicking complex biological tissues at 9.4 T. The seven-pool model contains nineteen coupled Bloch equations and can be written as , where A is a 19 × 19 matrix. The water and solute pools each has three coupled equations representing their x, y, and z components. The semi-solid MT pool has a single coupled equation representing the z component, with a Lorentzian absorption lineshape. fs, ksw, Δ, and T2w were varied individually with all other parameters remaining at the value listed in the following table. T1 and T2 represent the longitudinal and transverse relaxation time of each pool.


