Short abstract
Objective
This meta-analysis was performed to assess the difference in the serum level of advanced glycation end products (AGEs) between patients with obstructive sleep apnea–hypopnea syndrome (OSAHS) and controls.
Methods
A systematic literature search was performed using PubMed, Elsevier, SCI, Wanfang, Weipu, and China National Knowledge Internet. Eligible studies that reported the serum AGE level in patients with OSAHS were identified by two reviewers. Review Manager version 5.2 (The Nordic Cochrane Centre, The Cochrane Collaboration, Copenhagen, Denmark) and R version 3.10 (www.r-project.org) were employed for data synthesis.
Results
Five studies involving 670 subjects were identified. The meta-analysis showed that the mean serum AGE level in the OSAHS group was 0.98 mmol/L higher than those in the control group (95% confidence interval, 0.69–1.27).
Conclusions
This meta-analysis showed that the serum AGE level was elevated in patients with OSAHS. This finding suggests that AGEs may play an important role in insulin resistance in OSAHS and serve as a biomarker for patients with OSAHS with a high risk of type 2 diabetes mellitus.
Keywords: Advanced glycation end products, AGEs, insulin resistance, sleep apnea, type 2 diabetes, biomarker
Introduction
Obstructive sleep apnea hypopnea syndrome (OSAHS) is a very common disease caused by partial or complete collapse of the upper respiratory tract during sleep. This condition affects about 26% of adults and is an increasing concern among the general population.1 Rapidly growing evidence from laboratory-, clinic-, and population-based studies has shown that OSAHS is associated with glucose intolerance, insulin resistance, and type 2 diabetes independent of obesity.2 However, the mechanisms underlying OSAHS-induced complications of insulin resistance are not fully understood. Advanced glycation end products (AGEs) are proteins and lipids produced by non-enzymatic glycation and oxidative stress in the hyperglycemic state.3 AGEs are involved in the pathogenesis of diabetic vascular complications. Some studies have suggested that AGEs participate in the pathogenesis of insulin resistance. Recent studies have also suggested that circulating AGEs are associated with insulin resistance in patients without diabetes.4
However, whether the serum AGE level in patients with OSAHS is higher than that in their healthy counterparts remains controversial. The findings of studies vary substantially, mainly because of differences in research designs and thus use of small sample sizes. Therefore, the purpose of this meta-analysis was to integrate the available data to better determine whether the serum AGE level is elevated in patients with OSAHS.
Material and methods
Search strategy
Relevant articles were identified from several online electronic databases (PubMed, Elsevier, SCI, Wanfang, and Weipu and China National Knowledge Internet) using the following search terms: “sleep apnea or obstructive sleep apnea–hypopnea syndrome” and “advanced glycation end products or AGEs.” Potentially relevant publications were evaluated for inclusion against prespecified eligibility and exclusion criteria.
Inclusion/exclusion criteria of literature
Studies were included in the meta-analysis if they satisfied the following criteria:
The study design was case–control study.
All subjects underwent polysomnographic monitoring to document the apnea index; those whose apnea–hypopnea index (AHI) was ≥5 were included in the case group, and those whose AHI was <5 were included in the control group.
All patients had a first-time diagnosis of OSAHS and had received no treatment.
The study provided sufficient data that allowed for a meta-analysis. If the available information was not sufficient to extract the data, the study was excluded.
All participants were free of chronic diseases such as cardiovascular diseases and diabetes.
Statistical analysis
Continuous data are presented using the standardized mean difference (SMD) and 95% confidence interval (CI). A random-effects model was applied when the P-value of the chi-squared (I2) statistic was <0.05.5–8
The forest plot was computer-generated. Potential publication bias was assessed using Begg’s test and Egger’s test.9–11 The contribution of each study to the final results of the meta-analysis was evaluated according to the sensitivity analysis. Subgroup analysis was performed to access the impact of language (articles in English and articles not in English) and the AHI (<30 and ≥30). All statistical analyses were performed using the Meta package in R version 3.10 (www.r-project.org) and Review Manager version 5.2 (The Nordic Cochrane Centre, The Cochrane Collaboration, Copenhagen, Denmark).
Ethics
This study was a meta-analysis; thus, approval by an ethics committee or institutional review board was not necessary.
Results
Search results
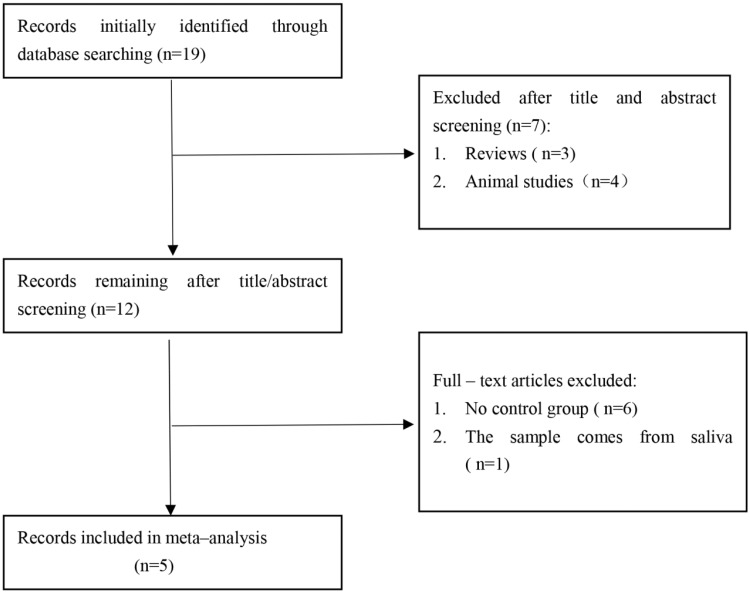
The initial search was independently executed by 3 reviewers (Xingyu Wu, Wensheng She, and Xun Niu), and 19 articles were preliminarily selected. The 19 articles were roughly screened by title and abstract on the basis of the inclusion and exclusion criteria. After a thorough consensus was achieved among the 3 reviewers, 12 articles were found to be appropriate for the meta-analysis. These 12 articles were then subjected to a second-stage review. Finally, five studies12–16 were included in our meta-analysis. The comprehensive literature search and selection procedures are displayed in Figure 1.
Figure 1.
Flow chart of the study selection process. After careful discussion among the three reviewers, five studies were included in the meta-analysis.
Features of included studies
Five studies involving 670 participants were included in the meta-analysis. The publication year, authors, study design, sample size, national source, and level of evidence of each study are listed in Table 1. All studies were defined as level 3 case–control studies based on the study design.17 The mean AHI, age, and AGE level in each study are shown in Table 2.
Table 1.
Characteristics of included studies.
| Authors | Year | Country | Study design | LOE | Sample size (OG/CG) |
|---|---|---|---|---|---|
| Lam et al. | 2012 | China | CST | 3b | 79/26 |
| Kotani et al. | 2000 | America | CST | 3b | 10/30 |
| Tan et al. | 2006 | United Kingdom | CST | 3b | 109/243 |
| Ji et al. | 2017 | China | CST | 3b | 60/30 |
| Xue and Lin | 2007 | China | CST | 3b | 65/18 |
CST, cross-sectional trial; LOE, level of evidence; OG, obstructive sleep apnea–hypopnea syndrome group; CG, control group.
Table 2.
Patient characteristics in the trials included in the meta-analysis.
| Authors | Sample size (OG/CG) |
AGEs, µmol/L |
Age, years |
AHI, µmol/L |
|||
|---|---|---|---|---|---|---|---|
| OG | CG | OG | CG | OG | CG | ||
| Lam et al. | 79/26 | 3.9 ± 1.2 | 3.2 ± 0.8 | 44.4 ± 9.2 | 40.8 ± 9.0 | 28.8 | 1.4 |
| Kotani et al. | 10/30 | 82.8 ± 26.0 | 64.2 ± 12.2 | 52 ± 4 | 52 ± 4 | >5 | <5 |
| Tan et al. | 109/243 | 3.62 ± 0.4 | 3.22 ± 0.54 | 47.8 ± 10.8 | 46.1 ± 9.6 | 23.3 | <5 |
| Ji et al. | 60/30 | 5.52 ± 2.03 | 2.74 ± 1.67 | 48.2 ± 10.06 | 47.6 ± 11.1 | 32.18.3 ± 8.17 | <5 |
| Xue and Lin | 65/18 | 5.3 ± 2.1 | 2.9 ± 1.5 | 46 ± 11 | 48 ± 11 | 32.7.3 ± 19.3 | 2.2 ± 1.4 |
Data are presented as n, mean, or mean ± standard deviation. OG, obstructive sleep apnea–hypopnea syndrome group; CG, control group; AGEs, advanced glycation end products; AHI, apnea–hypopnea index
Results of meta-analysis
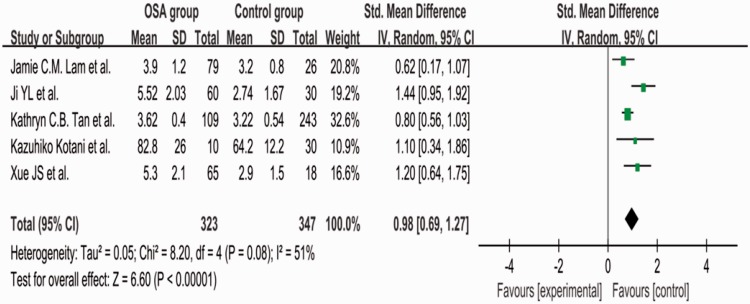
The value of I2 was 51%, indicating moderate heterogeneity among the studies. Therefore, we used a random-effects model to combine the effect size. The meta-analysis showed that the mean serum AGE level was 0.98 µmol/L higher in the OSAHS than control group (95% CI, 0.69–1.27, P = 0.08) (Figure 2).
Figure 2.
Comparison of serum advanced glycation end product levels between the OSAHS group and control group in the five included studies. OSAHS, obstructive sleep apnea–hypopnea syndrome; SD, standard deviation; CI, confidence interval.
Sensitivity analysis
A sensitivity analysis was performed by removing a single study and calculating the pooled SMD for the remaining studies under the random-effects model to assess the effect of each individual study on the pooled SMD. According to the sensitivity analysis, the SMD ranged from 0.83 to 1.08 by omitting a single study under the random-effects model. The results of the sensitivity analysis are shown in Table 3. The pooled analysis under the random-effects model showed that the AGE level was significantly higher in patients with OSAHS (SMD, 0.98; 95% CI, 0.69–1.27), and the fixed-effects model yielded a similar result (SMD, 0.88; 95% CI, 0.69–1.06).
Table 3.
Sensitivity analysis of pooled SMD for AGEs and OSAHS under the random-effects model.
| Study omitted | SMD (95% CI) | P for heterogeneity | I2 |
|---|---|---|---|
| Lam et al. | 1.08 (0.74–1.42) | 0.10 | 53% |
| Tan et al. | 1.08 (0.68–1.47) | 0.11 | 51% |
| Ji et al. | 0.83 (0.64–1.02) | 0.38 | 2% |
| Xue and Lin | 0.95 (0.61–1.28) | 0.07 | 58% |
| Kotani et al. | 0.97 (0.64–1.31) | 0.05 | 62% |
SMD, standardized mean difference; CI, confidence interval; AGEs, advanced glycation end products; OSAHS, obstructive sleep apnea–hypopnea syndrome
Publication bias
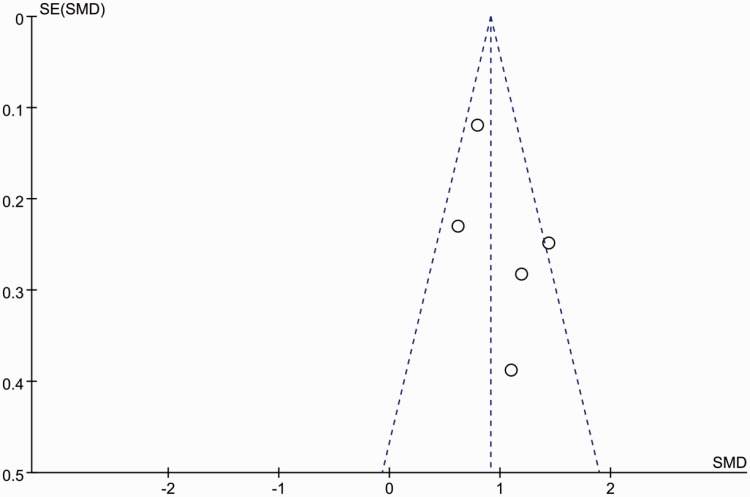
The funnel plot was virtually symmetrical (Figure 3), indicating little publication bias. Neither Begg’s test nor Egger’s test provided evidence that publication bias existed in the present study.
Figure 3.
Funnel plot showing the possibility of small publication bias. SE, standard error; SMD, standardized mean difference.
Subgroup analysis of AHI
The total SMD in the studies with a mean AHI of ≥30 was 1.62 (95% CI, 1.24–2.00) (Figure 4). The total SMD in the studies with a mean AHI of <30 was 0.77 (95% CI, 0.56–0.97) Figure 5. The analysis showed that the AGE level was increased in the patients with an AHI of <30 and was markedly increased in patients with an AHI of ≥30.
Figure 4.
Subgroup analysis: apnea–hypopnea index of ≥30. OSAHS, obstructive sleep apnea–hypopnea syndrome; SD, standard deviation; CI, confidence interval.
Figure 5.
Subgroup analysis: apnea–hypopnea index of <30. OSAHS, obstructive sleep apnea–hypopnea syndrome; SD, standard deviation; CI, confidence interval.
Subgroup analysis of language
The total SMD in the studies with articles not in English was 1.62 (95% CI, 1.24–2.00) (Figure 6). The total SMD in the studies with articles in English was 0.81 (95% CI, 0.61–1.01) (Figure 7). The analysis showed that the AGE level was increased both in articles in English and articles not in English.
Figure 6.
Subgroup analysis: articles not in English. OSAHS, obstructive sleep apnea–hypopnea syndrome; SD, standard deviation; CI, confidence interval.
Figure 7.
Subgroup analysis: articles in English. OSAHS, obstructive sleep apnea–hypopnea syndrome; SD, standard deviation; CI, confidence interval.
Discussion
AGEs are a complex and heterogeneous group of compounds that are formed not only in conditions of hyperglycemia but also in states of enhanced oxidative stress.14 AGEs can cause many adverse cellular events, including damage to nucleic acids, reduction of enzymatic activity, cross-linking and impaired degradation of proteins, and induction of cytotoxic pathways.18,19 Elevated AGEs have been found to be associated with an increased risk of atherosclerosis, diabetes mellitus, and Alzheimer’s disease.20 In contrast, type 2 diabetes is more common in patients with than without OSAHS.21
The present meta-analysis was performed to assess the difference in the serum AGE level between patients with OSAHS and controls. The overall results and conclusion were not affected in the sensitivity analysis after removal of any single study or conversion of the random-effects model into a fixed-effects model. Neither Begg’s test nor Egger’s test showed publication bias in the present study. Therefore, the outcome of this meta-analysis can be regarded with high certainty.
The present results indicated that the serum AGE level in patients with OSAHS was significantly increased. This result is similar to those of previous studies.12,13 Intermittent hypoxemia and oxidative stress in patients with OSAHS may induce the formation of AGEs.12 We also performed a subgroup analysis in terms of AHI. The results showed that the parameters had a more significant effect on the AGE level when the AHI was ≥30. This finding is consistent with those of previous studies12,13 showing that the serum AGE level was significantly correlated with the severity of OSAHS. These previous studies also showed that continuous positive airway pressure therapy can significantly reduce the serum AGE level.12,13 Decreased levels of AGEs in patients compliant with continuous positive air pressure therapy suggest a causal relationship between OSAHS and elevated AGEs. This evidence indicates that effective treatment of OSAHS might help to ameliorate downstream pathological sequelae.
Despite these important findings, the present study has some limitations. First, the meta-analysis included five case–control trials, each of which might have had a degree of experimental bias. Second, the sample size was relatively low, which may have affected the accuracy of our results. Larger studies would allow for more accurate effect size estimation and sophisticated moderator analysis. Third, although moderate heterogeneity was present among the individual studies, the exact source of the heterogeneity could not be identified from the limited number of studies.
Conclusion
The results of this meta-analysis show that the serum AGE level was significantly increased in patients with OSAHS. This finding suggests that AGEs might play an important role in insulin resistance in OSAHS and serve as a biomarker for patients with OSAHS and a high risk of developing type 2 diabetes.
Declaration of conflicting interest
The authors declare that there is no conflict of interest.
Funding
This study was supported by the National Natural Science Foundation of China (Grant No. 81570903). The funders had a role in study design, data collection and analysis, decision to publish, or preparation of the manuscript.
References
- 1.Peppard PE, Young T, Barnet JH, et al. Increased prevalence of sleep-disordered breathing in adults. Am J Epidemiol 2013; 177: 1006–1014. [DOI] [PMC free article] [PubMed] [Google Scholar]
- 2.Aurora RN, Punjabi NM. Obstructive sleep apnoea and type 2 diabetes mellitus: a bidirectional association. Lancet Respir Med 2013; 1: 329–338. [DOI] [PubMed] [Google Scholar]
- 3.Ramasamy R, Yan SF, Herold K, et al. Receptor for advanced glycation end products: fundamental roles in the inflammatory response: winding the way to the pathogenesis of endothelial dysfunction and atherosclerosis. Ann NY Acad Sci 2008; 1126: 7–13. [DOI] [PMC free article] [PubMed] [Google Scholar]
- 4.Tan KC, Chow WS, Lam JC, et al. Advanced glycation endproducts in nondiabetic patients with obstructive sleep apnea. Sleep 2006; 29: 329–333. [DOI] [PubMed] [Google Scholar]
- 5.Niu X, Chen X, Xiao Y, et al. The differences in homocysteine level between obstructive sleep apnea patients and controls: a meta-analysis. PLoS One 2014; 9: e95794. [DOI] [PMC free article] [PubMed] [Google Scholar]
- 6.Mantel N, Haenszel W . Statistical aspects of the analysis of data from retrospective studies of disease. J Natl Cancer Inst 1959; 22: 719–748. [PubMed] [Google Scholar]
- 7.Higgins JP, Thompson SG, Deeks JJ, et al. Measuring inconsistency in meta-analyses. BMJ 2003; 327: 557–560. [DOI] [PMC free article] [PubMed] [Google Scholar]
- 8.DerSimonian R, Laird N. Meta-analysis in clinical trials. Control Clin Trials 1986; 7: 177–188. [DOI] [PubMed] [Google Scholar]
- 9.Egger M, Davey Smith G, Schneider M, et al. Bias in meta-analysis detected by a simple, graphical test. BMJ 1997; 315: 629–634. [DOI] [PMC free article] [PubMed] [Google Scholar]
- 10.Begg CB, Mazumdar M. Operating characteristics of a rank correlation test for publication bias. Biometrics 1994; 50: 1088–1101. [PubMed] [Google Scholar]
- 11.Duval S, Tweedie R. Trim and fill: a simple funnel-plot-based method of testing and adjusting for publication bias in meta-analysis. Biometrics 2000; 56: 455–463. [DOI] [PubMed] [Google Scholar]
- 12.Lam JC, Tan KC, Lai AY, et al. Increased serum levels of advanced glycation end-products is associated with severity of sleep disordered breathing but not insulin sensitivity in non-diabetic men with obstructive sleep apnoea. Sleep Med 2012; 13: 15–20. [DOI] [PubMed] [Google Scholar]
- 13.Kotani K, Kimura S, Komada I, et al. Continuous positive air pressure treatment reduces serum advanced glycation end products inpatients with obstructive sleep apnoea syndrome: a pilot study. Prim Care Respir J 2000; 20: 336–337. [DOI] [PMC free article] [PubMed] [Google Scholar]
- 14.Tan KC, Chow WS, Lam JC, et al. Advanced glycation endproducts in nondiabetic patients with obstructive sleep apnea. Sleep 2006; 29: 329–333. [DOI] [PubMed] [Google Scholar]
- 15.Ji YL, Jiang YQ, Chen FG, et al. Effect of continuous positive airway pressure on AGEs and ox-LDL levels in patients with obstructive sleep apnea hypopnea syndrome. Acta Universitatis Medicinalis Nanjing 2017; 37: 85–87. [Google Scholar]
- 16.Xue JS, Lin Y. Changes of serum advanced glycation endproducts in patients with obstructive sleep apnea hypopnea syndrome. Chin J Tubere Respir Dis 2007; 30: 155–156. [Google Scholar]
- 17.Petrisor BA, Keating J, Schemitsch E. Grading the evidence: levels of evidence and grades of recommendation. Injury 2006; 37: 321–327. [DOI] [PubMed] [Google Scholar]
- 18.Bucala R, Cerami A. Advanced glycosylation: chemistry, biology, and implications for diabetes and aging. Adv Pharmacol 1992; 23: 1–34. [DOI] [PubMed] [Google Scholar]
- 19.Singh R, Barden A, Mori T, et al. Advanced glycation end-products: a review. Diabetologia 2001; 44: 129–146. [DOI] [PubMed] [Google Scholar]
- 20.Ahmed N, Thornalley PJ. Advanced glycation endproducts: what is their relevance to diabetic complications. Diabetes Obes Metab 2007; 9: 233–245. [DOI] [PubMed] [Google Scholar]
- 21.Tasali E, Mokhlesi B, Van Cauter E. Obstructive sleep apnea and type 2 diabetes: interacting epidemics. Chest 2008; 133: 496–506. [DOI] [PubMed] [Google Scholar]


