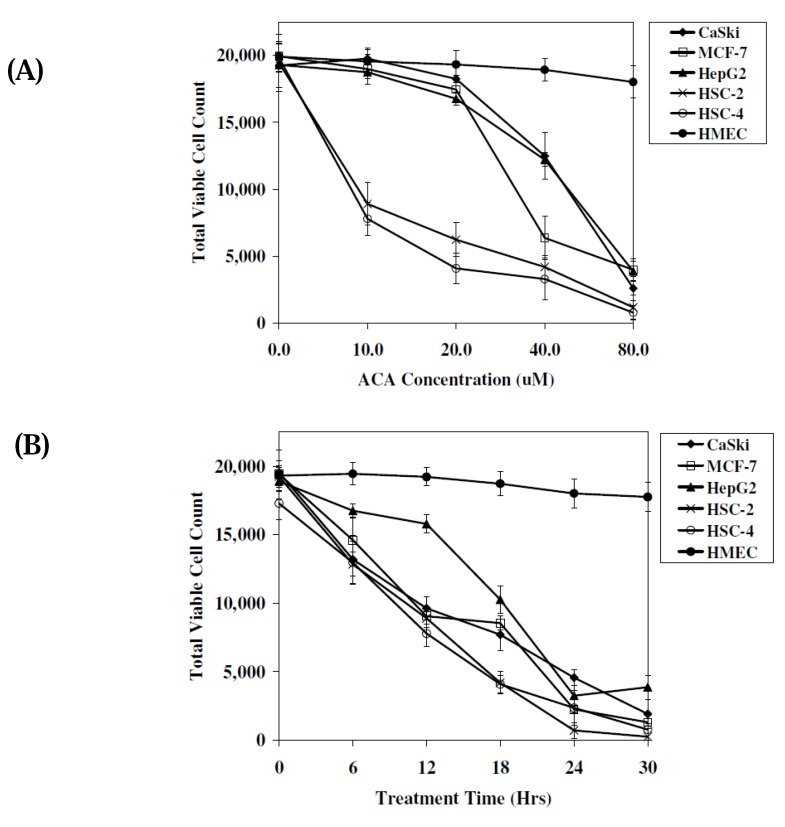
Figure 3.
The cytotoxic effects of ACA on tumour cell lines assessed using the MTT cell viability assay. (A) Comparison of total viable cell count between various tumour cell lines after treatment with ACA at different concentrations (0–80.0 μM) at 12 hrs post-treatment time. (B) Comparison of total viable cell count between various tumor cell lines after treatment with 40.0 μM ACA for 30 hrs. All experiments were plotted as mean values (n = 3).

