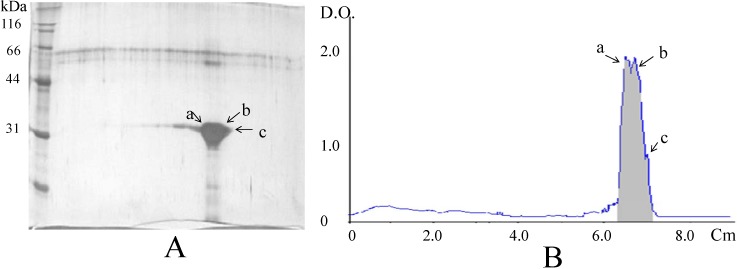
Figure 4.
Analysis of the lectin from tepary beans by 2D-polyacrylamide gel electrophoresis. (A). In the gel shown, three distinct species (designated as a, b, and c) were distinguished; (B). Densitogram shows peaks corresponding to the three species, with calculated isoelectric points of 4.5 (a), 4.4 (b), and 4.2 (c).

