Abstract
Background
The available evidence regarding normal ranges for the center-edge angle and the alpha angle derives from a few small studies, and associated factors such as sex and anthropometric factors have not been well evaluated. Knowing more about normal values for these parameters is critical, because this can inform decisions about when to perform elective hip preservation surgery. Population-level studies would provide considerable clarity on these issues, but to our knowledge, no such studies are available.
Questions/purposes
The purposes of this study were (1) to use MRI in patients of a population-based study to establish normal values for the alpha and center-edge angles in the normal adult hip; and (2) to determine whether age, sex, or anthropometric variables were associated with differences in these values.
Methods
We used MRI images (1.5 T) of 3226 participants of the Study of Health in Pomerania (SHIP). SHIP is a population-based study that started with 4308 participants in 1997. Participants were recruited randomly from official inhabitant data files as a stratified cluster sample of the population from a defined region in northeastern Germany. To ensure a representative epidemiologic cohort, stratification variables were sex, age, and city of residence. Between 2008 and 2012, 1094 of these participants underwent whole-body MRI with pelvic sequences in the second followup. In parallel, the next cohort, SHIP-Trend, started with the same protocol in which 2132 participants underwent MRI examination. Reference values were calculated by quantile regressions for the 2.5th and 97.5th percentiles. Associations with the demographic features sex, age, weight, height, body mass index (BMI), and waist circumference were analyzed by bivariate linear regression models.
Results
The mean center-edge angle was 31° (± 7°) with a corresponding calculated normal range of 17° to 45°. The mean alpha angle was 55° (± 8°) with a corresponding calculated normal range between 39° and 71°. Men (30° ± 7°) had a lower center-edge angle than women (32° ± 8°) (p < 0.001, β = 1.4°; 95% confidence interval [CI], 0.9°-1.9°) and a higher alpha angle (57° ± 8° versus 52° ± 7°, p < 0.001, β = 5.7°; 95% CI, 5.2°-6.3°). Moreover, a higher center-edge angle for the left side was found (33° ± 8° versus 30° ± 8°, p < 0.001, β =3.2°; 95% CI, 3.0°-3.4°). In addition to sex, we found that age, height, waist circumference, and BMI affected both center-edge angle and alpha angle. Weight was associated with the alpha angle as well. Because of these associations, age- and sex-adjusted reference values with belonging formulas were calculated.
Conclusions
The range of normal center-edge and alpha angles is quite wide. Therefore, only markedly abnormal angles may be associated with pathology. Moreover, center-edge angle and alpha angle are associated with age, sex, and anthropometric factors, which have to be taken into account for better interpretation.
Clinical Relevance
The association of abnormal radiographic values with true clinical hip pathology is tenuous at best. Assuming that a patient with an abnormal radiograph requires treatment is unwise. The clinical picture has to be substantial for therapeutic decisions.
Introduction
Radiographic descriptions such as angular measurements of hip morphology are often used as part of the decision-making process for surgery [11, 14, 33, 35, 44, 53], but the justification for use of certain thresholds or values is surprisingly sparse. Presumed normal values for center-edge angle [54] or alpha angle [39] were developed on small sample sizes in hospital-based studies. Wiberg [54] first described the center-edge angle to quantify the lateral coverage of the femoral head by the acetabulum. Traditionally, the center-edge angle has been measured on AP radiographs [11, 44, 53, 54], but in recent decades, several studies measured the center-edge angle using coronal CT images [12, 20, 35, 47]. Values below 20° are considered an indicator of hip dysplasia [11, 13, 18, 23, 29, 33, 37, 38, 53]. In addition, the center-edge angle is frequently utilized in the assessment of pincer-type femoroacetabular impingement (FAI) [42], but no generally accepted thresholds are established yet (> 40° [8, 9, 48] or > 45° [18, 31]). The alpha angle is a frequently used angle in FAI diagnostics. In 2002, Nötzli et al. [39] developed the alpha angle on MRI to quantify the femoral head-neck junction. Today, the alpha angle is the most commonly used tool to assess cam-type FAI [42]. It is measured, partially modified, in various planes on CT [4], MRI [19, 26, 28, 39], or radiographs [10, 17]. Probably as a consequence of different assessment techniques and a lack of epidemiologic data, cutoff values for a cam deformity range between 50° [39] and 83° [17]. Therefore, generally accepted reference values for the alpha angle have not yet been established [31].
Because of a lack of consensus on what constitutes a “normal” hip with respect to the center-edge angle or the alpha angle, different authors have cited different criteria for determining what should be considered pathologic. In addition, several studies have examined possible associations between age [2, 3, 7, 15-17, 27, 34, 36, 40, 49, 50, 53] and sex [23, 32, 53], whereas no associations with height and weight have been found yet [13, 56]. Moreover, varying results for side differences are described [14, 34, 37, 47, 53, 56]. These studies have typically been limited by small groups, hospitalized participants, nonpopulation-based cohorts, or inconsistent techniques. In addition, because of differences in patient groups, some studies are contradictory [4, 5, 19, 26, 27, 46, 56]. Moreover, to our knowledge, none of them established reference values that take associations like age and sex into account.
We therefore used a large database to evaluate the typical hip and associations in a large population-based cohort of adults. Specifically, we sought (1) to use MRI in patients of a population-based study to establish normal values for the alpha angle and the center-edge angle in the normal adult hip; and (2) to determine whether age, sex, or anthropometric variables were associated with differences in these values.
Patients and Methods
Design and Sample
This study was an associated project (SHIP/2015/145/D) of the epidemiological Study of Health in Pomerania (SHIP) [21, 52]. We used data from 3283 volunteers (mean age, 53 ± 14 years; range, 21–90 years). SHIP is an ongoing population-based cohort study with two independent cohorts based on the same protocol, SHIP and SHIP-Trend. Participants were recruited randomly from official inhabitant data files as a stratified cluster sample of the population from a defined region in northeastern Germany (northern and eastern Pomerania). To ensure a representative cohort, stratification variables were sex, age, and city of residence. The aims of SHIP are the identification of diseases, their risk factors, and the complex associations among them. For the baseline assessment of SHIP (SHIP-0), 6265 eligible adults were chosen; 4308 participated, of whom 2192 were women (68.8% response rate). The examinations of participants in SHIP-0 were performed between 1997 and 2001. Two followup examinations took place: SHIP-1 between 2002 and 2006 (n = 3300) and SHIP-2 between 2008 and 2012 (n = 2333). In 2008, a stratified sample of 8016 adults was drawn from the central population registry for the second cohort (SHIP-Trend). After exclusion of deceased and relocated individuals, 4420 patients (2275 women) were examined (response rate of 50.1%) [52]. The invitation procedure consisted of three written invitations, phone calls, and one personal contact. Further details on recruitment have been described elsewhere [25, 43, 52].
In this study, we included all SHIP-2 and SHIP-Trend participants with a complete hip protocol of the whole-body MRI. Overall 3317 of 6753 adults (SHIP-2 and SHIP-Trend) participated voluntarily in the MRI examination. Reasons for dropping out were, for example, known claustrophobia, metal implants, personal reasons, or a pacemaker. Of 3317 potential participants, 34 did not complete their pelvic MRI as a result of acute claustrophobia. Moreover, we excluded 57 MRIs because of missing data (36), THA (18), extreme deformity (two), or suboptimal quality (one). In total, 3226 MRI were eligible for the current study (Fig. 1). Each participant provided written informed consent, and the local ethics commission approved the study. Of 3226 participants, 50.8% (n = 1639) were women. The mean age was 53 ± 14 years with no difference between sexes. Body weight, body height, body mass index (BMI), and waist circumference were higher in men (Table 1).
Fig. 1.
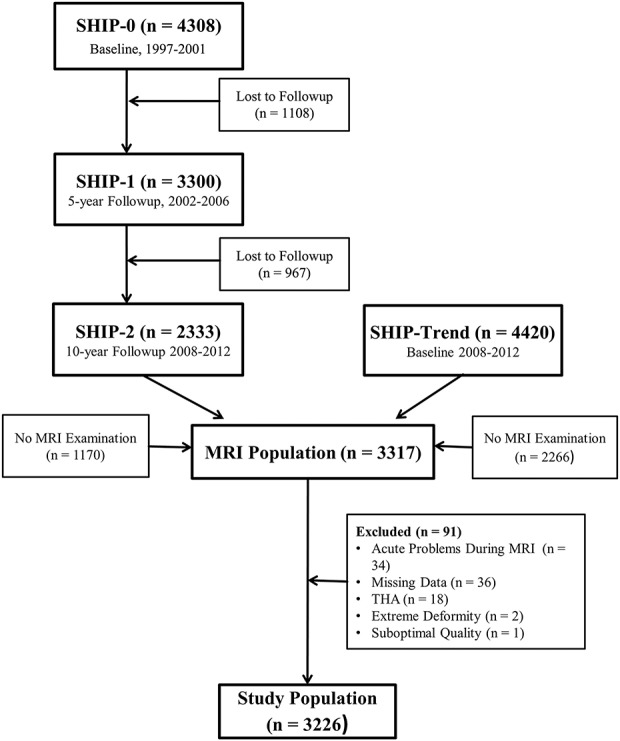
The flow diagram shows the cohort from inclusion to the final study population.
Table 1.
Study cohort characteristics
MRI Protocol
A pelvic MRI was performed as part of a standardized whole-body MRI in a 1.5-Tesla MR scanner (Magnetom Avanto; Siemens Medical Systems, Erlangen, Germany). All participants were placed in a supine position. Four trained technicians (AD, PB, BO, VR) performed all MRI examinations in a standardized manner. The complete imaging protocol and procedure is given by Hegenscheid et al. [21, 22].
Center-edge angle and alpha angle were assessed using coronal turbo inversion recovery magnitude sequence (repetition time 4891 msec; echo time 67 msec; flip angle 180°; voxel size 2.1 x 1.6 x 5.0 mm; scan time 12:09 minutes) and an axial proton density-turbo spin echo-fat saturation sequence of the pelvis (repetition time 3230 msec; echo time 34 msec; flip angle 180°; voxel size 1.6 x 1.6 x 3.0 mm; scan time 2:43 minutes).
Image Analysis
All measurements were performed by a trained observer (CBF) using OsiriX version 5.8.5 software (OsiriX, Bernex, Switzerland). The observer was blinded to participants’ sex, age, and all other clinical characteristics. The results were automatically documented and transferred to the SHIP database. All measurements were performed on the coronal planar image through the femoral head center, which was identified by using axial slices simultaneously.
The center-edge angle was measured as the angle between the vertical axis of the pelvis and a line connecting the femoral head center and the lateral acetabular margin (Fig. 2). The vertical axis of the pelvis was represented by a line connecting the center points of the femoral head of both sides. In all measurements, the center of the femoral head was assessed through the center of a best-fitting circle outlining the femoral head [1, 45].
Fig. 2.
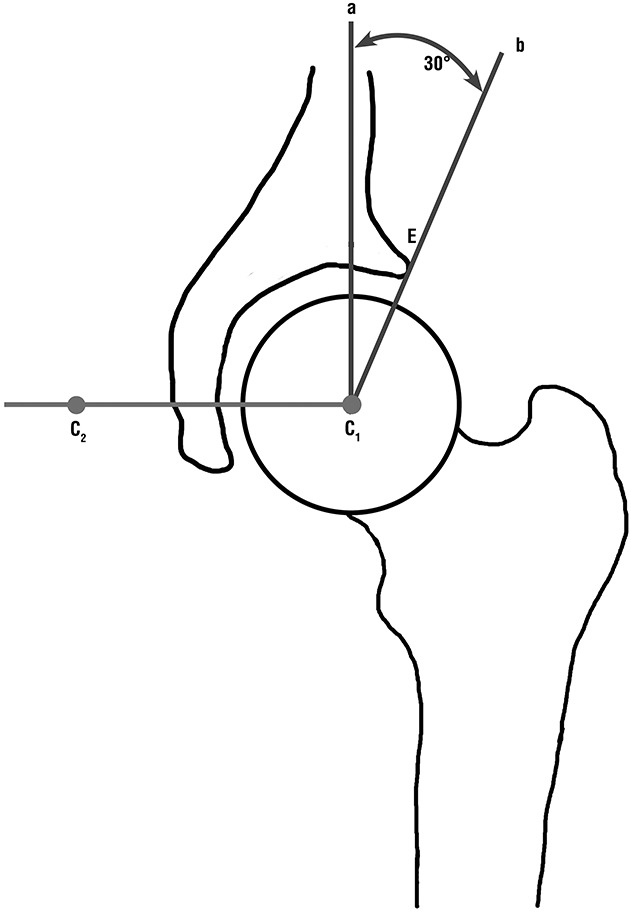
Wiberg’s center-edge angle is composed of a and b; a = line perpendicular to the connection line between each femoral head center (C1 und C2); E = lateral acetabular margin; b = line through C1 and E.
The alpha angle quantifies the femoral head-neck junction. As described by Nötzli et al. [39], it is calculated as the angle between the femoral neck axis and a line connecting the femoral head center and the point where the femoral head loses its sphericity. To measure it, the best-fitting circle in the femoral head is drawn. Using the point where the head-neck junction first leaves the circle, a line is drawn to the femoral head center. Then the femoral neck axis was formed by connecting the femoral head center and the center of the femoral neck, which is found through the midpoint at the narrowest part of the femoral neck. Gosvig et al. [17] modified the alpha angle for the AP plane. In the present study, we measured the alpha angle according to Nötzli et al., but in the coronal plane through the femoral head center (Fig. 3) [26, 28].
Fig. 3.
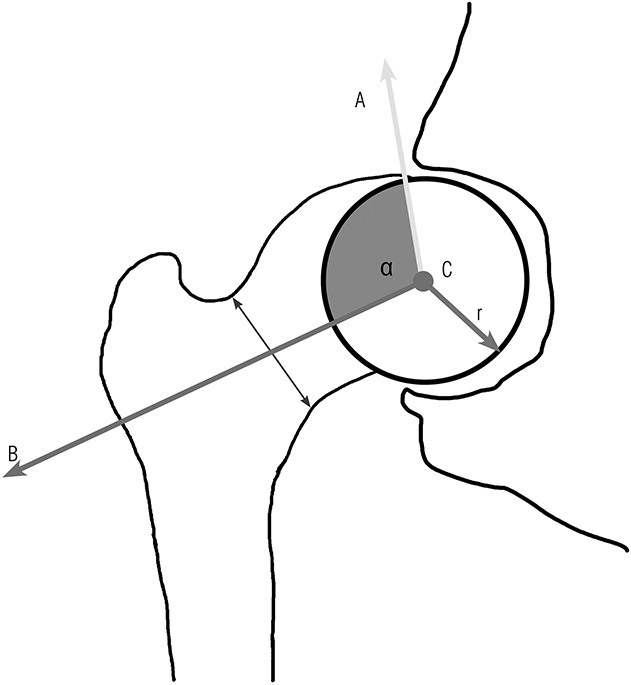
The alpha angle (α) is composed of A and B; A = axis through the departure of the radius (r) of the femoral head; B = femoral neck axis; C = center of the femoral head.
Data Analysis and Processing
To assess observer reliability in measuring center-edge angle and alpha angle, one examiner (CSF) measured 25 cases twice. Then another examiner (JL) measured the cases again. Intrareader and interreader variability was analyzed by Bland and Altman plots [6]. The intrareader and interreader variability of all measured parameters ranged between -0.49% ± 2.46% and 1.78% ± 4.35%, respectively (mean of difference ± SD). No intrareader and interreader variabilities were identified; thus, a good-quality standard was achieved.
Standard descriptive statistics such as mean values, SDs, ranges, and percentiles were used to describe the study cohort. We used the Student’s t-test for numeric variables and the chi-square test for categorical variables. All reported p values were two-tailed; p values < 0.05 were considered statistically significant.
We analyzed the correlation between both sides (left and right) using Spearman’s correlation coefficient. Associations of the center-edge angle and alpha angle with demographic and anamnestic data, including possible interactions between the parameters, were determined by linear regression analysis. We tested fractional polynomials for potential nonlinear associations between age and the angles. Interactions between age and sex were tested and p < 0.1 was considered statistically significant for these analyses.
Stratified by sex, age-specific upper and lower reference limits were calculated by quantile regressions for the 2.5th and 97.5th percentiles. According to previous studies, reference values were additionally calculated by the 95% reference interval (mean ± 1.96 SD) [15, 41]. All processing of statistics was performed with Stata 14.1 (Stata Corp LLC, College Station, TX, USA).
Results
Mean Center-edge Angle and Alpha Angle in This Population
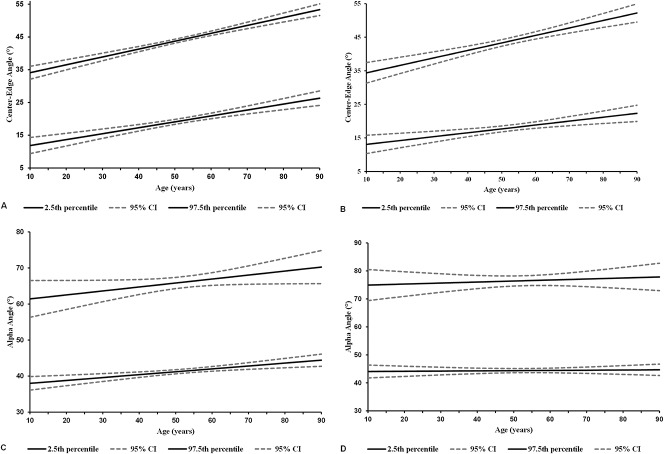
The mean center-edge angle was 31° (± 7°) with a corresponding calculated normal range of 17° to 45°. The mean alpha angle was 55° (± 8°) with a corresponding calculated normal range between 39° and 71°. Men (30° ± 7°) had a lower center-edge angle than women (32° ± 8°) (p < 0.001, β = 1.4°; 95% confidence interval [CI], 0.9°-1.9°) and a higher alpha angle (57° ± 8° versus 52° ± 7°, p < 0.001, β = 5.7°; 95% CI, 5.2°-6.3°). Moreover, there was a difference of 3° between right (30° ± 8°) and left (33° ± 8°) for the center-edge angle (p < 0.001; 95% CI, 3.0°-3.4°). No side differences were detected for alpha angle (55° ± 10° versus 54° ± 10°, p = 0.976; Table 2). As a result of the differences in sex, separate normal ranges were calculated for men and women (Table 3). Furthermore, because of known associations with sex and age, figures and formulas with adjusted reference values for women (Fig. 4A) and men (Fig. 4B) for the center-edge angle were developed. Accordingly, figures and formulas for the alpha angle (women: Fig. 4C, men: Fig. 4D) were provided.
Table 2.
Center-edge angle and alpha angle
Table 3.
Calculated reference values
Fig. 4 A-D.
Sex- and age-dependent reference values for center-edge angle and alpha angle based on fractional polynomials are shown. Reference values of center-edge angle for women (A) and men (B) increase with age. The formulas for women are 10.04 + 0.181 × age for the lower limit and 31.68 + 0.241 × age for the upper limit. For men, the lower limit is calculated by 11.91 + 0.116 × age and the upper limit by 32.15 + 0.223 × age. The adjusted reference values for alpha angle increase for women (C, formula lower limit: 37.19 + 0.080 × age, upper limit 60.31 + 0.110 × age), whereas they stay nearly steady for men (D, formula lower limit 43.99 + 0.008 × age, upper limit of 74.58 + 0.036 × age). All reference values are given with corresponding 95% CIs.
Factors Associated With Center-edge Angle and Alpha Angle
Center-edge Angle
For the center-edge angle, we observed associations between increasing center-edge angle and increasing age, increasing height, decreasing BMI, and decreasing waist circumference. As age increased, the center-edge angle increased likewise, more so in younger patients than older patients (p < 0.001). Furthermore, women had a 1.4° higher center-edge angle than men (p < 0.001; 95% CI, 0.9°–1.9°). As a result of these associations, age- and sex-adjusted reference values were calculated for women (Fig. 4A) and men (Fig. 4B). The association between BMI and center-edge angle increases with higher BMI (eg, 0.4° from 20 kg/m2 to 25 kg/m2 and 1.4° from 30 kg/m2 to 35 kg/m2, p < 0.001). Weight had no association with the center-edge angle (Fig. 5). In contrast, height was linked to the center-edge angle; per 10-cm of height, the center-edge angle decreases approximately by 1° (p < 0.001; Fig. 6). Waist circumference was negatively associated with center-edge angle (p < 0.001). Apart from these associations, we observed a tight correlation between left and right hips (r = 0.647, p < 0.001). The alpha angle was not associated with center-edge angle (p = 0.058).
Fig. 5.
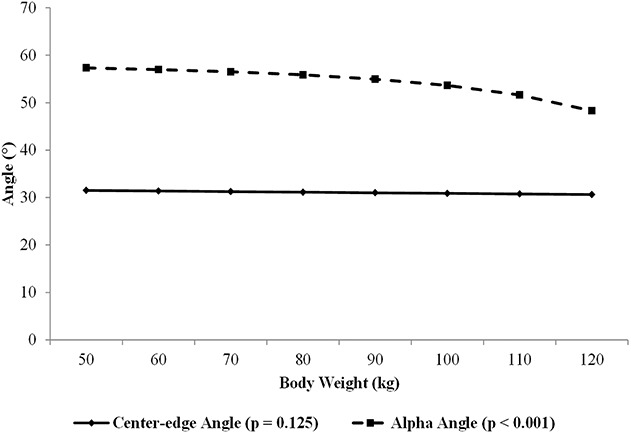
The association of center-edge angle and alpha angle with increasing body weight is shown. The alpha angle decreases, whereas the center-edge angle stays steady.
Fig. 6.
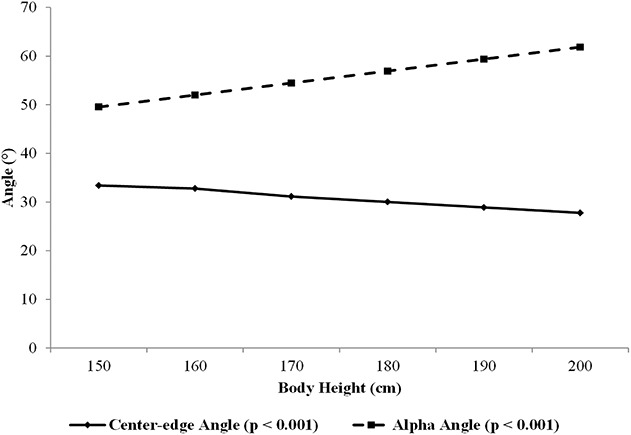
The association of center-edge angle and alpha angle with increasing body height is shown. The alpha angle increases, whereas the center-edge angle decreases.
Alpha Angle
We observed associations for an increased alpha angle with increasing age, increasing height (in women but not in men), decreasing BMI, decreasing weight, and decreasing waist circumference. The alpha angle in right and left hips was the same (r = 0.366, p < 0.001). Furthermore, the mean alpha angle was 5.7° lower in women than in men (p < 0.001; 95% CI, 5.21°-6.25°). With increasing age, the alpha angle increased (p = 0.002, 0.3°/10 years) for the group as a whole; however, we found that the alpha angle increases with age for women but not for men (p < 0.001). As a result of these associations, age- and sex-specific reference values were calculated separately for women (Fig. 4C) and men (Fig. 4D). With higher BMI, the alpha angle decreases (p < 0.001). Weight was associated with the alpha angle as well, whereby the alpha angle narrows as weight increases (p < 0.001; Fig. 5). Taller patients had greater alpha angles (p < 0.001; Fig. 6); for every additional 10 cm of height, the alpha angle increased by 2.5°. Greater waist circumference was associated with a lower alpha angle (p < 0.001).
Discussion
Radiographic descriptions such as the center-edge angle and the alpha angle are often used as part of the decision-making process for orthopaedic hip surgery, but the justification for use of certain thresholds or values is surprisingly sparse. In addition, several associations with sex and age are described, but other possible associations with anthropometric data are rarely investigated. Moreover, to our knowledge, there is no study that took those associations into account while calculating reference values. Therefore, the aim of the present study was to determine reference values for the center-edge angle and alpha angle, to investigate associated factors, and to calculate adjusted reference values. The mean center-edge angle was 31° ± 7° with a corresponding normal range of 17° to 45°. The mean alpha angle was 55° (± 8°) with a corresponding calculated normal range between 39° and 71°. We found that radiographic values differed, depending on age, sex, and anthropometric data, and calculated reference values on this basis (Fig. 4).
A limitation of the present study may be the assessment of the center-edge angle and alpha angle on coronal MR images. However, because MRI examinations are available and frequently used all over the world, more and more studies use them to assess those angles [1, 26, 28, 47]. It may be argued that coronal images are not adequate for measurements of the alpha angle and direct transfer to radiographic evaluation might be limited as well. However, as Gosvig et al. [17] revealed, most femoral head-neck malformations can be detected on AP radiographs at an acceptable level. Therefore, they concluded that the AP view is a viable method for epidemiologic acquisition on the alpha angle. Other studies, for example, the population-based approach of Laborie et al. [30] or Jung et al. [27], also used the AP view. Because AP radiographs are the most similar plane to the coronal view used here and many similarities in means are given for center-edge angle (Fig. 7) and alpha angle (Fig. 8), we believe that our measurements in coronal MR images are reliable. However, because of the three-dimensional morphology of the femoral head-neck junction, it is possible that the alpha angle could even have been underestimated. Despite this limitation, other acquisition techniques showed similar values for the alpha angle [19, 31, 51]. Another weakness of the current study is the cross-sectional design, which only provides associations but no cause-and-effect relationships. For cause-and-effect relationships, longitudinal studies will be needed. In our opinion, it is nonetheless important to know the relationships in a normal population, whether they are associations or causations, because associations have to be taken into account for surgical decisions as well. A further upcoming question might be how representative our population is for Pomerania. Through the randomized selection mechanism and the stratification variables (sex, age, and city of residence), ours can be considered representative. Although we did not exclude any participants based on ethnicity, our study had a relatively homogeneous white population. Some studies described ethnic differences for the center-edge angle [34, 44, 51, 55] and the alpha angle [26, 51]; therefore, the values seen in our study may not apply to nonwhite individuals. Another limitation is the possible inclusion of participants with hip pathology. However, because severe pathology is mostly treated by surgery with metal implants, these participants are ruled out because of the contraindication for MRI. Moreover, whole-body MRI was voluntary and took approximately 2 hours. Therefore, it can be assumed that participants with severe pain (eg, hip or back pain) did not undergo or aborted this procedure. Furthermore, we studied a general population, so it can be expected that the majority of participants are healthy and without pathology. As a result of these reasons, we assume that reliable population-based reference values are provided, which has been the purpose of our study.
Fig. 7 A-B.
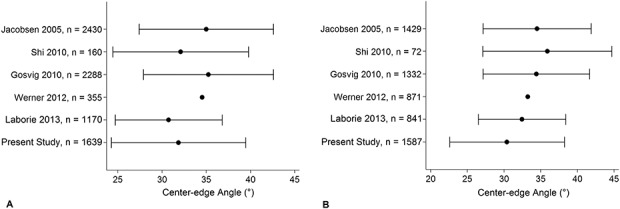
Means and SDs of center-edge angle for women (A) and men (B) of previous studies and the present study are shown for comparison.
Fig. 8 A-B.
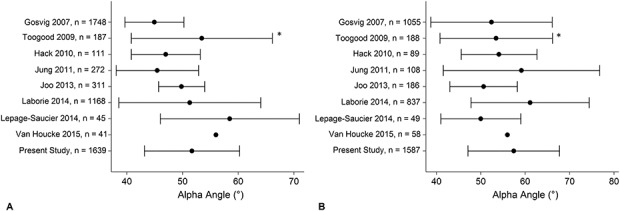
Means and SDs of alpha angle for women (A) and men (B) of previous studies and the present study are shown for comparison. Toogood et al. [49] just presented mixed data for women and men (*).
The values we obtained are in rough accordance with other studies for both the center-edge angle (Fig. 7) and the alpha angle (Fig. 8). However, different ranges have been published as reference values. Wiberg [54] originally declared center-edge angle < 20° as pathologic, whereas the upper thresholds vary from > 40° [8, 9, 48] to > 45° [18, 31]. For studies on normal values, various results are described. Fowkes et al. [14] assessed reference values between 22.5° and 50.1°. Other small studies described ranges from 27° to 55° [47] and 23° to 43° [24]. As a result of the small sample sizes and nonpopulation-based selection, direct comparison of the results is challenging. In a large, nonpopulation-based cohort, Werner et al. [53] determined normal values ranging between 18.1° and 48.0° using 1226 hip radiographs. In a young (mean age, 18.6 years) Norwegian cohort, Laborie et al. [29] described normal values between 20.8° and 45.0° for men and 19.6° and 43.4° for women. Despite demographic differences, the present epidemiologic study showed similar but slightly lower reference values (Fig. 7). Werner et al. [53] decided that they see no contradiction to the historic cutoff with their difference of approximately 2°. Because we assessed lower values as well, smaller angles should not necessarily be considered pathologic. With respect to the upper thresholds, our results support the use of center-edge angle > 45°. Moreover, because of known associations with age and sex, adjusted reference values seem advantageous. Equally for the alpha angle, a consensus on thresholds and reference values is lacking. Reasonable explanations may be attributed to different modalities and techniques in the assessment of alpha angles. Based on sex differences, some authors proposed different thresholds for men and women [15, 17, 31]. Despite different measurement techniques and cohort sizes, some authors described values similar to our data (Fig. 8). Lepage-Saucier et al. [31] analyzed thresholds of 68° (men) and 69° (women) on axial oblique CT data. Based on AP radiographs, Fraitzl et al. [15] proposed thresholds of 70° for men and 61° for women, a sex difference of almost 10°, like in the present study. However, in their population-based study on AP radiographs, Gosvig et al. [17] documented even greater differences with cutoffs of 83° for men and 57° for women. This could be caused by the different compositions of the populations (age, sex, and region). Like in previous studies [15, 17, 30], our results support the need for different cutoffs according to sex and a higher threshold than initially described by Nötzli et al. [39]. Consequently, we tried to provide reference values based on our epidemiologic study. Because other factors might influence the alpha angle more, differentiated reference values might be needed as well.
With respect to potential associations among age, anthropometric data, and hip morphology (center-edge angle and alpha angle), we found consistent associations of the center-edge angle with age. In addition, we assessed higher center-edge angle for women (32° ± 8° versus 30° ± 7°, p < 0.001; 95% CI, 0.9°–1.9°). This coincides with previous studies for the association with age [2, 3, 7, 16, 34, 36, 40, 50, 53] like the higher values for women [23, 32, 53], although they had smaller sample sizes, nonpopulation-based approaches, or different measurement modalities. Therefore, our study provided substantiation for those associations for white populations. Consequently, we provided age- and sex-dependent reference values with a belonging formula for a more accurate interpretation of center-edge angles. Moreover, we found an association between body height and center-edge angle. Because weight was not associated with center-edge angle, only a minor negative association with BMI and waist circumference was detected. Another difference was found in sides (left > right, 33° ± 8 versus 30° ± 8, p < 0.001; 95% CI, 3.0°-3.4°), which is consistent with some studies [34, 37], but different results are described as well [14, 47, 53, 56]. Because there is no evident explanation, it is possible that these findings have no clinical relevance [53].
Like in most published studies [4, 15, 17, 27, 30, 46, 49], men had higher alpha angles in our population (57° ± 8° versus 52° ± 7°, p < 0.001; 95% CI, 5.21°-6.25°). This coincides with previous studies, although they had different populations. Thereby our study points out the differences in sex for white populations. In contrast to some other studies [4, 19, 26, 27, 46], the SHIP population showed a slight increase in alpha angle with age, whereas an interaction between sex and age was found in which the alpha angle increases with age for women but not for men. This among others (smaller sample sizes, different composition of the sample sizes, or different ethnicity) might be a reason for different results. As a result of these associations, adjusted reference values were calculated and a formula was provided for the alpha angle. In addition to this, body height was positively associated with alpha angle, whereas BMI, weight, and waist circumference had a negative association.
Characterization of a patient’s hip as normal or pathologic can be difficult. This is particularly true when there is substantial overlap between radiographic features that are considered normal and those that are not. To date, there is no consensus on thresholds and reference values. Here, we provide values that can be readily obtained with reproducible imaging protocols based on a large population of adults. In addition to that, certain demographic features may influence what should be considered normal. Therefore, we proposed age- and sex-adjusted reference values, which could be used for better interpretation. Because the range of normal center-edge and alpha angles is quite wide, it is likely that only notably abnormal angles may be associated with pathology. We caution that radiography in isolation is not enough to label a hip as diseased and that different populations may have different ranges of normal angular measurements. Further studies would help assess reference values for other populations. Moreover, longitudinal studies should be performed for evidence of cause-and-effect relationships.
Acknowledgments
We thank our four trained technicians Angela Doss, Petra Bartel, Brigitte Olbrich, and Vera Radons who performed all MRI examinations, all members of the Institute of Community Medicine, and all participants.
Footnotes
Each author certifies that neither he, nor any member of his immediate family, has funding or commercial associations (consultancies, stock ownership, equity interest, patent/licensing arrangements, etc) that might pose a conflict of interest in connection with the submitted article.
All ICMJE Conflict of Interest Forms for authors and Clinical Orthopaedics and Related Research® editors and board members are on file with the publication and can be viewed on request.
Clinical Orthopaedics and Related Research® neither advocates nor endorses the use of any treatment, drug, or device. Readers are encouraged to always seek additional information, including FDA approval status, of any drug or device before clinical use.
Each author certifies that his institution approved the human protocol for this investigation and that all investigations were conducted in conformity with ethical principles of research.
This work was performed at University Medicine Greifswald, Greifswald, Germany.
References
- 1.Aly AR, Rajasekaran S, Obaid H. MRI morphometric hip comparison analysis of anterior acetabular labral tears. Skeletal Radiol. 2013;42:1245–1252. [DOI] [PubMed] [Google Scholar]
- 2.Aly TA. Hip morphologic measurements in an Egyptian population. Orthopedics. 2011;34:262. [DOI] [PubMed] [Google Scholar]
- 3.Beall DP, Martin HD, Mintz DN, Ly JQ, Costello RF, Braly BA, Yoosefian F. Anatomic and structural evaluation of the hip: a cross-sectional imaging technique combining anatomic and biomechanical evaluations. Clin Imaging. 2008;32:372–381. [DOI] [PubMed] [Google Scholar]
- 4.Beaulé PE, Zaragoza E, Motamedi K, Copelan N, Dorey F. Three-dimensional computed tomography of the hip in the assessment of femoroacetabular impingement. J Orthop Res. 2005;23:1286–1292. [DOI] [PubMed] [Google Scholar]
- 5.Bixby SD, Kienle K, Nasreddine A, Zurakowski D, Kim Y, Yen Y. Reference values for proximal femoral anatomy in adolescents based on sex, physis, and imaging plane. Am J Sports Med. 2013;41:2074–2082. [DOI] [PubMed] [Google Scholar]
- 6.Bland JM, Altman DG. Statistical methods for assessing agreement between two methods of clinical measurement. Lancet. 1986;1:307–310. [PubMed] [Google Scholar]
- 7.Bouyer B, Mazieres B, Guillemin F, Bouttier R, Fautrel B, Morvan J, Pouchot J, Rat A, Roux CH, Verrouil E, Saraux A, Coste J. Association between hip morphology and prevalence, clinical severity and progression of hip osteoarthritis over 3 years: the knee and hip osteoarthritis long-term assessment cohort results. Joint Bone Spine. 2016;83:432–438. [DOI] [PubMed] [Google Scholar]
- 8.Chung CY, Park MS, Lee KM, Lee SH, Kim TK, Kim KW, Park JH, Lee JJ. Hip osteoarthritis and risk factors in elderly Korean population. Osteoarthritis Cartilage. 2010;18:312–316. [DOI] [PubMed] [Google Scholar]
- 9.Clohisy JC, Dobson MA, Robison JF, Warth LC, Zheng J, Liu SS, Yehyawi TM, Callaghan JJ. Radiographic structural abnormalities associated with premature, natural hip-joint failure. J Bone Joint Surg Am. 2011;93(Suppl 2):3–9. [DOI] [PubMed] [Google Scholar]
- 10.Clohisy JC, Nunley RM, Otto RJ, Schoenecker PL. The frog-leg lateral radiograph accurately visualized hip cam impingement abnormalities. Clin Orthop Relat Res. 2007;462:115–121. [DOI] [PubMed] [Google Scholar]
- 11.Delaunay S, Dussault RG, Kaplan PA, Alford BA. Radiographic measurements of dysplastic adult hips. Skeletal Radiol. 1997;26:75–81. [DOI] [PubMed] [Google Scholar]
- 12.Dolan MM, Heyworth BE, Bedi A, Duke G, Kelly BT. CT reveals a high incidence of osseous abnormalities in hips with labral tears. Clin Orthop Relat Res. 2011;469:831–838. [DOI] [PMC free article] [PubMed] [Google Scholar]
- 13.Engesaeter IO, Laborie LB, Lehmann TG, Fevang JM, Lie SA, Engesaeter LB, Rosendahl K. Prevalence of radiographic findings associated with hip dysplasia in a population-based cohort of 2081 19-year-old Norwegians. Bone Joint J. 2013;95:279–285. [DOI] [PubMed] [Google Scholar]
- 14.Fowkes LA, Petridou E, Zagorski C, Karuppiah A, Toms AP. Defining a reference range of acetabular inclination and center-edge angle of the hip in asymptomatic individuals. Skeletal Radiol. 2011;40:1427–1434. [DOI] [PubMed] [Google Scholar]
- 15.Fraitzl CR, Kappe T, Pennekamp F, Reichel H, Billich C. Femoral head-neck offset measurements in 339 subjects: distribution and implications for femoroacetabular impingement. Knee Surg Sports Traumatol Arthrosc. 2013;21:1212–1217. [DOI] [PubMed] [Google Scholar]
- 16.Fredensborg N. The CE angle of normal hips. Acta Orthop. 1976;47:403–405. [DOI] [PubMed] [Google Scholar]
- 17.Gosvig KK, Jacobsen S, Palm H, Sonne-Holm S, Magnusson E. A new radiological index for assessing asphericity of the femoral head in cam impingement. J Bone Joint Surg Br. 2007;89:1309–1316. [DOI] [PubMed] [Google Scholar]
- 18.Gosvig KK, Jacobsen S, Sonne-Holm S, Palm H, Troelsen A. Prevalence of malformations of the hip joint and their relationship to sex, groin pain, and risk of osteoarthritis: a population-based survey. J Bone Joint Surg Am. 2010;92:1162–1169. [DOI] [PubMed] [Google Scholar]
- 19.Hack K, Di Primio G, Rakhra K, Beaulé PE. Prevalence of cam-type femoroacetabular impingement morphology in asymptomatic volunteers. J Bone Joint Surg Am. 2010;92:2436–2444. [DOI] [PubMed] [Google Scholar]
- 20.Haddad FS, Garbuz DS, Duncan CP, Janzen DL, Munk PL. CT evaluation of periacetabular osteotomies. J Bone Joint Surg Br. 2000;82:526–531. [DOI] [PubMed] [Google Scholar]
- 21.Hegenscheid K, Kühn JP, Völzke H, Biffar R, Hosten N, Puls R. Whole-body magnetic resonance imaging of healthy volunteers: pilot study results from the population-based SHIP study. Rofo. 2009;181:748–759. [DOI] [PubMed] [Google Scholar]
- 22.Hegenscheid K, Seipel R, Schmidt CO, Volzke H, Kuhn J, Biffar R, Kroemer HK, Hosten N, Puls R. Potentially relevant incidental findings on research whole-body MRI in the general adult population: frequencies and management. Eur Radiol. 2013;23:816–826. [DOI] [PubMed] [Google Scholar]
- 23.Jacobsen S, Sonne-Holm S, Soballe K, Gebuhr P, Lund B. Hip dysplasia and osteoarthrosis: a survey of 4151 subjects from the Osteoarthrosis Substudy of the Copenhagen City Heart Study. Acta Orthop. 2005;76:149–158. [DOI] [PubMed] [Google Scholar]
- 24.Janzen DL, Aippersbach SE, Munk PL, Sallomi DF, Garbuz D, Werier J, Duncan CP. Three-dimensional CT measurement of adult acetabular dysplasia: technique, preliminary results in normal subjects, and potential applications. Skeletal Radiol. 1998;27:352–358. [DOI] [PubMed] [Google Scholar]
- 25.John U, Greiner B, Hensel E, Lüdemann J, Piek M, Sauer S. Study of Health in Pomerania (SHIP): a health examination survey in an east German region: objectives and design. Soz Praventivmed. 2001;46:186–194. [DOI] [PubMed] [Google Scholar]
- 26.Joo JH, Lee SC, Ahn HS, Park JS, Lee WJ, Am Jung K. Evaluation of the alpha angle in asymptomatic adult hip joints: analysis of 994 hips. Hip Int. 2013;23:395–399. [DOI] [PubMed] [Google Scholar]
- 27.Jung KA, Restrepo C, Hellman M, AbdelSalam H, Morrison W, Parvizi J. The prevalence of cam-type femoroacetabular deformity in asymptomatic adults. J Bone Joint Surg Br. 2011;93:1303–1307. [DOI] [PubMed] [Google Scholar]
- 28.Kumar R, Aggarwal A, Krishnan V, Gopinathan N, Chakraborty S. Femoroacetabular impingement and comparison of radiological indexes: a study on 50 cases. Musculoskelet Surg. 2013;97:153–158. [DOI] [PubMed] [Google Scholar]
- 29.Laborie LB, Engesæter IØ, Lehmann TG, Sera F, Dezateux C, Engesæter LB, Rosendahl K. Radiographic measurements of hip dysplasia at skeletal maturity–new reference intervals based on 2038 19-year-old Norwegians. Skeletal Radiol. 2013;42:925–935. [DOI] [PubMed] [Google Scholar]
- 30.Laborie LB, Lehmann TG, Engesæter IØ, Sera F, Engesæter LB, Rosendahl K. The alpha angle in cam-type femoroacetabular impingement: new reference intervals based on 2038 healthy young adults. Bone Joint J. 2014;96:449–454. [DOI] [PubMed] [Google Scholar]
- 31.Lepage-Saucier M, Thiéry C, Larbi A, Lecouvet FE, Vande Berg BC, Omoumi P. Femoroacetabular impingement: normal values of the quantitative morphometric parameters in asymptomatic hips. Eur Radiol. 2014;24:1707–1714. [DOI] [PubMed] [Google Scholar]
- 32.Li Y, Helvie P, Mead M, Gagnier J, Hammer MR, Jong N. Prevalence of femoroacetabular impingement morphology in asymptomatic adolescents. J Pediatr Orthop. 2017;37:121–126. [DOI] [PubMed] [Google Scholar]
- 33.Mast NH, Impellizzeri F, Keller S, Leunig M. Reliability and agreement of measures used in radiographic evaluation of the adult hip. Clin Orthop Relat Res. 2011;469:188–199. [DOI] [PMC free article] [PubMed] [Google Scholar]
- 34.McWilliams DF, Doherty SA, Jenkins WD, Maciewicz RA, Muir KR, Zhang W, Doherty M. Mild acetabular dysplasia and risk of osteoarthritis of the hip: a case-control study. Ann Rheum Dis. 2010;69:1774–1778. [DOI] [PubMed] [Google Scholar]
- 35.Monazzam S, Bomar JD, Cidambi K, Kruk P, Hosalkar H. Lateral center-edge angle on conventional radiography and computed tomography. Clin Orthop Relat Res. 2013;471:2233–2237. [DOI] [PMC free article] [PubMed] [Google Scholar]
- 36.Monazzam S, Bomar JD, Dwek JR, Hosalkar HS, Pennock AT. Development and prevalence of femoroacetabular impingement-associated morphology in a paediatric and adolescent population: a CT study of 225 patients. Bone Joint J. 2013;95:598–604. [DOI] [PubMed] [Google Scholar]
- 37.Morvan J, Bouttier R, Mazieres B, Verrouil E, Pouchot J, Rat A, Guellec D, Guillemin F, Coste J, Saraux A. Relationship between hip dysplasia, pain, and osteoarthritis in a cohort of patients with hip symptoms. J Rheumatol. 2013;40:1583–1589. [DOI] [PubMed] [Google Scholar]
- 38.Murphy SB, Kijewski PK, Millis MB, Harless A. Acetabular dysplasia in the adolescent and young adult. Clin Orthop Relat Res. 1990;261:214–223. [PubMed] [Google Scholar]
- 39.Nötzli HP, Wyss TF, Stoecklin CH, Schmid MR, Treiber K, Hodler J. The contour of the femoral head-neck junction as a predictor for the risk of anterior impingement. J Bone Joint Surg Br. 2002;84:556–560. [DOI] [PubMed] [Google Scholar]
- 40.Park J, Im G. The correlations of the radiological parameters of hip dysplasia and proximal femoral deformity in clinically normal hips of a Korean population. Clin Orthop Surg. 2011;3:121–127. [DOI] [PMC free article] [PubMed] [Google Scholar]
- 41.Pollard TCB, Villar RN, Norton MR, Fern ED, Williams MR, Simpson DJ, Murray DW, Carr AJ. Femoroacetabular impingement and classification of the cam deformity: the reference interval in normal hips. Acta Orthop. 2010;81:134–141. [DOI] [PMC free article] [PubMed] [Google Scholar]
- 42.Pun S, Kumar D, Lane NE. Femoroacetabular impingement. Arthritis Rheumatol. 2015;67:17–27. [DOI] [PMC free article] [PubMed] [Google Scholar]
- 43.Schmidt CO, Alte D, Volzke H, Sauer S, Friedrich N, Valliant R. Partial misspecification of survey design features sufficed to severely bias estimates of health-related outcomes. J Clin Epidemiol. 2011;64:416–423. [DOI] [PubMed] [Google Scholar]
- 44.Shi YY, Liu TJ, Zhao Q, Zhang LJ, Ji SJ, Wang EB. The normal centre-edge angle of Wiberg in the Chinese population: a population-based cross-sectional study. J Bone Joint Surg Br. 2010;92:1144–1147. [DOI] [PubMed] [Google Scholar]
- 45.Stelzeneder D, Hingsammer A, Bixby SD, Kim Y. Can radiographic morphometric parameters for the hip be assessed on MRI? Clin Orthop Relat Res. 2013;471:989–999. [DOI] [PMC free article] [PubMed] [Google Scholar]
- 46.Sutter R, Dietrich TJ, Zingg PO, Pfirrmann CW. How useful is the alpha angle for discriminating between symptomatic patients with cam-type femoroacetabular impingement and asymptomatic volunteers? Radiology. 2012;264:514–521. [DOI] [PubMed] [Google Scholar]
- 47.Tallroth K, Lepisto J. Computed tomography measurement of acetabular dimensions: normal values for correction of dysplasia. Acta Orthop. 2006;77:598–602. [DOI] [PubMed] [Google Scholar]
- 48.Tannast M, Siebenrock KA, Anderson SE. Femoroacetabular impingement: radiographic diagnosis–what the radiologist should know. AJR Am J Roentgenol. 2007;188:1540–1552. [DOI] [PubMed] [Google Scholar]
- 49.Toogood PA, Skalak A, Cooperman DR. Proximal femoral anatomy in the normal human population. Clin Orthop Relat Res. 2009;467:876–885. [DOI] [PMC free article] [PubMed] [Google Scholar]
- 50.Umer M, Sepah YJ, Asif S, Azam I, Jawad MU. Acetabular morphometry and prevalence of hip dysplasia in the South Asian population. Orthop Rev (Pavia). 2009;1:34–38. [DOI] [PMC free article] [PubMed] [Google Scholar]
- 51.van Houcke J, Yau WP, Yan CH, Huysse W, Dechamps H, Lau WH, Wong CS, Pattyn C, Audenaert EA. Prevalence of radiographic parameters predisposing to femoroacetabular impingement in young asymptomatic Chinese and white subjects. J Bone Joint Surg Am. 2015;97:310–317. [DOI] [PMC free article] [PubMed] [Google Scholar]
- 52.Völzke H, Alte D, Schmidt CO, Radke D, Lorbeer R, Friedrich N, Aumann N, Lau K, Piontek M, Born G, Havemann C, Ittermann T, Schipf S, Haring R, Baumeister SE, Wallaschofski H, Nauck M, Frick S, Arnold A, Jünger M, Mayerle J, Kraft M, Lerch MM, Dörr M, Reffelmann T, Empen K, Felix SB, Obst A, Koch B, Gläser S, Ewert R, Fietze I, Penzel T, Dören M, Rathmann W, Haerting J, Hannemann M, Röpcke J, Schminke U, Jürgens C, Tost F, Rettig R, Kors JA, Ungerer S, Hegenscheid K, Kühn J, Kühn J, Hosten N, Puls R, Henke J, Gloger O, Teumer A, Homuth G, Völker U, Schwahn C, Holtfreter B, Polzer I, Kohlmann T, Grabe HJ, Rosskopf D, Kroemer HK, Kocher T, Biffar R, John U, Hoffmann W. Cohort profile: the study of health in Pomerania. Int J Epidemiol. 2011;40:294–307. [DOI] [PubMed] [Google Scholar]
- 53.Werner CML, Ramseier LE, Ruckstuhl T, Stromberg J, Copeland CE, Turen CH, Rufibach K, Bouaicha S. Normal values of Wiberg's lateral center-edge angle and Lequesne's acetabular index–a coxometric update. Skeletal Radiol. 2012;41:1273–1278. [DOI] [PubMed] [Google Scholar]
- 54.Wiberg G. Studies on the dysplastic acetabula and congenital subluxation of the hip joint. Acta Chir Scand. 1939:5–135. [Google Scholar]
- 55.Yoshimura N, Campbell L, Hashimoto T, Kinoshita H, Okayasu T, Wilman C, Coggon D, Croft P, Cooper C. Acetabular dysplasia and hip osteoarthritis in Britain and Japan. Br J Rheumatol. 1998;37:1193–1197. [DOI] [PubMed] [Google Scholar]
- 56.Zeng Y, Wang Y, Zhu Z, Tang T, Dai K, Qiu S. Differences in acetabular morphology related to side and sex in a Chinese population. J Anat. 2012;220:256–262. [DOI] [PMC free article] [PubMed] [Google Scholar]


