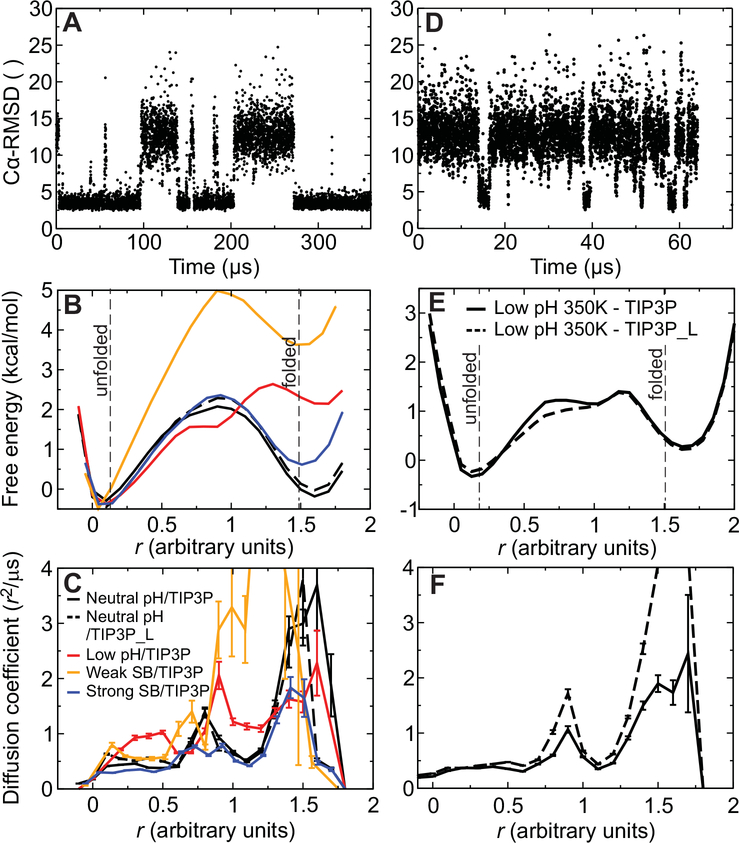
Fig. 5. Trajectories, free energy surfaces, and diffusion coefficients from MD simulations of reversible folding of α3D.
(A) Time series of the Cα RMSD from the experimental native structure for a 360-μs simulation of α3D performed at 370 K and neutral pH. (B) One-dimensional projection of the folding free energy surface along an optimized reaction coordinate (30). The cutoffs used for determining rates and transition path times in the analysis to define the folded and unfolded states are indicated by two vertical lines. The different simulations are distinguished using the color scheme described in panel C. (C) Diffusion coefficients along the optimized reaction coordinate for neutral-pH (black) and low-pH (red) simulations performed at 370 K. Results are also reported for simulations performed with weak (orange) or strong (blue) salt bridges and for a 370-K, neutral-pH simulation performed at low viscosity (black dashed line). (D) Time series of the Cα RMSD for a 65-μs simulation of α3D performed at 370 K and low pH. (E) One-dimensional projection of the folding free energy surface for low-pH simulations performed at 350 K and either normal viscosity (black solid line) or low viscosity (black dashed line). (F) Diffusion coefficients (350 K) along the optimized reaction coordinate. The different simulations are distinguished using the same scheme employed in panel E.

