Abstract
Biogenic isoprene emissions play a very important role in atmospheric chemistry. These emissions are strongly dependent on various environmental conditions, such as temperature, solar radiation, plant water stress, ambient ozone and CO2 concentrations, and soil moisture. Current biogenic emission models (i.e., Model of Emissions of Gases and Aerosols from Nature, MEGAN) can simulate emission responses to some of the major driving variables, such as short-term variations in temperature and solar radiation, but the other factors are either missing or poorly represented. In this paper, we propose a new modeling approach that considers the physiological effects of drought stress on plant photosynthesis and isoprene emissions for use in the MEGAN3 biogenic emission model. We test the MEGAN3 approach by integrating the algorithm into the existing MEGAN2.1 biogenic emission model framework embedded into the global Community Land Model of the Community Earth System Model (CLM4.5/CESM1.2). Single-point simulations are compared against available field measurements at the Missouri Ozarks AmeriFlux (MOFLUX) field site. The modeling results show that the MEGAN3 approach of using of a photosynthesis parameter (Vcmax) and soil wetness factor (βt) to determine the drought activity factor leads to better simulated isoprene emissions in non-drought and drought periods. The global simulation with the MEGAN3 approach predicts a 17% reduction in global annual isoprene emissions, in comparison to the value predicted using the default CLM4.5/MEGAN2.1 without any drought effect. This reduction leads to changes in surface ozone and oxidants in the areas where the reduction of isoprene emissions is observed. Based on the results presented in this study, we conclude that it is important to simulate the drought-induced response of biogenic isoprene emission accurately in the coupled Earth System model.
Keywords: Drought, biogenic isoprene emissions, modeling
1. Introduction
Biogenic volatile organic compounds (BVOCs) emitted from terrestrial ecosystems play a very important role in atmospheric chemistry (Wiedinmyer et al., 2006; Goldstein and Galbally, 2007; Pacifico et al., 2012; Pryor et al., 2014). Thousands of BVOCs have been characterized, and there is growing evidence that many more remain to be identified (Park et al., 2013). Biogenic isoprene, one of the key identified BVOCs, is emitted in large quantities by vegetation. Global estimation of biogenic isoprene emission is 440-600 TgC per year, approximately half of the total BVOC emissions (Guenther et al., 2012). Biogenic isoprene emissions are highly reactive and contribute to various atmospheric processes such as the formation of tropospheric ozone, lifetime of methane, and growth of secondary organic aerosols (SOAs), which could have important climatic impacts (Claeys et al., 2004; Paulot et al., 2009). Biogenic isoprene emissions not only affect atmospheric composition and climate, but also are also strongly dependent on climatic conditions (i.e., temperature, solar radiation, plant water stress, ambient ozone, and CO2 concentrations), landcover, and atmospheric chemistry conditions (i.e., Pacifico et al., 2012). Thus, understanding how these emissions respond to changes in climate is crucial for predicting important feedback in the biosphere-atmosphere-climate system (Peñuelas and Staudt, 2010).
Because of their important air quality and climatic implications, biogenic isoprene emissions are now routinely included in coupled climate/chemistry models—such as regional and global air quality and earth system models (i.e., WRF-Chem, [Grell et al., 2005[; CESM, [Gent et al., 2011]). However, despite much progress that has been made in estimating biogenic isoprene emissions using numerical models, there are still large uncertainties in the magnitude and variability of the model-estimated isoprene emissions (e.g., Folberth et al., 2006; Derwent et al., 2007; Arneth et al., 2008; Guenther 2013). To better assess past, present, and future air quality and climate (e.g., Derwent et al., 2007; Folberth et al., 2006; Jiang et al., 2010; Pacifico et al., 2012; Squire et al., 2014) and better simulate the impacts of environmental conditions on isoprene emissions and the associated feedbacks, more accurate isoprene emission estimates are needed. Obtaining these more accurate estimates requires consideration of environmental drivers such as phenology, enzymatic activity, biotic stress, drought and other abiotic stresses.
The sensitivity of isoprene emissions to several environmental factors (i.e. temperature, radiation, CO2) has been well documented (Monson et al, 1994; Sharkey et al., 1999; Petron et al., 2001; Guenther et al., 2006, 2012; Arneth et al., 2007; Heald et al., 2009). The early studies of the sensitivity of isoprene emissions to temperature and light served as the basis of the first BVOC emission models (Monson et al., 1994; Sharkey et al., 1999; Tingey et al., 1981, Guenther et al., 1991, 1993; Lamb et al., 1993). Monson et al., (2012), Pacifico et al., (2012), Unger et al., (2013), Grote et al., (2014) have tried to include a more mechanistic representation of environmental factors affecting isoprene emissions in BVOC emission models. However, the impacts of climate extremes on biogenic emissions have received little attention because of a lack of observations. Climate extremes such as droughts are known to impact ecosystem function severely, including the amount of BVOCs emitted by plants (i.e. Pegoraro et al., 2004). Studies have shown that climate extremes and associated changes in ecosystems are increasing in frequency and magnitude (IPCC, 2013). Under future climate scenarios, more droughts are projected in many parts of the world (Jiang et al., 2013; Rauscher et al., 2015; McDowell et al., 2015). Accurate predictions of future changes in biogenic emissions will need to consider drought and other stresses. We therefore urgently need a better mechanistic understanding to estimate BVOC emissions under different extreme conditions—such as drought.
Many studies have investigated the impacts of drought on plants (Tingey et al., 1981; Sharkey and Loreto, 1993; Pegorato et al. 2004; Brilli et al., 2007; Saveyn et al., 2007; De Swaef and Steppe, 2010; Zhou et al., 2014) and have found that photosynthetic rate, stomatal conductance, and transpiration rates decline when soil water content decreases. However, the effects of drought stress on BVOC emissions are more complex. Drought stress can alter the composition of BVOCs depending on the level of stress (Niinemets, 2009). Various studies (Tingey et al., 1981; Pegoraro et al., 2004; Grote et al., 2009) have shown that the BVOC emissions can initially be increased or decreased but this is ultimately followed by a decrease. Tingey et al. (1981) and Pegoraro et al. (2004) found that during short-term drought, isoprene emission rates stay constant or even increase slightly at the initial stages of drought. They also found a large reduction in isoprene emissions after 12 days of severe drought for some oak trees. The shutdown of the physiological processes of a plant in response to drought can lead to an initial increase in emissions, followed by a decrease and then termination of isoprene emission (Pegoraro et al., 2004; Beckett et al., 2012). In the initial phase of a drought (mild drought), plants respond by reducing water loss through transpiration by reducing stomatal conductance. This reduction is accompanied by a decrease in evaporative cooling and an increase in leaf temperature. If the plant has sufficient reduced carbon resources from stored reserves, this reduction can lead to an increase in isoprene emissions. However, these reserves will be depleted if the drought condition persists, and isoprene emissions will then decrease.
The observations of Pegoraro et al. (2004) serve as the basis for the drought effect on isoprene emissions that is currently embedded in Model of Emissions of Gases and Aerosols from Nature version 2.1 (MEGAN2.1, Guenther et al., 2006, 2012). Several studies (Seco et al., 2015; Huang et al., 2015) have shown more recently that the current drought algorithm (and resulting isoprene emission estimates) in MEGAN 2.1 is highly dependent on the selection of wilting point values. When different wilting point values are used to drive MEGAN, the resulting drought impacts on isoprene emissions are substantially different. To better understand how drought impacts biogenic isoprene emissions, more field measurements of BVOCs are needed. However, measurements of BVOC emissions under drought conditions are currently very limited, which makes it challenging to develop and test a more mechanistic representation of drought impacts on BVOCs for numerical biogenic emission models. Soil moisture was also identified as a key source of uncertainty in predicting the response of isoprene emission to water stress (Monson et al., 2012; Tawfik et al., 2012; Huang et al., 2015). However, when drought stress occurs, it changes plant physiology as well in complex ways. Šimpraga et al. (2011) and Grote et al. (2014) have attempted to include the linkage between photosynthesis and BVOC emissions in emission models, but the effect of drought on emissions is complex and not easily represented.
Drought responses of photosynthesis are already incorporated into the vegetation component of most Earth System Models (i.e., Oleson et al., 2013), providing a potential pathway for improving BVOC emission estimates. The aim of this study is to develop a simple mechanistic representation of the drought response of isoprene emission and demonstrate the global impacts using an Earth System model – the Community Earth System Model (CESM) (Gent et al., 2011). The Community Land Model (CLM4.5) of CESM (Oleson et al., 2013) is equipped with the MEGAN2.1 biogenic emission model. Section 2 describes the MEGAN2.1 and MEGAN3 modeling approaches used to represent the drought impacts on isoprene emissions. Modeling results are given in Section 3 including single point model simulations with various drought algorithms that are evaluated against the available field measurements. In addition, global simulations with the MEGAN2.1 and MEGAN3 algorithms are carried out to understand the potential impacts of the new drought algorithm on global estimation of isoprene emissions. Finally, the drought impacts on ozone chemistry through changing biogenic isoprene emissions are analyzed by conducting coupled atmosphere–chemistry simulations without and with the MEGAN3 drought algorithm.
2. Methods
In this section, we present a new modeling approach — MEGAN3 drought algorithm — to simulate the impact of drought on biogenic isoprene emissions. The field measurements described below are used to derive a new approach for calculating the isoprene emission response to drought. We then examine the impact of drought stress on isoprene emissions at a single point and global scale by including the MEGAN3 drought algorithm in the CLM4.5/MEGAN2.1 framework.
2.1. Field measurements
There is growing interest in measurements of isoprene emission that can improve the understanding of atmospheric chemistry and climate (Wiedinmyer et al., 2001; Saxton et al. 2007; Liu et al., 2016; Martin et al., 2016). However, there have been no long-term canopy-scale BVOC flux field measurements that have intentionally focused on drought except for one study at a Northern Ozarks Tower that included isoprene emission measurements and was conducted in the US in the summers of 2011 and 2012. The Northern Ozarks Tower study was impacted by mild (2011) to severe (2012) droughts (Potosnak et al. 2014, Seco et al., 2015). Here, we use the biogenic isoprene flux and other measurements (i.e. water flux, CO2 flux, energy fluxes) from a site of Ameriflux (Baldocchi et al., 2001) to develop a new drought algorithm for isoprene emissions for CLM4.5/MEGAN3. The field site, Missouri Ozarks AmeriFlux site (MOFLUX), is located in the Baskett Wildlife Research and Education Area (BWREA), and is operated by the University of Missouri near the city of Ashland. BWREA is within the Ozark Border region of central Missouri. The site is covered by oak-hickory forest dominated by white, post and black oaks, shagbark hickory, sugar maple, and eastern red cedar. The climate of the area is classified as warm, humid, and continental (Critchfield, 1966). Silt loam and clay loam are the dominant soil textures at the site. The thin soils beneath the oak-hickory forests often exacerbate plant water stress when droughts occur (Bahari et al., 1985). More details about the site characteristics can be found in Gu et al. (2006, 2007, 2015).
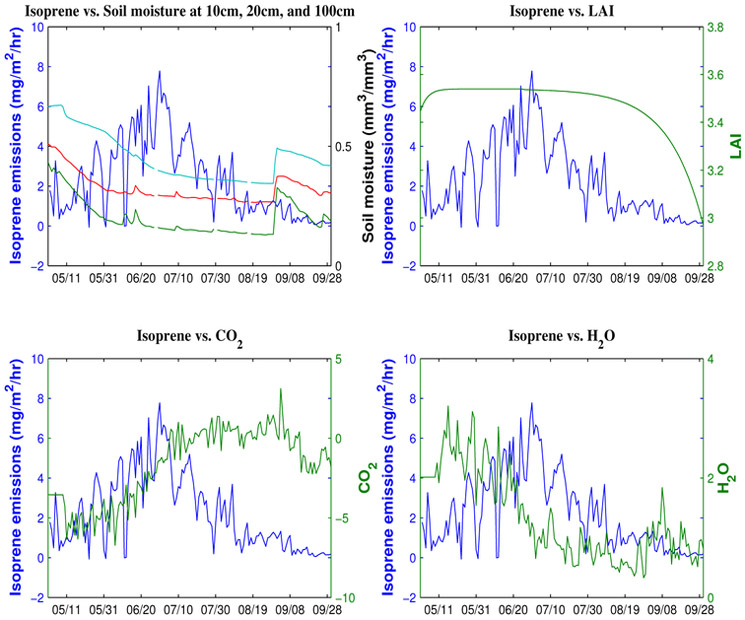
The site experienced a mild drought in mid to late summer of 2011 and an extreme to exceptional drought from mid to late summer of 2012. It was unusually wet in the spring of 2011, but drought started to appear in June due to lack of rainfall. The temperature also hit the record high in more than three decades. During the time when the isoprene flux measurements were taken, Leaf Area Index (LAI) was 3.7 m2 m−2 at the site. The drought condition in 2011 was not as severe as that in 2012. In 2012, the total annual precipitation was the lowest in the last decade. Soil water content started to decrease at the beginning of May, and dropped to its minimum (Figure 1a) at the end of August. Plant leaf water potential gradually dropped to - 3.79MPa (Seco et al., 2015) by the end of August. When the leaf water potential drops below - 1.5MPa, most mesic plants are under drought stress (Bonan 2002). LAI, which was measured at the site started to drop in August (Figure 1b) in response to the drought. The drought also led to decreases in ecosystem net CO2 and H2O fluxes (Figure 1c,d). After rain events occurred at the end of August, soil water content, net CO2 flux (or called Net Ecosystem Exchange) and H2O flux recovered slightly, but LAI continued to decrease, indicating that drought may have caused long-term damage to this canopy. Isoprene emissions increased in May and June, prior to the onset of severe drought, and peaked in late June as the drought conditions worsened (Figure 1). Leaf-level isoprene emission rates and leaf temperature responses during the pre-drought period were similar to the values reported in the literature and used in BVOC emission models (Geron et al., 2016). During the peak of the drought in August, isoprene emission rates decreased substantially (Figure 1). Isoprene emissions are highly temperature dependent (Singsaas and Sharkey, 2000) when there is no drought. In this case, if there was no drought, isoprene emissions were expected to be very high in summer time. However, the measured isoprene emissions at MOFLUX site in summer time, in particular in July and August, decreased, albeit the temperature increased. This indicates other factors are playing a critical role. Multi-regression analysis combined canopy-scale isoprene emissions collected in the summers of 2011 (mild drought) and 2012 (extreme drought) with CLM4.5 drought-related parameters to derive a new drought algorithm based on plant physiology. Due to the limited availability of drought-related isoprene emission measurements, our modeling results were compared against the same canopy-scale isoprene flux measurements at the MOFLUX site.
Figure 1:
Daily measurements of isoprene emissions (mg m−2hr−1) versus soil moisture (m3m−3), at 10cm (blue), 20cm (red), and 100cm (green) depths; leaf area index (LAI) (unitless), CO2 flux (umol m−2s−1), and water flux (umol m−2s−1) from May to September in 2012 at the MOFLUX site.
2.2. Isoprene emission algorithms
The biogenic emission model, MEGAN2.1 (Guenther et al., 2012), which has been embedded into CLM4.5 of CESM, is used to estimate isoprene emissions from plants. MEGAN2.1 uses simple mechanistic algorithms to account for the major known processes controlling biogenic emissions, including light, temperature, CO2, and empirical approaches to represent the emission response to soil moisture and leaf age (Guenther et al., 2006, 2012). The emission activity factor γ2.1 (for each compound class) accounts for emission response to light (γP), temperature (γT), leaf age (γA), soil moisture (γSM), leaf area index (LAI), and CO2 inhibition (γC):
| (1) |
where CCE represents a canopy environment parameter and γ0 represents the emission activity factor without the drought effect. For more details, readers are referred to Guenther et al. 2012.
In the current version of MEGAN2.1, only the effects of drought through the use of soil moisture and wilting point on isoprene emissions are considered. The effects of drought on isoprene emissions in MEGAN2.1 are parameterized using a simple empirical algorithm based on the observations of Pegoraro et al. (2004) which relates emission activity, γSM, isoprene, to soil moisture and wilting point (Guenther et al., 2012).
| (2) |
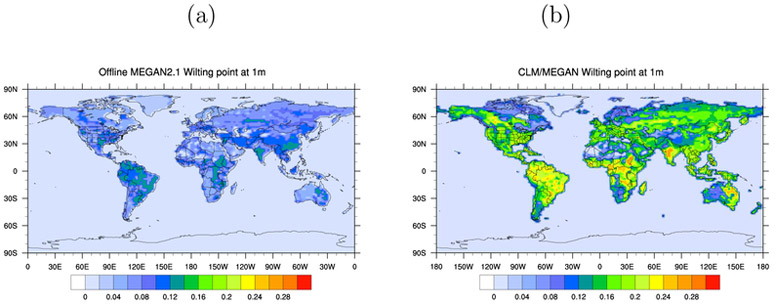
where θ is soil moisture (volumetric water content, m3 m−3), θw is wilting point (m3 m−3). Δθ1 (=0.06 m3 m−3) is an empirical parameter and θ1 is defined as θw + Δθ1. The wilting point is defined as the soil moisture at which a plant cannot further extract water from soil. It generally occurs at a suction of −1.50MPa and varies with soil texture. The default wilting point values provided with the offline version of MEGAN2.1 are from Chen and Dudhia (2001) global data set (Figure 2a). Potosnak et al. (2014) found that when using the Chen and Dudhia wilting point value of 0.08 for the MOFLUX site, the MEGAN2.1 soil moisture algorithm did not have any impact on modeled isoprene emissions for the years 2011 and 2012 at the MOFLUX site as soil moisture was always above the threshold needed to trigger the drought activity factor in MEGAN 2.1. Seco et al. (2015) used a wilting point value of 0.23 m3 m−3, which is a more representative value for the MOFLUX site soil types, and found that this wilting point value could account for much of the observed drought effect on isoprene emissions. Muller et al. (2008) found that when using the ECMWF (European Centre for Medium-Range Weather Forecasts) global weather model, it was necessary to use the ECMWF wilting point dataset. These results demonstrate that impact of drought on isoprene emissions is highly dependent on the wilting point values. In CLM4.5/MEGAN2.1, the wilting point is calculated mathematically using:
| (3) |
where i presents individual soil layers, ψi is soil matric potential at soil layer i, ψsat, i is matric potential at saturation for layer i, θi is volumetric soil moisture (m3 m−3) at soil layer i, θsat, i is water content at saturation, and b (unitless) is a soil texture-related parameter from Clapp and Hornberger (1978). At wilting point, ψwilt, i = −1.50 MPa. Substituting this for ψi in the above formula, one can obtain θw, i, which is dependent on soil texture.
Figure 2:
Wilting points (m3m−3) used in offline MEGAN2.1 (a) and CLM4.5/MEGAN2.1 (b).
| (4) |
Since CLM4.5 uses a nested subgrid hierarchy to represent spatial heterogeneity of the land surface, there are up to 15 Plant Functional Types (PFTs) plus bare ground for each model grid in CLM4.5. If one would like to plot wilting point maps for individual PFTs, there will be 15 maps. Thus, for display purpose only, the final wilting point shown in this paper is the lumped value for each grid cell, which is calculated as a weighted average for all PFTs over the root zone.
There are multiple factors contributing to the difference in the calculated wilting point values between CLM4.5 and Chen & Dudhia. In Chen and Dudhia, only land cover types are used, that means for each grid, there is only one type of land cover, while in CLM4.5, there are up to 15 PFTs. The detailed vegetation and soil information and modeled processes in CLM4.5 gives better vegetation-related soil parameters. The CLM4.5 calculated wilting point (Figure 2b) at the MOFLUX site is approximately 0.2 m3 m−3, which is close to the value of 0.23 m3 m−3 used in Seco et al. (2015). Comparing the wilting points from Chen and Dudhia, used as defaults in the offline MEGAN2.1, and CLM4.5/MEGAN2.1 models (Figure 2), we can see that the default values used in the offline MEGAN2.1 (Figure 2a) are too low, given what is known about soil textures, in many places around the world. The calculated wilting points from CLM4.5/MEGAN2.1 are more comparable to the wilting point data developed by the Global Soil Data Task (http://webmap.ornl.gov/wcsdown/wcsdown.jsp?dg_id=1004_35). We recommend these wilting points to be used in offline MEGAN2.1 simulations, instead of the Chen and Dudhia values previously used for MEGAN2.1 and have made a global dataset available on the MEGAN data portal (sites.google.com/uci.edu/bai/megan).
The existing drought algorithm for isoprene emission in MEGAN2.1 does not capture the 2011 or 2012 drought effect on isoprene emissions (Potosnak et al., 2014; Sindelarova et al., 2014; Seco et al., 2015; Huang et al., 2015) when using the default soil data (i.e. soil types and wilting points from Chen and Dudhia, 2001) due to the low wilting point values recommended by Chen and Dudhia (2001). The MEGAN2.1 framework is embedded in CLM4.5, which has detailed biogeophysical and hydrological cycles, and biogeochemical components, and can estimate carbon, water, and energy fluxes (Oleson et al. 2013). We use CLM4.5 to investigate potential approaches for developing a simple mechanistic drought activity factor for isoprene emission. It should be noted that the main purpose of this paper is not to simply replace the existing drought activity factor in MEGAN2.1; instead, it is to development a simple mechanistic representation of drought impacts on isoprene emissions by considering photosynthesis and water stress simultaneously. This is intended to be the initial step towards a more sophisticated mechanistic representation of BVOC emission response to drought and other types of stress that can reduce the carbon substrates available for producing isoprene and other BVOCs. CLM4.5 uses PFTs to represent vegetation types, and uses multiple soil layers to simulate hydrological processes. In CLM4.5, the physiological response of plants to drought stress is implemented through imposing stress on photosynthesis by reducing Vcmax with βt, where Vcmax is the maximum rate of carboxylation by the photosynthetic enzyme Rubisco and βt is the soil water stress function. Reduction in photosynthesis due to water stress can also limit the demand for CO2 and indirectly influence the conductance process. The effect of soil water on stomatal conductance in CLM4.5 is applied directly by multiplying the minimum conductance by βt and indirectly through net leaf photosynthesis (Vcmax and respiration, Rd). In this study, we use the CLM4.5 photosynthetic parameter, Vcmax, and the soil water stress function, βt, to derive the MEGAN3 algorithm for simulating isoprene emission response to drought.
Stomatal closure is recognized as the main driver of the initial photosynthetic response to water stress (Zhou et al., 2014). When drought occurs, the drought may decrease photosynthetic enzyme activity (Vcmax) and ribulose-1, 5-bisphosphate (RuBP) regeneration capacity (i.e. the maximum rate of photosynthetic electron transport, Jmax), and triosephosphate isomerase utilization (TPU) (Limousin et al., 2010; Martin-StPaul et al., 2012; Zhou et al., 2014). The three physiological processes can simultaneously regulate the decrease in photosynthesis in response to water stress. In this study, we use Vcmax in the initial attempt to represent the MEGAN3 response to water stress due to changes in photosynthetic capacity. In CLM4.5, the Ball-Berry conductance model as described by Collatz et al. (1991) is used to calculate stomatal conductance and photosynthesis. Photosynthesis processes in C3 and C4 plants are based on the models of Farquhar et al. (1980) and Collatz et al. (1992). More detailed implementation of these processes in CLM4.5 is described in Bonan et al. (2011) and Oleson et al. (2013). Vcmax in CLM4.5 varies with vegetation temperature and drought condition. The influence of drought stress on isoprene emission through the reduction in photosynthesis is imposed by multiplying Vcmax by βt. The function βt depends on soil water potential of each soil layer, root distribution of PFTs, and a wilting factor, which is based on Clapp and Hornberger (1978). The value of βt ranges from one when there is no plant stress to near zero when plants are fully stressed. Thus, βt is able to capture plant water regulation and limit photosynthesis.
| (5) |
where wi is the wilting factor, and ri is the fraction of roots in each soil layer. For more details, readers are referred to Oleson et al. (2013).
We define the new isoprene emission activity factor γ3 for MEGAN3 using γ0 and the new drought stress activity factor γd, isoprene, which is different from the existing drought activity factor, γSM, isoprene, in MEGAN2.1 and parameterized using the above two key parameters in CLM4.5:
| (6) |
where α is an empirical parameter derived from field measurements at the MOFLUX site. We are limited to the drought-related isoprene emission measurements. Currently, there are no other available drought-related whole canopy isoprene flux field measurements except for these data from the MOFLUX site. There are uncertainties associated with the parameter α, which needs further evaluation when more measurements become available. With this approach, isoprene emissions respond to water stress and photosynthesis simultaneously under non-drought and drought conditions. In the sections that follow, detailed description of the development of the MEGAN3 drought activity factor and evaluation of model results are given.
3. Results
3.1. Single-point simulations
CLM4.5 is equipped with detailed carbon and nitrogen biogeochemistry. The model version we used for this study is CLM-SP where SP stands for satellite phenology indicating that vegetation conditions including LAI, Stem Area Index (SAI), and vegetation heights are prescribed. We performed single-point simulations driven by site-specific hourly meteorology forcing measured at the MOFLUX site, including temperature, precipitation, wind, humidity, pressure, and downward shortwave solar radiation. In the single-point simulations, vegetation and soil parameters including PFTs, LAI, and soil texture, are also site specific. When CLM4.5 is driven by prescribed satellite-phenology, the model does not require a very long spin-up period (Oleson et al., 2013) to reach the steady state. The available meteorology forcing data for the years 2011 and 2012 were used repeatedly during the spin up simulation. A total of 50 years were run to get the initial conditions for CLM4.5. Then, multiple simulations with and without drought effects on isoprene emissions were carried out for 2011 and 2012 with the initial conditions obtained from the 50-year spin up run.
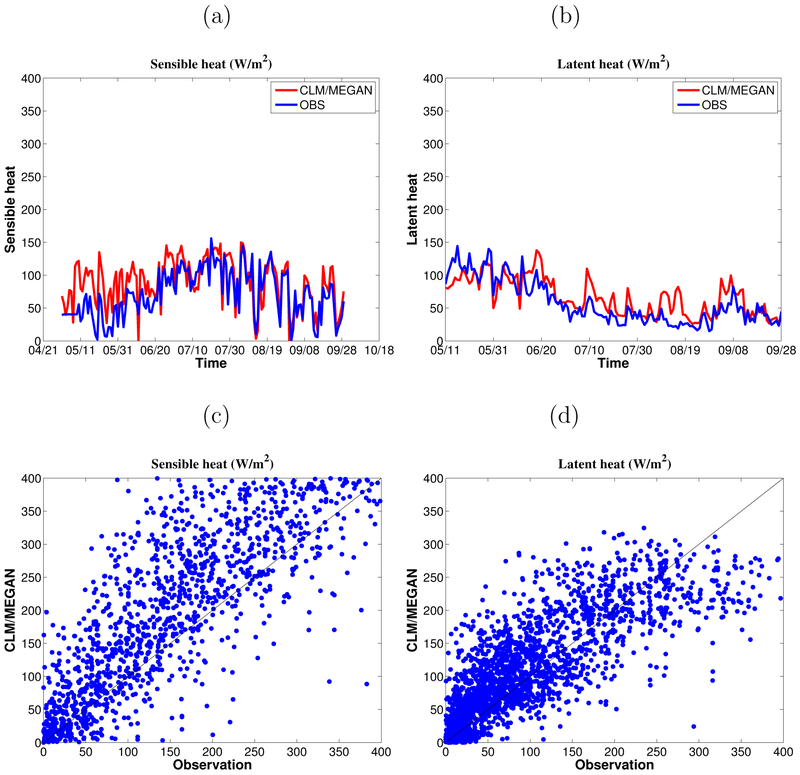
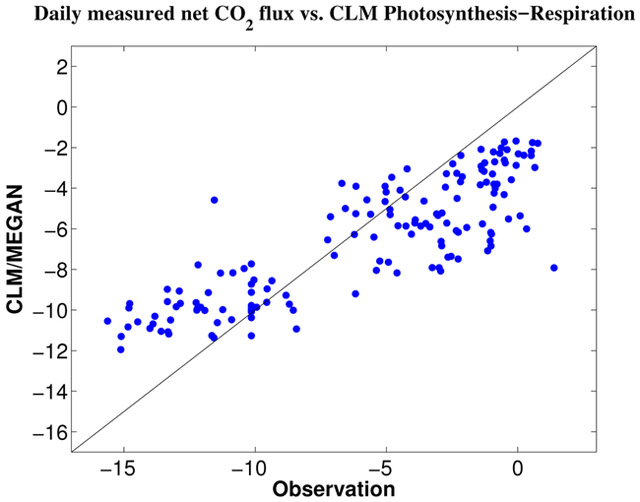
We evaluated the CLM4.5 performance using the field measurements from the MOFLUX site. Figure 3a, b shows the comparisons between modeled and measured sensible heat (SH) and latent heat (LH) fluxes on the monthly time scale. The model-simulated SH flux matches well with the observation during the drought period (Figure 3a). It is slightly overestimated before the onset of drought. For the latent heat flux, the model tends to produce more variations than the observations, but the overall trend is consistent with the observations. The scatter plots of the two energy fluxes (Figure 3c, d) show a relatively good agreement (see the Figure 3 caption) between the simulations and observations. In addition to the analysis of model-simulated energy fluxes, CLM4.5 simulated net CO2 flux (or Net Ecosystem Exchange), which is calculated as the difference between photosynthesis and respiration, is compared against the net CO2 flux measurement in Figure 4. In general, CLM4.5 underestimates Net Ecosystem Exchange (Montané et al. 2017), the correction coefficient between AmeriFlux measurement and modeled results is 0.85. While the performance of CLM4.5 is not optimal, it is acceptable for the purpose of this study, and improving the Net Ecosystem Exchange performance of CLM4.5 is beyond the scope of this work.
Figure 3:
Top panels show modeled and measured daily sensible heat (SH) (a) and latent heat (LH) (b) from May to September in 2012. Bottom panels show scatter plots of modeled and measured SH (c) and LH (d) from May to September in 2012. For the scatter plots, the calculated correlation coefficients, slopes, and intercepts with a linear fit are 0.86, 0.83, and 17.99 for SH and 0.92, 1.12, and 8.31 for LH respectively.
Figure 4:
Scatter plot of measured (OBS) daily net CO2 flux (umol m−2s−1) and CLM4.5 simulated daily net CO2 flux, which was calculated using photosynthesis and respiration in May-September 2012. The correlation coefficient, slope, and intercept between them is 0.85, 0.51, and −3.58.
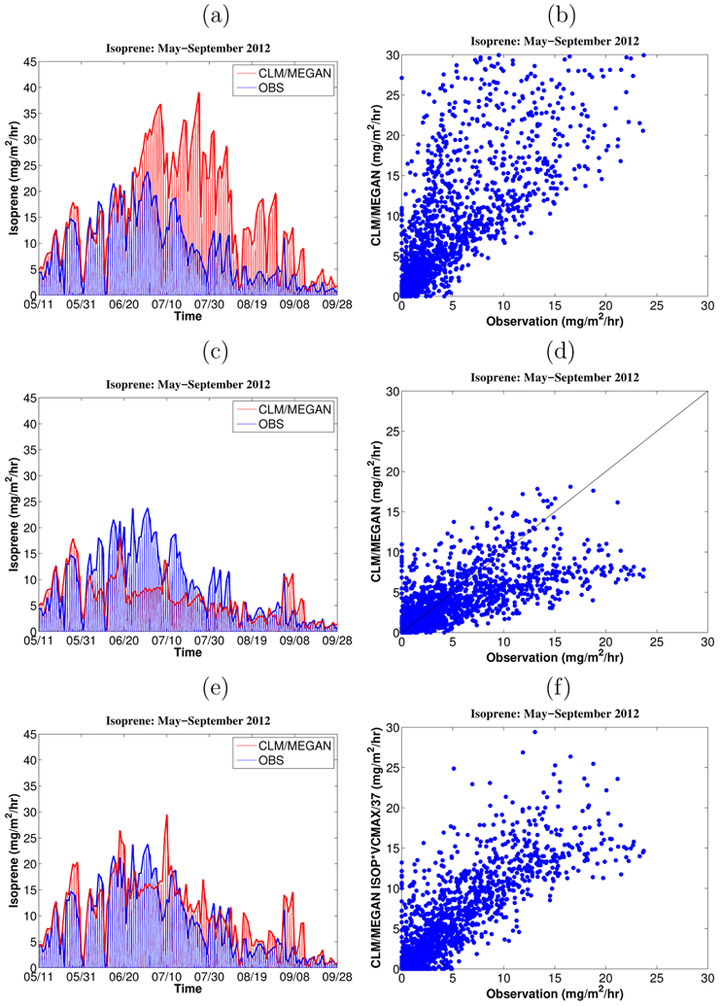
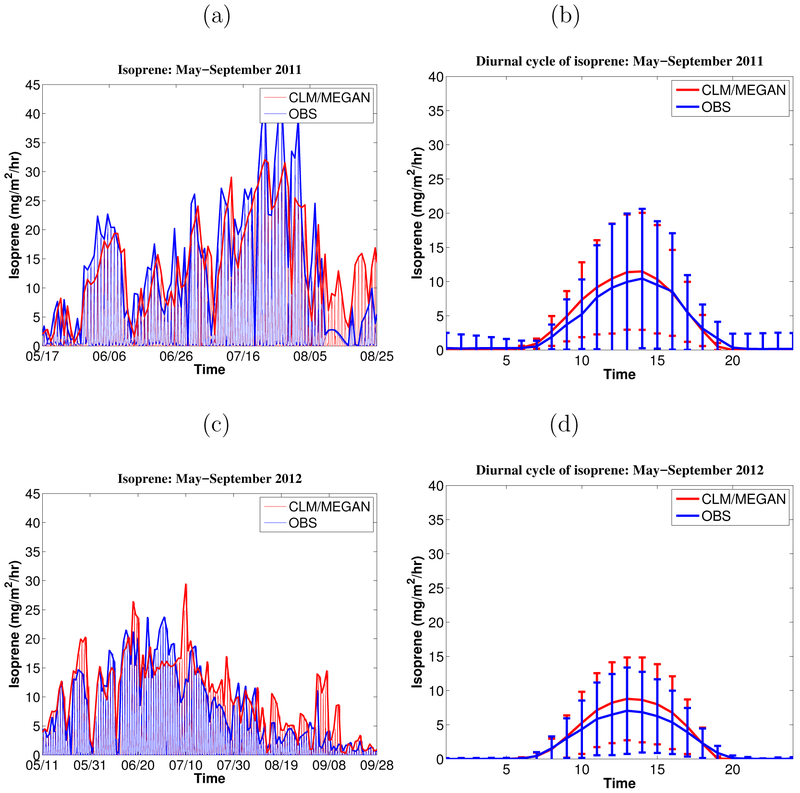
To assess how different drought algorithms in CLM4.5/MEGAN simulate the response of isoprene emission to drought conditions, we performed several sensitivity experiments at the MOFLUX site. Since the wilting point value, 0.08 m3m−3, from Chen & Dudhia is always below the soil moisture (Figure 1) measured at this site, it is expected that the use of 0.08 m3m−3 will have no impacts on modeled isoprene emissions. Hence, only three sensitivity experiments were performed to understand the impacts of the new drought activity factor in MEGAN: EXP1 (No drought effect is included in MEGAN2.1), EXP2 (CLM4.5-calculated wilting point value is used with the MEGAN2.1 drought emission activity algorithm), and EXP3 (MEGAN3 drought emission activity algorithm is used). When the CLM4.5-calculated wilting point is used in MEGAN2.1 (EXP2), the model produces a significant reduction in isoprene emissions during the start and peak of the drought period in 2012 (Figure 5c, d). The model underestimates isoprene emissions during these two periods compared to the observations, suggesting some missing factors such as photosynthesis, water stress, and heat stress that might contribute to isoprene emission change. This study attempts to include the effects of photosynthesis and water stress on isoprene emission changes when extreme drought events occur since the current MEGAN2.1 already does a reasonable job of re-producing isoprene emissions under non-drought conditions (Seco et al. 2015). In EXP3, the model captures the behavior of isoprene emission well before and during the drought periods (Figure 5e). The simulations were evaluated in terms of correlation coefficients using the cross-plots of the modeling results and the observations. The correlation coefficient from EXP3 is the best (0.89) compared to the other experiments (Figure 5f). Other statistics (i.e. slope) of EXP3 also suggest it has a better performance in simulating isoprene emissions during the drought period. To evaluate if the new drought activity algorithm works in less severe drought years, the model was also run for 2011. The simulated hourly and daily isoprene emissions in 2011 from EXP3 match well with the observations (Figure 6a, b), suggesting that the new algorithm also works under less severe drought condition. Again, EXP3 reproduces the diurnal cycle of isoprene emission in 2012 (Figure 6d).
Figure 5:
Hourly (a, c, and e) and scatter plots (b, d, and f) of measured and modeled isoprene emissions from May to September in 2012. EXP1 results are shown in (a) and (b), EXP2 results are shown in (c) and (d), and EXP3 results are shown in (e) and (f). EXP1, EXP2, and EXP3 are the CLM4.5/MEGAN2.1 simulations defined in Section 3.1. The calculated correlation coefficients, slopes, and intercepts on the scatter plots with a linear fit are 0.81, 1.48, and 0.96 (EXP1); 0.79, 0.55, and 0.51 (EXP2); 0.88, 1.005, and 0.42 (EXP3) respectively.
Figure 6:
Top panels show hourly (a) and diurnal (b) isoprene emissions from May to September in 2011 simulated using the new drought activity factor in MEGAN3 (EXP3). Bottom panels show hourly (c) and diurnal (d) isoprene emissions in 2012 simulated using the new drought activity factor in MEGAN3 (EXP3).
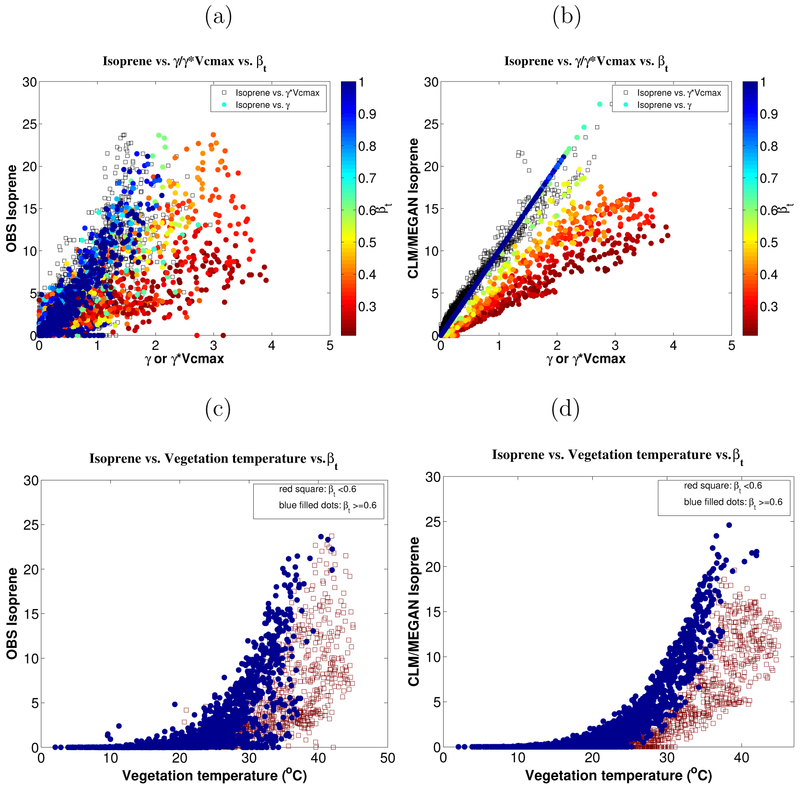
Biogenic isoprene emissions have multiple environmental drivers. MEGAN represents these multiple environmental drivers using an emission activity factor γ that accounts for multiple emission activity factors. The relationships among biogenic isoprene emissions, Vcmax, and βt for May-September, 2012 are illustrated in Figure 7. The time period includes both non-drought and drought periods. There is a strong correlation (correlation coefficient > 0.7) between measured isoprene emissions and γ0 when βt is larger than 0.6 (Figure 7a). When βt becomes smaller than 0.6, the correlation tends to become weaker. The threshold value of 0.6 for βt used in equation (6) was selected based on a model sensitivity analysis. A range of threshold values was tested in the model sensitivity analysis, and the value of 0.6 gave the best fit between the measured and modeled isoprene emissions at the site. Therefore, it is used as the threshold for the new drought algorithm for isoprene. When more drought-related isoprene measurements at other locations become available, this value needs to be evaluated. Similar relationships were also plotted for the modeled isoprene emissions (Figure 7b). Again, when drought effect is not considered in MEGAN2.1, the relationship between modeled isoprene and γ0 becomes weaker when βt decreases. The correlations between modeled isoprene emissions and γ0 or γ0 × Vcmax are stronger than the correlations between the measured isoprene emissions and γ0 or γ0 × Vcmax (Figure 7a) because of variations in measured biogenic isoprene emission that are not accounted for by this simple model or because of the imperfect representation of physical mechanisms in CLM4.5 and uncertainties in the observations including variability due to changes in the measurement footprint due to shifts in wind speed and direction. The MEGAN3 drought response activity factor follows the behavior of the observed isoprene response to drought expected for the reduced availability of carbon substrates from photosynthesis. This suggests that the use of Vcmax and βt in calculating the isoprene emission drought activity factor could help improve the accuracy of the total emission activity factor in MEGAN during non-drought and drought periods.
Figure 7:
Top panels show scatter plots of measured (a) and modelled (b) biogenic isoprene (mg m−2hr−1) versus MEGAN isoprene emission activity factor γ or γ × Vcmax and βt. Bottom panels show scatter plots of measured (c) and modelled (d) isoprene emissions versus vegetation temperature and βt. The modelled biogenic isoprene emissions are from MEGAN2.1 when no drought effect is considered or from MEGAN3.0 when the new drought activity factor is used.
Biogenic isoprene emissions are known to be highly temperature sensitive. Isoprene emission increases and then declines with increasing temperature. The temperature maximum for isoprene emission is typically between 35 °C and 44 °C (Singsaas and Sharkey, 2000) but can be as high as 50 °C for desert plants growing under hot conditions (Geron et al., 2006). Figure 7c, d shows that isoprene emissions increase exponentially with vegetation canopy temperature when there is no severe drought (βt>0.6). As the drought intensifies (βt<=0.6), isoprene emissions start to decline when the vegetation canopy temperature is above 37 °C. The strong exponential relationship between isoprene emission and vegetation temperature also tends to diminish. Overall, the modeled (Figure 7d) relationship among isoprene, vegetation canopy temperature, and βt (Figure 7d) is similar to the relationship when measured isoprene emissions are used (Figure 7c), also suggesting satisfactory model agreement with fluxes when the new drought activity algorithm is used for estimating isoprene emissions.
3.2. Global simulations
To further understand the potential global scale impacts of drought on isoprene emissions, two two-degree offline global CLM4.5/MEGAN runs (EXP-NO, EXP-NEW) were carried out for the years 2007-2013. This period covers a few severe drought events that occurred in different parts of the world. Both runs use CLM4.5 with the MEGAN2.1 framework. The EXP-NO run does not include any drought effect, and the EXP-NEW run considers the drought effect on isoprene using the MEGAN3 drought algorithm. The meteorology forcing data for the global runs are CRU-NCEP reanalysis (Piao et al., 2012). The CLM4.5 was run in CLM-SP mode. A similar spin-up approach applied for the single point simulations was utilized to prepare initial conditions for CLM4.5 in the global simulations.
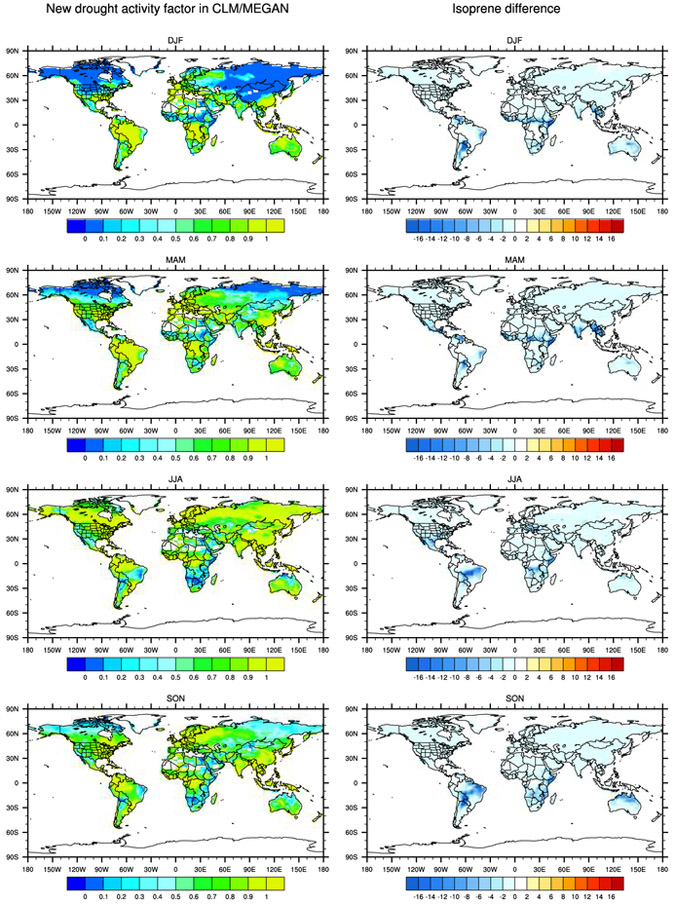
Figure 8 shows multi-year (2007-2013) seasonal-averaged drought activity factor γd simulated in EXP-NEW and resulting changes in isoprene emissions. The drought activity factor affects isoprene emissions in the model when βt falls below 0.6. It can be seen that the drought impacts on isoprene emissions occur in several regions where a large amount of isoprene emission is expected (Guenther et al., 2012). These areas include the Amazon, the southeast US, Australia, and South Asia. The corresponding changes in isoprene emissions simulated between EXP-NO and EXP-NEW show that the predicted drought effect reduction in isoprene emissions in these places can exceed 15% (Figure 8b). Globally, drought results in an average of ~17% reduction in isoprene emissions.
Figure 8:
Model calculated drought activity factor γd (left column, unitless) and changes in isoprene emissions (right column, mg m−2hr−1) in 2007-2013.
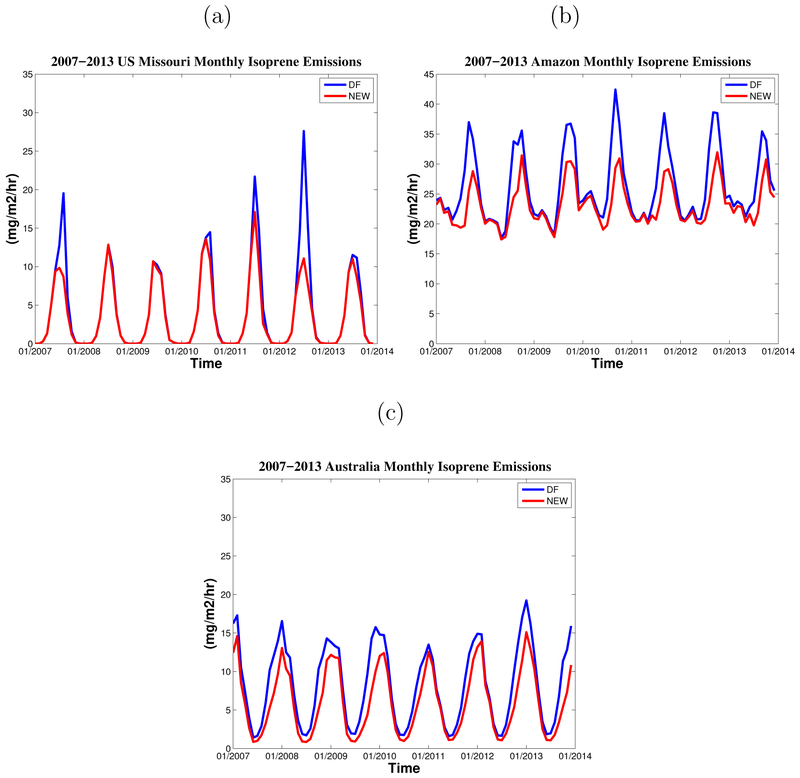
To explore how drought impacts isoprene emissions over time, the time-series plots of isoprene emission with and without drought effect are shown for three regions in the world (Figure 9). A 42% reduction in isoprene emission is estimated in 2012 for the Missouri area in the US, which was observed in the field measurements. In other years when no droughts were observed, the modeled isoprene emissions in EXP-NEW are the same as those in EXP-NO. The figure shows that the drought algorithm reduces year to year variations in isoprene emission in comparison to the no drought effect predictions of much higher isoprene emissions in hot, sunny and dry years (EXP-NO). This indicates that the MEGAN2.1 algorithm without drought effect misses the drought-induced emission reductions in some regions, leading to overestimates in isoprene emission. In the central Amazon area, the drought algorithm results in an 11% reduction in isoprene emissions for all years. The Amazon Basin, which contains the world's largest rain forest, is thought to be the largest global isoprene source. The recent drying trend in this area (Lewis et al., 2010) does impact model simulated isoprene emissions with the new drought algorithm. Another area that has been impacted by droughts is Australia. When the drought effect is considered in the model, a small reduction in isoprene emissions is simulated throughout the simulation years.
Figure 9:
Time series of monthly isoprene emission (mg m−2hr−1) simulated without the drought effect and with the new drought activity factor in MEGAN in Missouri, US (a), Central Amazon (b), and Australia (c) from 2007 to 2013.
3.3. Implications for ozone chemistry
Isoprene is highly reactive with ozone, hydroxyl radicals (OH), and nitrate radicals (NOx ). In forested regions, isoprene photooxidation is a major driver of atmospheric chemistry. Thus changes in isoprene emissions could have profound impacts on tropospheric OH and ozone. Although the influence of isoprene emission on OH and ozone is still in question (Liu et al., 2016), the sensitivity simulations presented in this study are used to assess the potential impacts of drought on ozone and OH due to changes in isoprene emissions. Isoprene oxidation occurs mostly in the atmospheric mixed layer, although entrainment and reaction in the free troposphere can also be important. Here, only the impacts on the near surface ozone and OH are examined. We performed two six-month (June to December, 2010) global simulations using CAM-Chem-CLM4.5-MEGAN2.1 at two-degree spatial resolution (1.9° × 2.5°). The version 4 of CAM-Chem is used in this study (Lamarque et al., 2012). The anthropogenic emissions for 2010 are from the POET (Precursors of Ozone and their Effects in the Troposphere) database for 2000 (Granier et al., 2005) and fire emissions are from FINN (Fire INventory from NCAR) (Wiedinmyer et al., 2010). The two experiments differ only in the use of a drought activity factor. Experiment Chem-NO does not include the drought effect on isoprene emissions, while experiment Chem-NEW uses the new MEGAN3 drought algorithm. The meteorology forcing for CAM-Chem is generated with the Goddard Earth Observing System (GEOS) atmospheric model and data assimilation system (Rienecker et al., 2011). Other forcing data include sea surface temperatures, aerosol, and greenhouse gas emissions for the year 2010. Initial conditions for CLM4.5 are from the offline CLM4.5 spin-up run described above. In the simulations, no feedback between biogenic emissions and atmosphere is included so that the impacts of changes in isoprene emissions on ozone and OH chemistry can be assessed.
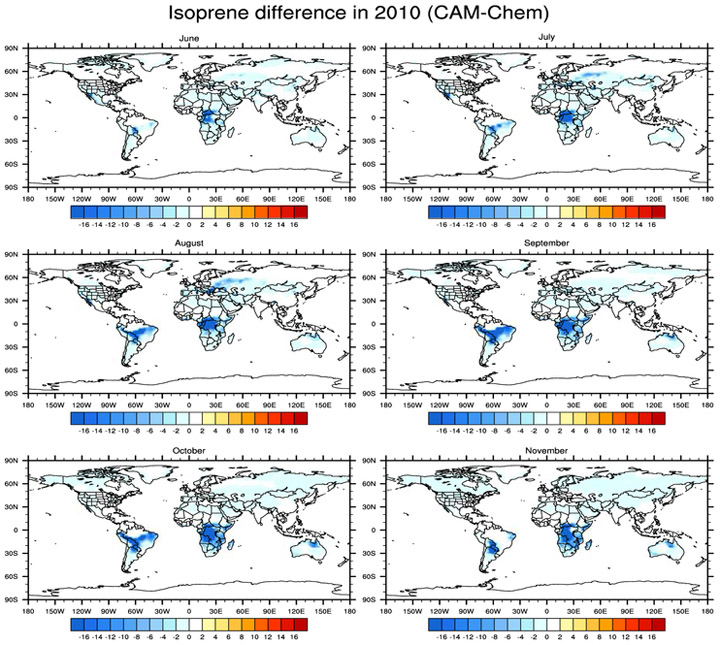
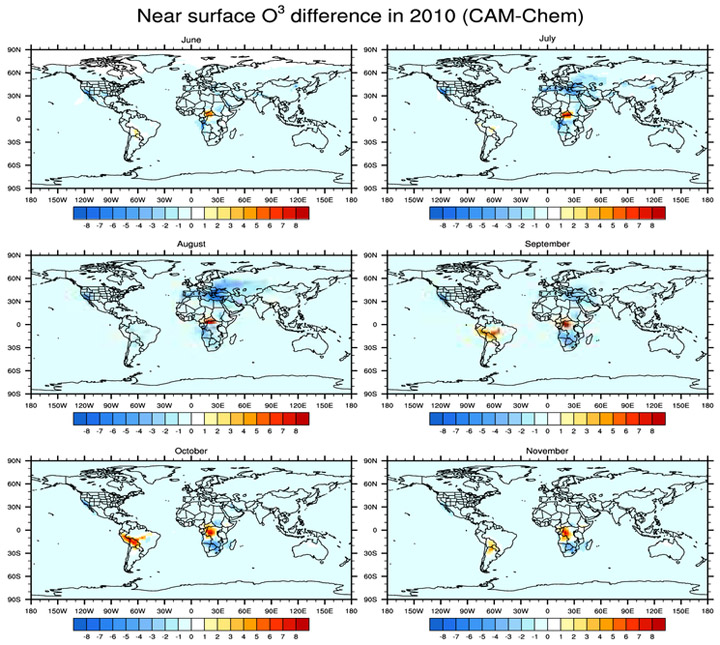
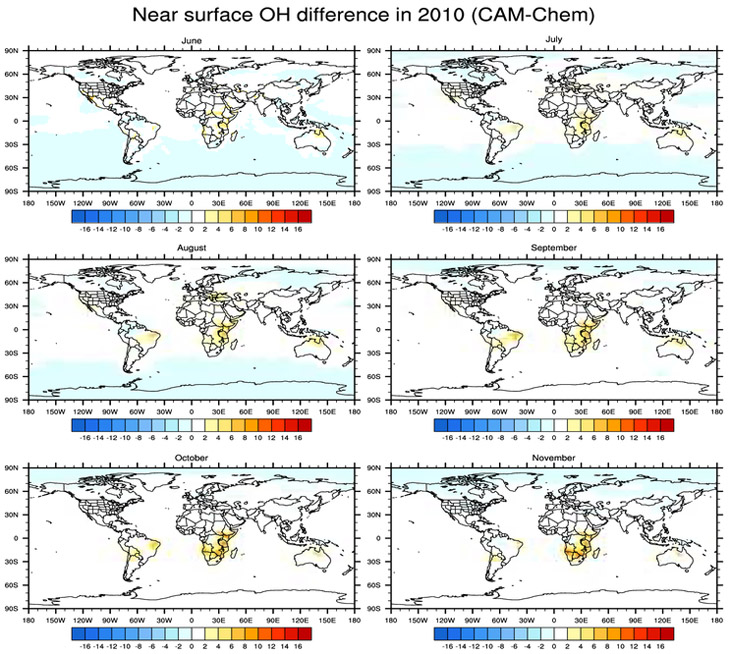
The overall pattern of modeled global changes in biogenic isoprene emissions for the year 2010 (Figure 10) is similar to the pattern of multi-year averages (Figure 8). The changes in ozone concentrations due to changes in biogenic isoprene emissions are shown in Figure 11. In the relatively pristine rainforest environment (NOx limited), where ozone concentrations are low, the reduction in isoprene emissions is associated with an increase in ozone in these regions (i.e. rainforests in the Amazon and Congo basins). In Europe and North America (VOC-limited), the reduction in isoprene emissions leads to an approximately 3ppbv reduction in near surface ozone concentrations. The results show that a reduction in isoprene emission can have a positive or negative effect on ozone concentrations. In areas where an increase in ozone concentrations is predicted, a negative sensitivity of ozone to isoprene emission is observed owing to NOx-limited and VOC-rich conditions (i.e., Squire et al., 2015) where isoprene is primarily a sink for ozone. The resulting changes in OH (Figure 12) due to the reduction in isoprene emissions are very similar in the majority of the areas, with slight increases in the near surface concentrations associated with lower isoprene emissions resulting in reduced reaction of isoprene with OH allowing an increase in OH. It should be noted that the impacts of isoprene on the formation of SOA are not included in the current simulations. The sensitivity experiments demonstrate the importance of considering the drought stress impact on biogenic isoprene emissions for global atmospheric chemistry simulations.
Figure 10:
Coupled CESM model simulated changes in biogenic isoprene emissions (mg m−2hr−1) from June to November in 2010 with the new drought activity factor in MEGAN.
Figure 11:
CAM-Chem simulated changes in surface O3 (ppbv) due to changes in biogenic isoprene emissions caused by the drought effect from June to November in 2010.
Figure 12:
CAM-Chem simulated changes in surface OH (0.01*pptv) due to changes in biogenic isoprene emissions caused by the drought effect from June to November in 2010.
4. Discussion and conclusions
Previous studies have shown that short-term mild drought stress affects stomatal conductance and thus the rate of photosynthesis but does not diminish isoprene emission (Fall and Monson, 1992; Niinemets, 2010), instead mild drought increases isoprene emissions due to an increase in leaf temperature and possibly other factors (Pegoraro et al., 2004; Sharkey and Loreto, 1993). Severe drought or prolonged moderate drought does result in significant reductions in isoprene emissions presumably due to decreased leaf carbon availability following sustained reductions in photosynthetic rate (Bruggemann and Schnitzler 2002; Funk et al., 2005; Sharkey and Loreto, 1993). Clearly, there is a strong connection between photosynthesis and isoprene emissions (Niinemets et al., 1999; Grote and Niinemets 2008; Monson et al., 2012; Grote et al., 2014). The new MEGAN3 drought algorithm presented in this study allows the response of isoprene to changes in photosynthesis and water stress. The use of Vcmax allows isoprene emission to respond to changes in photosynthesis under drought conditions. The water stress factor, βt, further controls the onset of isoprene emission drop. In this study, the threshold of 0.6 for βt is used. The use of the water stress factor allows isoprene emission to continue the dependence on other emission activity factors when it is still above the threshold value. Therefore, there is a lag between isoprene emission and photosynthetic rate. When βt is below the threshold value, isoprene emission is tightly coupled with photosynthesis. Zheng et al. (2015) found that MEGAN with the soil moisture algorithm produces a tight linkage between isoprene emission variability and photosynthesis.
The new method proposed in this study to represent the drought effect on biogenic isoprene emissions improves the simulation of isoprene emissions under the severe drought stress, and reproduces the emissions when the drought is mild at MOFLUX. The change in predicted isoprene emissions has important implications for reducing the uncertainties in model simulations and advancing the understanding of the interactions between ecosystem functioning and climate change. Despite the lack of field measurements to constrain the isoprene emission, we argue that the isoprene emission variation due to drought can be simulated as a response to water availability and photosynthesis. Although our understanding of the controlling mechanisms is incomplete, the emission algorithm proposed here could improve model predictions. However, there are canopy-scale field data available from only one temperate forest site for assessing isoprene emission – drought effects. Long-term monitoring of isoprene emissions in water-limited ecosystems is needed to improve our understanding of the factors controlling biogenic isoprene fluxes. Future canopy-scale studies of the response of isoprene to multiple stresses and additional drought stress cases are needed to further improve model simulations of isoprene emission. The MEGAN3 drought algorithm developed in this study has only been tested for biogenic isoprene emission, but may be useful for modeling emissions of other BVOCs that are dependent on recently fixed carbon. However, additional measurements are needed to assess this algorithm for other biogenic emissions. It should be noted that this study is intended to be the initial step towards a more mechanistic representation of drought impacts on BVOCs in MEGAN. We expect that this will ultimately lead to a better representation of a wide range of stress response even if there is not a major improvement over the old algorithm. The global sensitivity simulations presented in this study provide us with some indication of the potential drought impacts on atmospheric chemistry and demonstrate the need to pursue this further.
ACKNOWLEDGMENTS
X. Jiang and A. Guenther were supported by National Science Foundation (NSF) Atmospheric Chemistry program award AGS-1643042 and National Aeronautics and Space Administration (NASA) Atmospheric Composition Campaign Data Analysis and Modeling (ACCDAM) program award NNX15AT62G. Isoprene flux measurements performed by Mark Potosnak during 2011 were supported by the National Science Foundation through a Collaborative Research award entitled Biogenic Volatile Organic Compound Emissions from the Tundra and Arctic Atmospheric Chemistry (1025948). We would like to acknowledge the use of computational resources (doi:10.5065/D6RX99HX) at the NCAR-Wyoming Supercomputing Center provided by the National Science Foundation and the State of Wyoming, and supported by NCAR's Computational and Information Systems Laboratory. The CESM model is supported by the National Science Foundation and the Office of Science (BER) of the U.S. Department of Energy. The views expressed in this article are those of the author(s) and do not necessarily represent the views or policies of the U.S. Environmental Protection Agency.
REFERENCES
- 1.Arneth A, Niinemets Ü, Pressley S, Bäck J, Hari P, Karl T, Noe S, Prentice IC, Serça D, Hickler T, Wolf A, and Smith B, Process-based estimates of terrestrial ecosystem isoprene emissions: Incorporating the effects of a direct CO2-isoprene interaction, Atmos. Chem. Phys, 2007, 7, 31–53. [Google Scholar]
- 2.Arneth A, Monson RK, Schurgers G, Niinemets Ü, and Palmer PI: Why are estimates of global terrestrial isoprene emissions so similar (and why is this not so for monoterpenes)?, Atmos. Chem. Phys, 2008, 8, 4605–4620. [Google Scholar]
- 3.Bahari Z, Pallardy S, Parker WC, Photosynthesis, water relations and drought adaptation in six woody species of oak-hickory forests in central Missouri. Forest Science, 1985, 31, 557–569. [Google Scholar]
- 4.Baldocchi et al. , 2001, FLUXNET: a new tool to study the temporal and spatial variability of ecosystem-scale carbon dioxide, water vapor, and energy flux densities, Bull. Am. Meteorol. Soc, 2001, 82, 2415–2434. [Google Scholar]
- 5.Beckett M, Loreto F, Velikova V, Brunetti C, Di Ferdinando M, Tattini M,… Farrant JM, Photosynthetic limitations and volatile and non-volatile isoprenoids in the poikilochlorophyllous resurrection plant Xerophyta humilis during dehydration and rehydration. Plant, Cell & Envi-ronment 2012, 35, 2061–2074. [DOI] [PubMed] [Google Scholar]
- 6.Bonan GB,. Ecological climatology: concepts and applications. 2002, New York, NY: Cambridge University Press. [Google Scholar]
- 7.Bonan GB, Lawrence PJ, Oleson KW, Levis S, Jung M, Reichstein M, Lawrence DM, and Swenson SC,. Improving canopy processes in the Community Land Model (CLM4) using global flux fields empirically inferred from FLUXNET data. J. Geophys. Res 2011, 116, G02014 DOI:10.1029/2010JG001593 [Google Scholar]
- 8.Brilli F, Barta C, Fortunatti A, Lerdau M, Loreto F, Centritto M, Response of isoprene emission and carbon metabolism to drought in white poplar (Populus alba) saplings. New Phytologist, 2007, 175, 244–254. [DOI] [PubMed] [Google Scholar]
- 9.Chen F, Dudhia J, Coupling an advanced land surface–hydrology model with the penn State–NCAR MM5 modeling system. Part I: model implementation and sensitivity. Mon. Wea. Rev, 2001, 129, 569–585. [Google Scholar]
- 10.Claeys M, et al. , Formation of secondary organic aerosols through photooxidation of isoprene, Science, 2004, 303, 1173–1176. [DOI] [PubMed] [Google Scholar]
- 11.Clapp RB and Hornberger GM,, Empirical equations for some soil hydraulic properties, Water Resour. Res 1978, 14, 601–604. [Google Scholar]
- 12.Collatz GJ, Ball JT, Grivet C & Berry JA, Physiological and environmental regulation of stomatal conductance, photosynthesis and transpiration: a model that includes a laminar boundary layer. Agricultural and Forest Meteorology, 1991, 54, 107–136. [Google Scholar]
- 13.Collatz GJ, Ribas-Carbo M & Berry JA, Coupled photosynthesisstomatal conductance model for leaves of C4 plants. Australian J. of Plant Physiology 1992, 19, 519–538. [Google Scholar]
- 14.Critchfield H, General Climatology. 1966, Prentice-Hall, Englewood Cliffs, NJ [Google Scholar]
- 15.De Swaef T, Steppe K, Linking stem diameter variations to sap flow, turgor and water potential in tomato. Functional Plant Biology 2010, 37, 429–438. [Google Scholar]
- 16.Derwent RG, Jenkin ME, Passant NR, and Pilling MJ, Photochemical ozone creation potentials (POCPs) for different emission sources of organic compounds under European conditions estimated with a Master Chemical Mechanism, Atmos. Environ, 2007, 41, 2570–2579. [Google Scholar]
- 17.Fall R, Monson RK, Isoprene emission rate and intercellular isoprene concentration as influenced by stomatal distribution and conductance. Plant Physiol, 1992,100, 987–992. [DOI] [PMC free article] [PubMed] [Google Scholar]
- 18.Farquhar GD, von Caemmerer S, and Berry JA, A biochemical model of photosynthetic CO2 assimilation in leaves of C3 species. Planta, 1980, 149, 78–90. [DOI] [PubMed] [Google Scholar]
- 19.Folberth GA, Hauglustaine DA, Lathiere J, and Brocheton F, Interactive chemistry in the Laboratoire de Met´ eorologie Dy- namique general circulation model: model description and impact analysis of biogenic hydrocarbons on tropospheric chemistry, Atmos. Chem. Phys, 2006, 6, 2273–2319. [Google Scholar]
- 20.Granier C, Guenther A, Lamarque J, Mieville A, Muller J, Olivier J, Orlando J, Peters J, Petron G, Tyndall G, and Wallens S: POET, a database of surface emissions ofozone precursors, available at: http://www.aero.jussieu.fr/projet/ACCENT/POET.php, 2005. [Google Scholar]
- 21.Gent PR, Danabasoglu G, Donner LJ, Holland MM, Hunke EC, Jayne SR, Lawrence DM, Neale RB, Rasch PJ, Vertenstein M, Worley PH, Yang Z-L, and Zhang M: The Community Climate System Model version 4, J. Climate, 2011, 24, 4973–4991. [Google Scholar]
- 22.Geron C, Daly R, Harley P, Rasmussen R, Seco R, Guenther A, Karl T, Gu L, Large drought-induced variations in oak leaf volatile organic compound emissions during PINOT NOIR 2012. Chemosphere, 2016, 146, 8–21. [DOI] [PubMed] [Google Scholar]
- 23.Geron C, Guenther A, Greenberg J, Karl T, and Rasmussen R: Biogenic volatile organic compound emissions from desert vegetation of the southwestern US, Atmos. Environ, 2006, 40, 1645–1660. [Google Scholar]
- 24.Goldstein AH and Galbally IE, Known and unexplored organic constituents in the earth’s atmosphere, Environ. Sci. Technol, 2007, 41, 1514–1521. [DOI] [PubMed] [Google Scholar]
- 25.Grell GA, Peckham SE, Schmitz R, McKeen SA, Frost G, Skamarock WC, and Eder B: Fully coupled “online” chemistry within the WRF model, Atmos. Environ, 2005, 39, 6957–6975. [Google Scholar]
- 26.Grote R, Morfopoulos C, Niinemets €U, Sun Z, Keenan TF, Pacifico F, Butler T, A fully integrated isoprenoid emissions model coupling emissions to photosynthetic characteristics. Plant, Cell & Environment, 2014, 37, 1965–1980. [DOI] [PMC free article] [PubMed] [Google Scholar]
- 27.Grote R, Niinemets Ü, Modeling volatile isoprenoid emissions – a story with split ends. Plant Biol, 2008, 10, 8–28. [DOI] [PubMed] [Google Scholar]
- 28.Grote R, Lavoir AV, Rambal S, Staudt M, Zimmer I, and Schnitzler J-P, Modelling the drought impact on monoterpene fluxes from an evergreen Mediterranean forest canopy. Oecologia, 2009, 160, 213–223. [DOI] [PubMed] [Google Scholar]
- 29.Gu L, Meyers T, Pallardy SG et al. , Direct and indirect effects of atmospheric conditions and soil moisture on surface energy partitioning revealed by a prolonged drought at a temperate forest site. Journal of Geophysical Research, 2006, 111, D16102. [Google Scholar]
- 30.Gu L, Meyers T, Pallardy SG et al. , Influences of biomass heat and biochemical energy storages on the land surface fluxes and radiative temperature. Journal of Geophysical Research, 2007, 112, D02107. [Google Scholar]
- 31.Gu L, Pallardy SG, Hosman KP, Sun Y, Drought-influenced mortality of tree species with different predawn leaf water dynamics in a decade-long study of a central US forest. Biogeosciences, 2015, 12, 2831–2845. [Google Scholar]
- 32.Guenther A, Biological and chemical diversity of biogenic volatile organic emissions into the atmosphere. ISRN Atmospheric Sciences, 2013, 786290. [Google Scholar]
- 33.Guenther AB, Jiang X, Heald CL, Sakulyanontvittaya T, Duhl T, Emmons LK, Wang X, The model of emissions of gases and aerosols from nature version 2.1 (MEGAN2.1): an extended and updated framework for modeling biogenic emissions. Geoscientific Model Development, 2012, 5, 1471–1492. [Google Scholar]
- 34.Guenther A, Monson R, and Fall R, Isoprene and monoterpene emission rate variability: Observations with eucalyptus and emission rate algorithm development, J. Geophys. Res, 1991, 96, 10,799–10,808. [Google Scholar]
- 35.Guenther A; Karl T; Harley P; Wiedinmyer C; Palmer PI; Geron C, Estimates of global terrestrial isoprene emissions using MEGAN (Model of Emissions of Gases and Aerosols from Nature). Atmospheric Chemistry and Physics, 2006, 6, 3181–3210. [Google Scholar]
- 36.Guenther AB, Zimmerman PR, Harley PC, Monson RK, and Fall R, Isoprene and Monoterpene Emission Rate Variability – Model Evaluations and Sensitivity Analyses, J. Geophys. Res.-Atmos, 98(D7), 12 609–12 617, 1993. [Google Scholar]
- 37.Heald CL, Wilkinson MJ, Monson RK, Alo CA, Wang G, and Guenther A: Response of isoprene emission to ambient CO2 changes and implications for global budgets, Global Change Biol, 2009, 15, 1127–1140. [Google Scholar]
- 38.Huang L, McGaughey G, McDonald-Buller E, Kimura Y, Allen DT, Quantifying regional, seasonal and interannual contributions of environmental factors on isoprene and monoterpene emissions estimates over eastern Texas. Atmospheric Environment, 2015, 106, 120–128. [Google Scholar]
- 39.IPCC (Intergovernmental Panel on Climate Change), Climate Change, The Physical Science Basis. Summary for Policymakers, Alexander L et al. , Eds. (IPCC Secretariat, Geneva, Switzerland, 2013). doi:10.1017/CBO9781107415324. [Google Scholar]
- 40.Jiang X, Rauscher SA, Ringler TD, Lawrence DM, Williams AP, Allen CD, Steiner AL, Cai DM and McDowell NG, 2013, Projected future changes in vegetation in Western North America in the twenty-first century J. Clim 2013, 26, 3671–87. [Google Scholar]
- 41.Jiang XY; Yang ZL; Liao H; Wiedinmyer C, Sensitivity of biogenic secondary organic aerosols to future climate change at regional scales An online coupled simulation. Atmospheric Environment, 2010, 44, (38), 4891–4907. [Google Scholar]
- 42.Lamarque J-F, Emmons LK, Hess PG, Kinnison DE, Tilmes S, Vitt F, Heald CL, Holland EA, Lauritzen PH, Neu J, Orlando JJ, Rasch PJ, and Tyndall GK: CAM-chem: description and evaluation of interactive atmospheric chemistry in the Community Earth System Model, Geosci. Model Dev, 2012, 5, 369–411. [Google Scholar]
- 43.Lamb B, Gay D, Westberg H, and Pierce T, A biogenic hydrocarbon emission inventory for the United States using a simple forest canopy model, Atmos. Environ 1993, 27A, 1673–1690. [Google Scholar]
- 44.Lewis SL, Brando PM, Phillips OL, van der Heijden GMF, Nepstad D , The 2010 Amazon drought. Science, 2011, 331, 554. [DOI] [PubMed] [Google Scholar]
- 45.Limousin JM, Misson L, Lavoir AV, Martin NK & Rambal S Do photosynthetic limitations of evergreen Quercus ilex leaves change with long-term increased drought severity? Plant Cell Environ 2010, 33, 863–875. [DOI] [PubMed] [Google Scholar]
- 46.Liu Y, Brito J, Dorris MR, Rivera-Rios JC, Seco R, Bates KH, Artaxo P, Duvoisin S, Keutsch FN, Kim S, Goldstein AH, Guenther AB, Manzi AO, Souza RAF, Springston SR, Watson TB, McKinney KA, and Martin ST, Isoprene photochemistry over the Amazon rainforest. Proc. Natl. Acad, 2016, 10.1073/pnas.1524136113. [DOI] [PMC free article] [PubMed] [Google Scholar]
- 47.Martin-StPaul NK et al. Photosynthetic sensitivity to drought varies among populations of Quercus ilex along a rainfall gradient. Funct. Plant Biol 2012, 39, 25–37. [DOI] [PubMed] [Google Scholar]
- 48.Martin ST, et al. , The Green Ocean Amazon Experiment (GoAmazon2014/5) Observes Pollution Affecting Gases, Aerosols, Clouds, and Rainfall over the Rain Forest, Bull. Am. Meteorol. Soc, 2016, doi:10.1175/BAMS-D-15-00221.1. 28 [Google Scholar]
- 49.McDowell NG, Williams AP, Xu C, Pockman WT, Dickman LT, Sevanto S, Pangle R, Limousin J, Plaut J, Mackay DS, Ogee J, Domec JC, Allen CD, Fisher RA, Jiang X, Muss JD, Breshears DD, Rauscher SA, Koven C, Multi-scale predictions of massive conifer mortality due to chronic temperature rise. Nature Climate Change. 2015, DOI: 10.1038/NCLIMATE2873. [Google Scholar]
- 50.Monson RK, Grote R, Niinemets Ü & Schnitzler J-P, Modeling the isoprene emission rate from leaves. New Phytologist, 2012, 195, 541–559. [DOI] [PubMed] [Google Scholar]
- 51.Monson RK, Harley PC, Litvak ME, Wildermuth M, Guenther AB, Zimmerman PR, Fall R, Environmental and developmental controls over the seasonal pattern of isoprene emission from aspen leaves. Oecologia, 1994, 99, 260–270. [DOI] [PubMed] [Google Scholar]
- 52.Montané F, Fox AM, Arellano AF, MacBean N, Alexander MR, Dye A, Bishop DA, Trouet V, Babst F, Hessl AE, Pederson N, Blanken PD, Bohrer G, Gough CM, Litvak ME, Novick KA, Phillips RP, Wood JD, and Moore DJP: Evaluating the effect of alternative carbon allocation schemes in a land surface model (CLM4.5) on carbon fluxes, pools, and turnover in temperate forests, Geosci. Model Dev, 2017, 10, 3499–3517. [Google Scholar]
- 53.Muller J-F, Stavrakou T, Wallens S€ et al. , Global isoprene emissions estimated using MEGAN, ECMWF analyses and a detailed canopy environment model. Atmospheric Chemistry and Physics, 2008, 8, 1329–1341. [Google Scholar]
- 54.Niinemets Ü, Tenhunen JD, Harley PC, Steinbrecher R (1999) A model of isoprene emission based on energetic requirements for isoprene synthesis and leaf photosynthetic properties for Liquidambar and Quercus. Plant Cell Environ, 1999, 22,1319–1335. [Google Scholar]
- 55.Niinemets U, Mild versus severe stress and BVOCs: thresholds, priming andconsequences. Trends in Plant Science, 2010, 15, 145–153. [DOI] [PubMed] [Google Scholar]
- 56.Oleson KW, Lawrence DM, Bonan GB, Drewniak B, Huang M, Koven CD, Levis S, Li F, Riley WJ, Subin ZM, Swenson SC, Thornton PE, Bozbiyik A, Fisher R, Kluzek E, Lamarque J-F, Lawrence PJ, Leung LR, Lipscomb W, Muszala S, Ricciuto DM, Sacks W, Sun Y, Tang J, Yang Z-L, Technical Description of version 4.5 of the Community Land Model (CLM) Ncar Technical Note NCAR/TN-503+STR, National Center for Atmospheric Research, Boulder, CO, 2013, 422 pp, DOI: 10.5065/D6RR1W7M. [Google Scholar]
- 57.Pacifico F, Folberth GA, Jones CD, Harrison SP, and Collins WJ, Sensitivity of biogenic isoprene emissions to past, present, and future environmental conditions and implications for atmospheric chemistry, J. Geophys. Res, 2012, 117, D22302, doi:10.1029/2012JD018276. [Google Scholar]
- 58.Park J-H, Goldstein AH, Timkovsky J, Fares S, Weber R, Karlik J, and Holzinger R: Active Atmosphere-Ecosystem Exchange of the Vast Majority of Detected Volatile Organic Compounds, Science, 2013, 341, 643–647. [DOI] [PubMed] [Google Scholar]
- 59.Paulot F, Crounse JD, Kjaergaard HG, Kürten A, St. Clair JM, Seinfeld JH and Wennberg PO, Unexpected epoxide formation in the gas-phase photooxidation of isoprene, Science, 2009, 325, 730–733. [DOI] [PubMed] [Google Scholar]
- 60.Pegoraro E, Rey A, Greenberg J, Harley P, Grace J, Malhi Y, Guenther A, Effect of drought on isoprene emission rates from leaves of Quercus virginiana Mill. Atmospheric Environment, 2004, 38, 6149–6156. [Google Scholar]
- 61.Peñuelas J and Staudt M, BVOCs and Global Change, Trends in Plant Science, 2010, 15, 133–144. [DOI] [PubMed] [Google Scholar]
- 62.Petron G, Harley P, Greenberg J, and Guenther A, Seasonal temperature variations influence isoprene emission, Geophys. Res. Lett, 2001, 28 (9), 1707–1710. [Google Scholar]
- 63.Piao et al. , The carbon budget of terrestrial ecosystems in East Asia over the last two decades. Biogeosciences, 2012, 9, 3571–3586. [Google Scholar]
- 64.Potosnak MJ, LeStourgeon L, Pallardy SG, Hosman KP, Gu L, Karl T, Geron C, and Guenther AB, Observed and modeled ecosystem isoprene fluxes from an oak-dominated temperate forest and the influence of drought stress. Atmos. Environ, 2014, 84, 314–322. [Google Scholar]
- 65.Pryor SC, Hornsby KE, and Novick KA, Forest canopy interactions with nucleation mode particles, Atmos. Chem. Phys, 2014, 14, 11985–11996. [Google Scholar]
- 66.Rauscher S A, Jiang X, Steiner A, Williams A P, Cai D M and McDowell N G, Sea surface temperature warming patterns and future vegetation change J. Clim 2015, 28, 7943–61. [Google Scholar]
- 67.Rienecker MM, Suarez MJ, Gelaro R, Todling R, Bacmeister J, Liu E, Bosilovich MG, Schubert SD, Takacs L, Kim G-K, Bloom S, Chen J, Collins D, Conaty A, da Silva A, Gu W, Joiner J, Koster RD, Lucchesi R, Molod A, Owens T, Pawson S, Pegion P, Redder CR, Reichle R, Robertson FR, Ruddick AG, Sienkiewicz M, and Woollen J: MERRA: NASA’s Modern-Era Retrospective Analysis for Research and Application, J. Climate, 2011, 24, 3624–3648. [Google Scholar]
- 68.Saveyn A, Steppe K, Lemeur R, Drought and the diurnal patterns of stem CO2 efflux and xylem CO2 concentration in young oak (Quercus robur). Tree Physiology, 2007, 27, 365–374. [DOI] [PubMed] [Google Scholar]
- 69.Saxton JE, Lewis AC, Kettlewell JH, Ozel MZ, Gogus F, Boni Y, Korogone SOU, and Serça D: Isoprene and monoterpene measurements in a secondary forest in northern Benin, Atmos. Chem. Phys, 2007, 7, 4095–4106. [Google Scholar]
- 70.Seco R, Karl T, Guenther A, Hosman KP, Pallardy SG, Gu L, Geron C, Harley P and Kim S, Ecosystem-scale volatile organic compound fluxes during an extreme drought in a broadleaf temperate forest of the Missouri Ozarks (central USA). Glob Change Biol, 2015, 21, 3657–3674. [DOI] [PubMed] [Google Scholar]
- 71.Sharkey TD, Singsaas EL, Lerdau MT & Geron CD, Weather effects on isoprene emission capacity and applications in emissions algorithms. Ecological Applications, 1999, 9, 1132–1137. [Google Scholar]
- 72.Sharkey TD and Loreto F, Water stress, temperature, and light effects on the capacity for isoprene emission and photosynthesis of kudzu leaves, Oecologia, 1993, 95, 328–333. [DOI] [PubMed] [Google Scholar]
- 73.Šimpraga M, Verbeeck H, Demarcke M, Joo E, Pokorska O, Amelynck C, Schoon N, Dewulf J, Van Langenhove H, Heinesch B, Aubinet M, Laffineur Q, Müller JF, Steppe K. Clear link between drought stress, photosynthesis and biogenic volatile organic compounds in Fagus sylvatica L. Atmospheric Environment, 2011, 45(30), 5254–5259. [Google Scholar]
- 74.Sindelarova K, Granier C, Bouarar I, Guenther A, Tilmes S, Stavrakou T, Müller J-F, Kuhn U, Stefani P, and Knorr W: Global data set of biogenic VOC emissions calculated by the MEGAN model over the last 30 years, Atmos. Chem. Phys, 2014, 14, 9317–9341. [Google Scholar]
- 75.Singsaas EL, & Sharkey TD, The effects of high temperature on isoprene synthesis in oak leaves. Plant, Cell and Environment, 2000, 23(7), 751–757. [Google Scholar]
- 76.Squire OJ, Archibald AT, Abraham NL, Beerling DJ, Hewitt CN, Lathière J, Pike RC, Telford PJ, and Pyle JA: Influence of future climate and cropland expansion on isoprene emissions and tropospheric ozone, Atmos. Chem. Phys, 2014, 14, 1011–1024. [Google Scholar]
- 77.Squire OJ, Archibald AT, Griffiths PT, Jenkin ME, Smith D, and Pyle JA: Influence of isoprene chemical mechanism on modelled changes in tropospheric ozone due to climate and land use over the 21st century, Atmos. Chem. Phys, 2015, 15, 5123–5143. [Google Scholar]
- 78.Tawfik AB, St€ockli R, Goldstein A, Pressley S, Steiner AL, Quantifying the contribution of environmental factors to isoprene flux interannual variability. Atmospheric Environment, 2012, 54, 216–224. [Google Scholar]
- 79.Tingey D, The effect of environmental factors on the emission of biogenic hydrocarbons from live oak and slash pine. Atmospheric Biogenic Hydrocarbons, 1981, 53–72. [Google Scholar]
- 80.Unger N, Harper K, Zheng Y, Kiang NY, Aleinov I, Arneth A, Schurgers G, Amelynck C, Goldstein A, Guenther A, Heinesch B, Hewitt CN, Karl T, Laffineur Q, Langford B, McKinney KA, Misztal P, Potosnak M, Rinne J, Pressley S, Schoon N, and Serça D, Photosynthesis-dependent isoprene emission from leaf to planet in a global carbon-chemistry-climate model. Atmos. Chem. Phys, 2013, 13, 10243–10269. [Google Scholar]
- 81.Wiedinmyer C, et al. , A land use database and examples of biogenic isoprene emission estimates for the state of Texas, USA, Atmos. Environ, 2001, 35, 6465–6477. [Google Scholar]
- 82.Wiedinmyer C, Tie X, Guenther A, Neilson R, and Granier C, Future Changes in Biogenic Isoprene Emissions: How Might They Affect Regional and Global Atmospheric Chemistry?, Earth Interact, 2006, 10(3). [Google Scholar]
- 83.Wiedinmyer C, Akagi SK, Yokelson RJ, Emmons LK, AlSaadi JA, Orlando JJ, and Soja AJ: The Fire Inventory from NCAR (FINN), a high resolution global model to estimate the emissions from open burning, Geosci. Model Dev, 2011, 4, 625–641. [Google Scholar]
- 84.Zheng Y, Unger N, Barley M, and Yue X, Relationships between photosynthesis and formaldehyde as a probe of isoprene emission, Atmos. Chem. Phys, 2015, 15, 8559–8576. [Google Scholar]
- 85.Zhou SX, Medlyn B, Sabaté S, Sperlich D & Prentice IC Short-term water stress impacts on stomatal, mesophyll and biochemical limitations to photosynthesis differ consistently among tree species from contrasting climates. Tree Physiol, 2014, 34, 1035–1046. [DOI] [PubMed] [Google Scholar]


