Abstract
Geographic information system (GIS) nowadays is one of the most helpful epidemiological tools for identifying the high risk areas of cutaneous leishmaniasis (CL). This study was conducted to determine the spatio-temporal distribution of CL in Qom province during 2009–2017. In a cross-sectional study, for the survey of spatial dispersion of CL in the study region, the incidence rate of disease was calculated in all of 23 villages during 2009–2017. Then, spatial analysis of the infection was performed using two methods: spatial autocorrelation (Moran’s I) in order to determine the special distribution pattern of disease and Kriging method to reveal high risk areas for disease. The incidence of CL in Qom province has been decreasing as of 2009–2015 and increasing in 2015–2017. The highest incidence was stated in 2009 (36.5 per 100,000) and the least was reported in 2015 (13.3 per 100,000). The Moran autocorrelation index revealed that the study area has a cluster pattern. The temporal distribution of disease incidence showed that northeast, southwest and northwest parts of Qom province involved highest incidence of CL in 90% significant level. Leishmaniasis incidence is a function of spatial and geographical trends, thus spatial variations of the infection incidence illustrate that the incidence rate does not increase or decrease from one region to another intensively. The results of this study indicate that marking high risk areas using spatial analysis can be helpful as a main tool in CL control and prevention.
Keywords: Cutaneous leishmaniasis, Spatio-temporal analysis, GIS, Qom, Iran
Introduction
Cutaneous leishmaniasis (CL) has a vast worldwide distribution. The cases are mostly seen in tropical and subtropical regions. Geographical spread of the infection is a function of its vectors dispersal, the sand flies (Steverding 2017; Torres-Guerrero et al. 2017). An estimated 600,000–1 million new CL cases occur annually in the world with over two-thirds of cases in 6 countries: Afghanistan, Algeria, Brazil, Colombia, Iran and the Syrian Arab Republic (WHO 2018). Cutaneous leishmaniasis is endemic in semi parts of all 31 provinces of Iran (Alvar et al. 2012). It seems that Iran has a proper geographic and climatic conditions for the rodents and sandflies as the infection reservoirs and vectors (Norouzinezhad et al. 2016). The research results indicate that CL cases incidence is rising, resulting in environmental changes caused by human, such as uncontrolled exploitation of wood resources and deforestation, mining, damming, agricultural extension, new Irrigation methods, development of forest roads, as well as urbanization and extensive rural–urban migration. Moreover, poverty and malnutrition are the disease contributed factors. Generally, CL risk factors are expressed based on parameters like age, sex, economic conditions, and other social factors (Shakila et al. 2006). Studies show that CL distribution has not the same pattern in Iran and there are several hotspots of the disease in different regions (Yaghoobi-Ershadi et al. 2004). Identifying these high risk areas can be effective in CL incidence control and preventive programs management. Presently, GIS as one of the most important epidemiological tools is useful and effective in determining populations at risk of zoonotic diseases including CL, prevention planning and monitoring services in terms of time and place. Geographic Information System as a computer software provides spatial distribution pattern of diseases to study the relevant outbreak factors and maps out the spatial distribution of each disease quantitatively and qualitatively (Shakila et al. 2006; Khan et al. 2010; Tanser and le Sueur 2002). One of GIS widely in use applications in the world is informing and helping to make health management decisions for preventing the occurrence and prevalence of diseases to control various diseases such as CL, malaria and HIV infection (Alvar et al. 2012; Norouzinezhad et al. 2016; Shakila et al. 2006; Parvizi and Ahmadipour 2011). The main intention of this study is to determine spatio-temporal distribution of cutaneous leishmaniasis in Qom province, located in the center of Iran, during the study period of 2009–2017.
Materials and methods
The study area, Qom province in central Iran is one of the main foci of cutaneous leishmaniasis (Fig. 1). Qom is one of the 31 provinces of Iran, located between 50°06′–51°58′E and 34°09′–35°11′N in central part of Iran with an area of 11,237 km2 covering 0.89% of the total land of country (Farzinnia et al. 2010). Provincial capital of the province is city of Qom (Fig. 1). Based on the most recent census in 2016, the province has a population of approximately 1,200,000 out of which 91.2% inhabit in urban areas and 8.8% in rural environs (Saghafipour et al. 2018). The climate of Qom province varies between a desert and semi-desert conditions. Geographically, the province comprises mountainous areas, foothills and plains. Usually it experiences a dry climate, with low humidity and scanty rainfall. In the last year, the minimum and maximum temperatures were recorded − 14 °C in December and + 47 °C in June, respectively. The annual rainfall was 86.9 mm and relative humidity was ranged between 8.5% in June and 89.1% in December. With the aim to investigate the spatial and temporal changes of CL in the study area, patient residence data was received from Contagious Diseases Control Center in Iran Ministry of Health and Medical Education in 9 years’ period: 2009–2017. In order to investigate spatial variations of CL, the incidence of disease was calculated in all of 23 villages of the study years based on formula (Gordis 2009):
Afterward, spatio-temporal analysis of the disease was performed using two analyzes: Kriging method and Spatial Moron correlation in GIS environment.
Fig. 1.
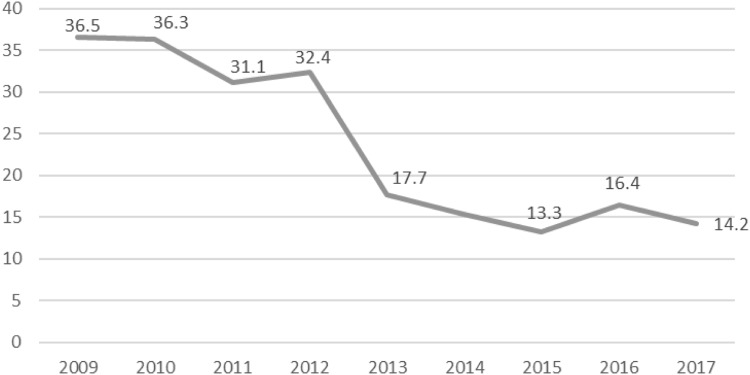
Incidence of cutaneous leishmaniasis incidence in the Qom province, central Iran, from 2009 to 2017
Kriging method is one of interpolation methods (Kleijnen 2009). In this study, the CL disease data were represented with data point. So, in order to reveal high risk areas for CL disease in different regions of Qom province, interpolation (Kriging) method was utilized. Ultimately we classified the study areas into seven categories with different incidence of CL.
Kriging method was applied based on formula:
where Z(si) = the measured value at the ith location, λi = an unknown weight for the measured value at the ith location, s0 = the prediction location, N = the number of measured values.
In the Kriging method of ArcGIS software, randomized distribution of cutaneous leishmaniasis in Qom province villages was tested in 0.05 significance level and 20 km bandwidth.
Global Index of Spatial Autocorrelation–Moran’s I is one of the most practical and most important analytical tests on spatial data (Chen 2013). Z score for this index varies between 1 and − 1. If the z score is greater than zero, the disease has a cluster spatial diffusion pattern, if the z score is smaller than zero, the spatial pattern of disease diffusion will be diffused and if the z score equal to zero, the pattern of spatial distribution of the disease is random.
Moran index for spatial autocorrelation was calculated as follows:
In this formula zi is the difference between the Attribute complication i and its mean . is spatial weight between i and j components. n is total number of complications and S0 is the total sum of spatial weights. Total number of spatial weights was calculated by the following equation:
The ZI rating was calculated as a standard for Moran statistics through following:
Microsoft Office Excel 2017 software was used for data entry and the maps and kriging method was handled using ArcGIS version 9.3.
Results
1-Incidence of cutaneous leishmaniasis
The incidence rate of CL decreases from 2009 to 2015 and heightens from 2015 to 2017. During the survey period, the highest incidence was stated in 2009 (36.5 per 100,000) and the lowest was recorded in 2015 (13.3 per 100,000). Figure 1 displays year-wise data on incidences of CL cases in study period.
2-Spatial distribution of CL (Moran Autocorrelation Index)
Moran spatial autocorrelation index was used to determine the spatial pattern of the disease distribution. Regarding the high incidence of disease in northeastern, southwest and northwest of the province.
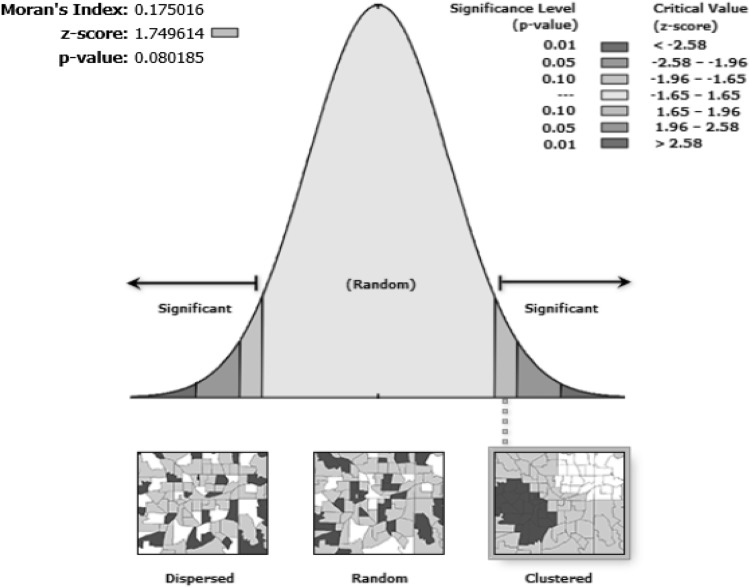
The result of Moran index showed, z score is greater than zero in all study years except 2014. Therefore, it means that the study area in terms of the incidence of disease in all years except for 2014 has a cluster pattern (Table 1 and Fig. 2).
Table 1.
Global Index of Spatial Autocorrelation–Moran’s I plotted on the study area map and overlaid with cutaneous leishmaniasis incidence in Qom province, central Iran during 2009–2017
| Moran’s I | Z-Score | Clustered | |
|---|---|---|---|
| 2010 | 0.314 | 2.876 | ✓ |
| 2011 | 0.253 | 2.383 | ✓ |
| 2012 | 0.439 | 3.881 | ✓ |
| 2013 | 0.241 | 2.264 | ✓ |
| 2014 | 0.009 | 1.045 | × |
| 2015 | 0.238 | 2.215 | ✓ |
| 2016 | 0.208 | 2.222 | ✓ |
| 2017 | 0.175 | 1.749 | ✓ |
Fig. 2.
Spatial autocorrelation–Moran’s I plotted on the study area map and overlaid with cutaneous leishmaniasis incidence in Qom province, central Iran during 2009–2017
In other words, neighboring regions have the same statement of the disease incidence that forms spatial clusters. Because of very small p value and larger than 1.65 z score, it is concluded that the cluster pattern of the disease incidence cannot be accidental. The adjacent regions have spatial self-correlation so that randomness of spatial distribution of CL incidence assumption is rejected.
3-Temporal variation of CL (Kriging method)
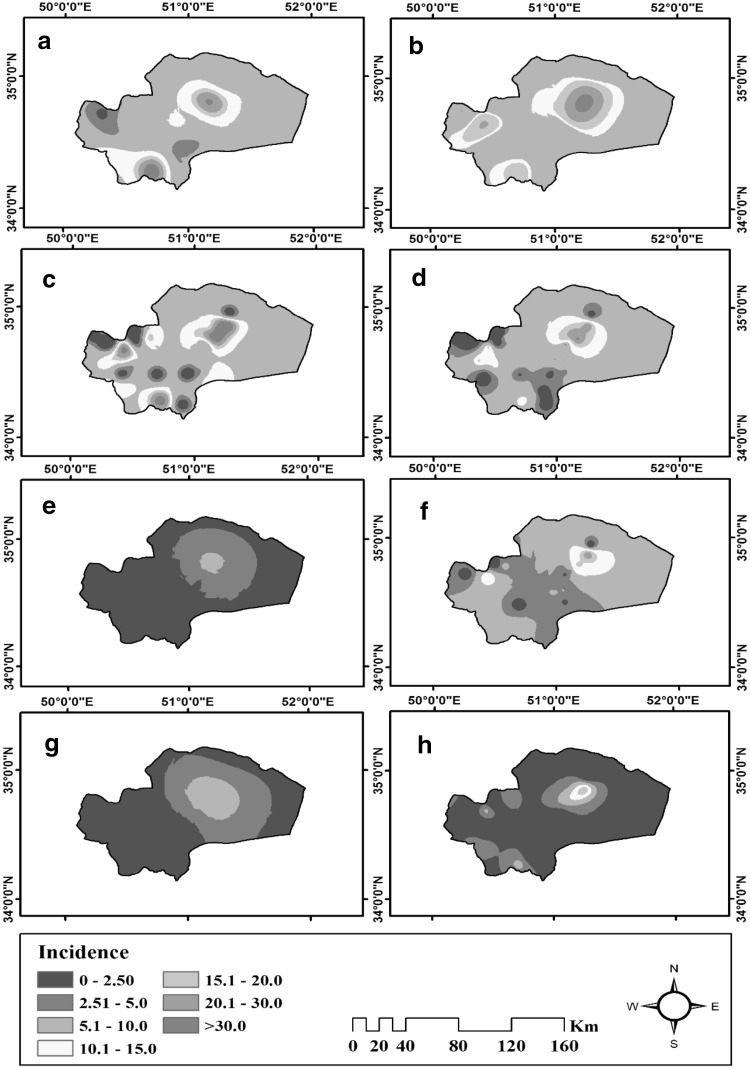
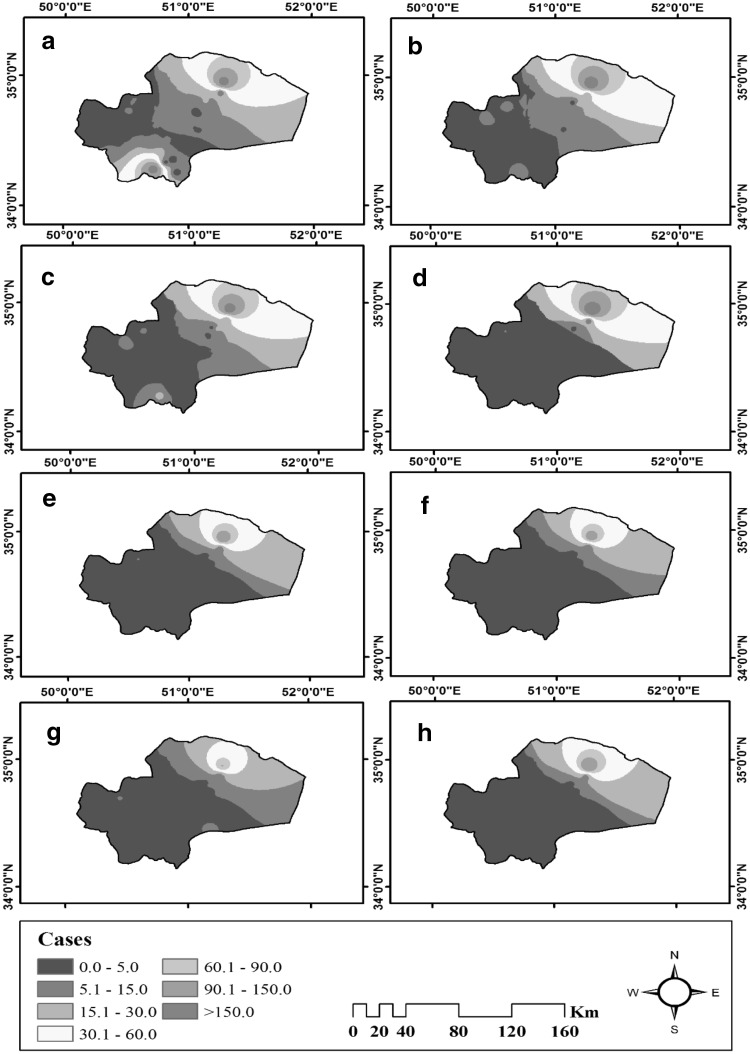
Interpolation results are classified in seven categories. Several zones with high incidence of CL are clearly indicated from spatial variations over the 8 years’ period, one of these regions in the northeast of the province is larger than the others, furthermore there are two other zones in the southwest and Northwest. Time variations indicate that the maximum incidence of the disease occurs in 2009, 2010 and 2011, and the minimum incidence takes place in the years 2013, 2015, 2016 and 2017. It is also observed that the incidence of CL has been decreasing from 2009 to 2017. The other year’s results are exposed in Table 1 and Figs. 3, 4.
Fig. 3.
Temporal distribution maps related to cutaneous leishmaniasis incidence in Qom province; central Iran from 2010 to 2017
Fig. 4.
Temporal distribution maps related to number of cutaneous leishmaniasis cases in Qom province; central Iran from 2009 to 2017
Discussion
In distribution map of CL incidence and prevalence in Iran, the main focuses of the disease were identified in Isfahan, North Khorasan, Razavi Khorasan, Central, Fars, South Khorasan, Kerman, Qom, Tehran, Qazvin and Semnan provinces respectively (Bayatani and Sadeghi 2012). The incidence of CL in Qom province has been decreasing from 2009 to 2015 and has increased from 2015 to 2017. The highest incidence was reported in 2009 (36.5 per 100,000) and the lowest was stated in 2015 (13.3 per 100,000). Spatial variations of CL show that the highest incidence of CL occurs in the northeast, southwest and northwest of the province. In this study, using Moran spatial autocorrelation index to determine spatial pattern of the disease distribution in the study area showed a cluster pattern. Spatial change analysis of CL incidence special distribution result showed that 90% of cases were resident in the northeast, southwest and northwest of Qom province form hot spots at a significant level. It is scientifically proven in previous studies, sand fly’s activity, growth and proliferation, as CL vectors, is more influenced by climatic factors such as soil moisture, evapotranspiration, vegetation indices, humidity, precipitation, and rather temperature (Ready 2008). In fact, CL incidence is a function of sand fly’s population which is influenced by climatic factors such as temperature and humidity so leishmaniasis is indirectly affected by climatic factors. Obviously, the incidence rate of the disease can be affected by a variety of factors in addition to sand fly’s population like the changes in reservoirs (rodents) density. At the time of drought, the population of wild rodents might approach to human settlements which increases infection and incidence of the disease as a result of sand flies bite from these rodents and transmission of Leishmania parasites to humans through inoculation. The average air temperature in the northeast, southwest and northwest of Qom province is 25.51, 20.82 and 19.03 °C and relative humidity in north-east, southwest and northwest of Qom province is 12.12, 35.38 and 21.52% respectively. It is proven that all sand fly’s species grow at temperatures above 18 °C, which is the threshold temperature for their lives. Various researches findings show the optimum temperature for development of renaturation stages in sand flies at 28–29 °C (Rassi and Hanafi–Bojd 2008). Studies in Rajasthan region in India defined that thermal threshold for development of sand flies is around 35–17 °C (Singh 1999). Mature sand flies activating during sunset and night, when the air temperature and humidity rises, can cause transmission of the disease through Leishmania infected bites. Sand fly eggs development optimum relative humidity is near 80%. According to Sink et al. findings, relative humidity threshold for Leishmania vectors survival is 30% and 31–85% humidity is optimum for sand fly’s activity (Singh 1999). Therefore, in the study area, humidity conditions are available for sand fly’s activity and leishmaniasis transmission by bloodsucking from the hosts like human. Even with the humidity need in sand flies breeding sites, very high moisture can cause larvae migration (Rassi and Hanafi–Bojd 2008). Thus it is settled that appropriate temperature and humidity conditions are available for sand flies and CL incidence in the northeast, southwest and northwest of Qom province. Considering cluster spatial distribution of CL in northeast, southwest and northwest of Qom province, revealed that most of CL transmission occurred in northeast of the province as a n high risk of disease. It can be concluded that the occurrence of CL is a function of spatial and geographic trends. Spatial variations of the disease incidence show that it is not increasing or decreasing strongly from one region to another but it appears as hot spot areas. The study discoveries show that spatial analysis can be helpful as a strong tool for CL control and prevention through determining high risk areas.
Acknowledgements
The authors are grateful to the research deputy of Qom University of Medical Science. Ethical clearance was earned from the Institutional Ethics Committee of Razavi Khorasan University of Medical Sciences (QUMS.REC.1396.114).
Author contributions
Conceptualization: MS AS MS. Data curation: MS AS. Formal analysis: MJ NJ. Funding acquisition: AS. Methodology: AS MRS MJ. Project administration: MS AS. Resources: AS. Software: NJ. Supervision: AS. Validation: LZF. Visualization: MS AS. Writing ± original draft: MS AS MRS LZF. Writing ± review and editing: AS.
Compliance with ethical standards
Conflict of interest
None.
Contributor Information
Mojtaba Salimi, Email: salimi8500@yahoo.com.
Nahid Jesri, Email: nahid.jesri@yahoo.com.
Mohammad Javanbakht, Email: mjavanbakht70@gmail.com.
Leyli Zanjirani Farahani, Email: leyli.zfarahani@gmail.com.
Mohammad Reza Shirzadi, Email: shirzadim@gmail.com.
Abedin Saghafipour, Email: abed.saghafi@yahoo.com.
References
- Alvar J, Vélez ID, Bern C, Herrero M, Desjeux P, Cano J, et al. Leishmaniasis worldwide and global estimates of its incidence. PLoS ONE. 2012;7:e35671. doi: 10.1371/journal.pone.0035671. [DOI] [PMC free article] [PubMed] [Google Scholar]
- Bayatani A, Sadeghi A. Spatial analysis of environmental factors of cutaneous leishmaniasis in Iran using GIS. Hakim Res J. 2012;15:158–165. [Google Scholar]
- Chen Y. New approaches for calculating Moran’s Index of spatial autocorrelation. PLoS ONE. 2013;8:e68336. doi: 10.1371/journal.pone.0068336. [DOI] [PMC free article] [PubMed] [Google Scholar]
- Farzinnia B, Saghafipour A, Abai M. Malaria situation and anopheline mosquitoes in Qom province, Central Iran. Iran J Arthropod-Borne Dis. 2010;4:61–67. [PMC free article] [PubMed] [Google Scholar]
- Gordis L. Epidemiology. Philadelphia: Saunders; 2009. pp. 247–263. [Google Scholar]
- Khan OA, Davenhall W, Ali M, Castillo-Salgado C, Vazquez-Prokopec G, Kitron U, et al. Geographical information systems and tropical medicine. Ann Trop Med Parasitol. 2010;104:303–318. doi: 10.1179/136485910X12743554759867. [DOI] [PMC free article] [PubMed] [Google Scholar]
- Kleijnen JPC. Kriging metamodeling in simulation: a review. Eur J Oper Res. 2009;192:707–716. doi: 10.1016/j.ejor.2007.10.013. [DOI] [Google Scholar]
- Norouzinezhad F, Ghaffari F, Norouzinejad A, Kaveh F, Gouya MM. Cutaneous leishmaniasis in Iran: results from an epidemiological study in urban and rural provinces. Asian Pac J Trop Biomed. 2016;6:614–619. doi: 10.1016/j.apjtb.2016.05.005. [DOI] [Google Scholar]
- Parvizi P, Ahmadipour F. Fauna, abundance and dispersion of sandflies in three endemic areas of cutaneous leishmaniasis in rural fars province. J Shahid Sadoughi Univ Med Sci. 2011;19:173–182. [Google Scholar]
- Rassi Y, Hanafi–Bojd AA. Phlebotominae sand flies, vector of leishmaniases. 1. Tehran: Noavaran Elm Publications; 2008. pp. 39–58. [Google Scholar]
- Ready PD. Leishmaniasis emergence and climate change. Rev Sci Tech. 2008;27:399–412. doi: 10.20506/rst.27.2.1803. [DOI] [PubMed] [Google Scholar]
- Saghafipour A, Zahraei-Ramazani A, Vatandoost H, Mozaffari E, Rezaei F, Karami Jooshin M. Prevalence and risk factors associated with head louse (Pediculus humanus capitis) among primary school girls in Qom province, Central Iran. Int J Pediatr. 2018;6:7553–7562. [Google Scholar]
- Shakila A, Bilqees FM, Salim A, Moinuddin M. Geographical distribution of cutaneous leishmaniasis and sand flies in Pakistan. Turk J Parasitol. 2006;30:1–6. [PubMed] [Google Scholar]
- Singh K. Studies on the role of climatological factors in the distribution of phlebotomine sandflies (Diptera: Psychodidae) in semi-arid areas of Rajasthan, India. J Arid Environ. 1999;42:43–48. doi: 10.1006/jare.1999.0499. [DOI] [Google Scholar]
- Steverding D. The history of leishmaniasis. Parasites Vectors. 2017;10:82. doi: 10.1186/s13071-017-2028-5. [DOI] [PMC free article] [PubMed] [Google Scholar]
- Tanser FC, le Sueur D. The application of geographical information systems to important public health problems in Africa. Int J Health Geogr. 2002;1:4. doi: 10.1186/1476-072X-1-4. [DOI] [PMC free article] [PubMed] [Google Scholar]
- Torres-Guerrero E, Quintanilla-Cedillo MR, Ruiz-Esmenjaud J, Arenas R. Leishmaniasis: a review. F1000Res. 2017;6:750. doi: 10.12688/f1000research.11120.1. [DOI] [PMC free article] [PubMed] [Google Scholar]
- World Health Organization (WHO) Global health observatory. http://www.who.int/mediacentre/factsheets/fs375/en/. Accessed on March 2018
- Yaghoobi-Ershadi MR, Jafari R, Hanafi-Bojd AA. A new epidemic focus of zoonotic cutaneous leishmaniasis in central Iran. Ann Saudi Med. 2004;24:98–101. doi: 10.5144/0256-4947.2004.98. [DOI] [PMC free article] [PubMed] [Google Scholar]


