. 2018 Nov 28;7:e38090. doi: 10.7554/eLife.38090

Figure 4. Dopamine release when the outcome was delivered to the recording rat (i.e., self).

(A) Average DA release over trial time (n = 40 sessions, 8 rats). See Figure 4—figure supplements 1 and 2 for example sessions. Shock trials (red) are truncated due to shock artifact. (B–D) During the directional cue epoch (i.e., 5 s after directional cue) of each session indices were computed by subtracting average DA release during ‘together’ trials from ‘alone’ trials (Alone minus Together) for reward (blue; B), neutral (green; C), and shock (red; D) during ‘self’ trials. (E) Distributions of the same indices as in B-D (Alone – Together for reward, neutral and shock trials) shown by session (small dots) and rat (large dots) color coded by rat identity. See Figure 4—figure supplement 3 for regressions between behavior and DA release by session and rat. (F–I) Reward (reward – neutral) and shock (shock – neutral) indices taken during the directional cue epoch when rats were alone (F and G) or together (H and I). Distributions of indices were deemed significantly shifted from zero via Wilcoxon (insets provide mean (µ) and p value).

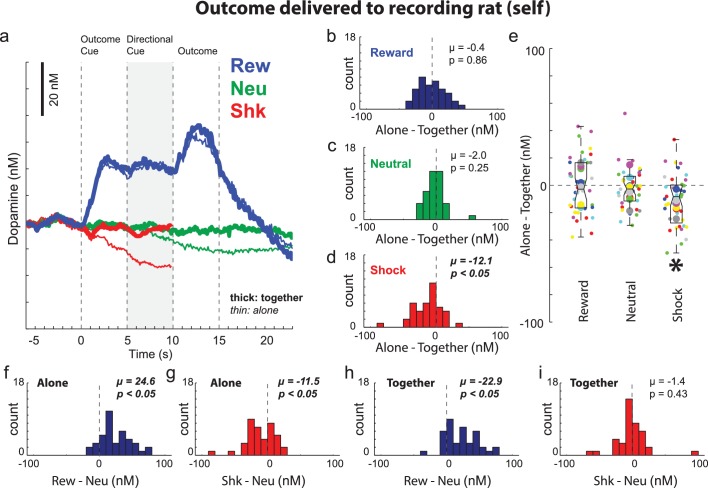
Figure 4.

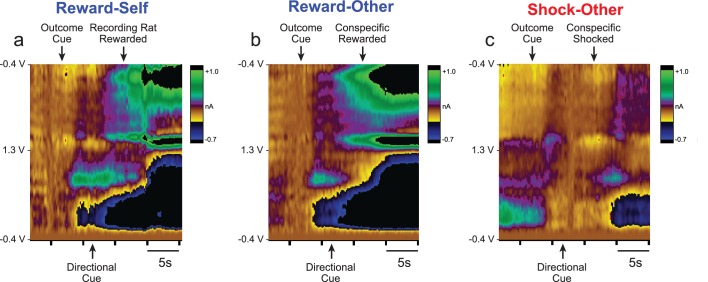
Figure 4—figure supplement 1. Example false-color plots for reward-self, reward-other, and shock-other trial-types.

Figure 4—figure supplement 1.

In the main text we show average DA release over all rats and sessions on ‘other’ trials during performance of the Pavlovian social distress paradigm to make the point that DA release was reduced when the conspecific received reward on reward-other trials and that DA was released upon conspecific foot shock on shock-other trials. Here we show false-color plots that indicate voltammetric current (z-axis) plotted against applied scan potential (y-axis) and time (x-axis) averaged across one session for reward-self (A), reward-other (B), and shock-other (C) trials when the rat was with the conspecific (i.e., together) to make the same points. (A) On together-reward-self trials, DA release was observed at the time of the outcome cue and reward. (B) On together-reward-other trials, DA was released only at the time of the outcome cue, but declined after the directional cue. (C) On together-shock-other trials, DA release was observed at the time of conspecific foot shock.
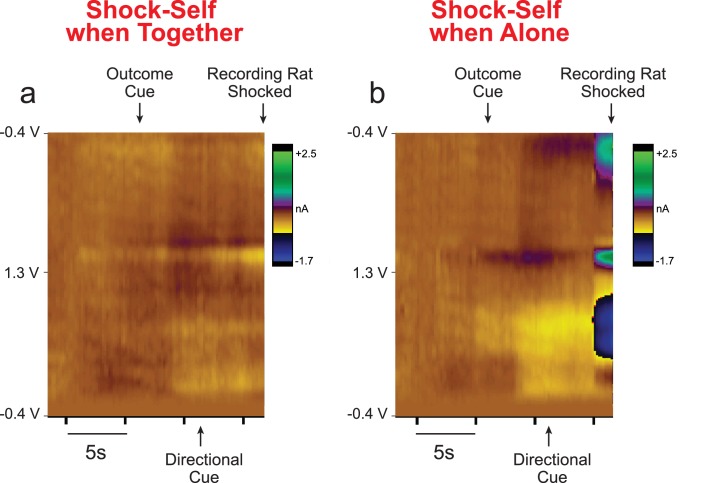
Figure 4—figure supplement 2. Example false-color plots for shock-self and shock-other trial-types when together and alone.

Figure 4—figure supplement 2.

In the main text we show average DA release over all rats and sessions during performance of the Pavlovian social distress paradigm on shock-self trials to make the point that DA release was not reduced during presentation of shock cues when rats were together as opposed to alone. Here we show false-color plots that indicate voltammetric current (z-axis) plotted against applied scan potential (y-axis) and time (x-axis) averaged across one session for shock-self trials when the rat was alone (A) and together (B) to further illustrate this finding.
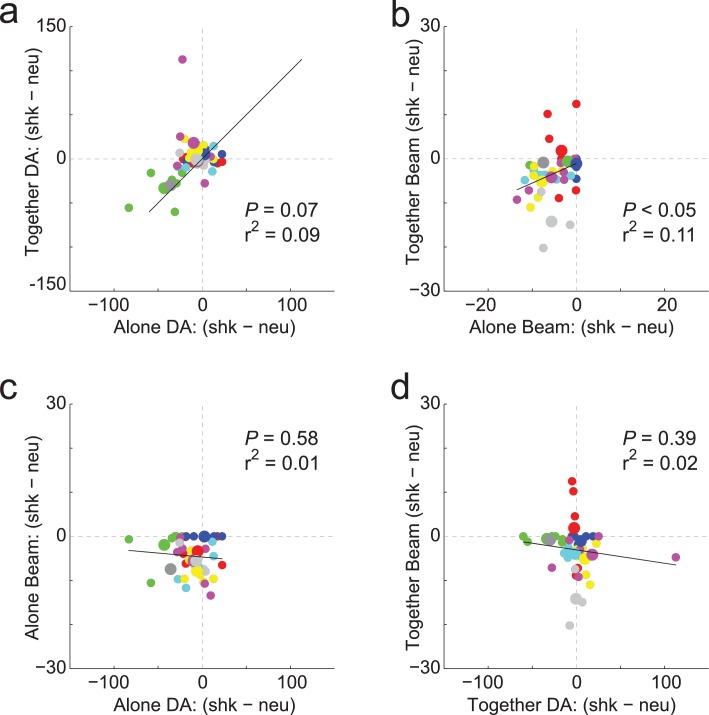
Figure 4—figure supplement 3. Regressions between alone and together for beam breaks and DA release during shock-self trials.

Figure 4—figure supplement 3.

In the main text we show that DA release is less inhibited on self-shock trials when rats are together during the Pavlovian conspecific distress paradigm. We interpret this result as a consolation effect, whereby the threat of shock is not as aversive in the presence of the conspecific. We found that during the directional cue period rats tend to show less of suppression in the food well (Figure 2). In Figure 4—figure supplement 3 we now correlate differences in beam breaks and DA release observed on alone and together trials for sessions and rat averages, color coded as the DA figures were in the main text. Figure 4—figure supplement 3 (A) shows that in the majority of sessions there was reduced DA release during the direction cue epoch on shock trials relative to neutral (as in Figure 4) and there was a near significant correlation between the two (p = 0.066; r2 = 0.086). (B) Likewise, for beam breaks into the food cup, there was a reduction in beam breaks on both alone and together trials, with effects being more pronounced when rats were alone (as in Figure 2). Here, we show that there was a significant correlation between the two (p < 0.05; r2 = 0.11). (C,D) Lastly, we asked if DA and beam breaks were correlated for alone (C) and together (D) trials. Neither were significant (alone: p = 0.58; r2 = 0.008; together: p = 0.39; r2 = 0.02).