. 2018 Oct 19;7:e39911. doi: 10.7554/eLife.39911

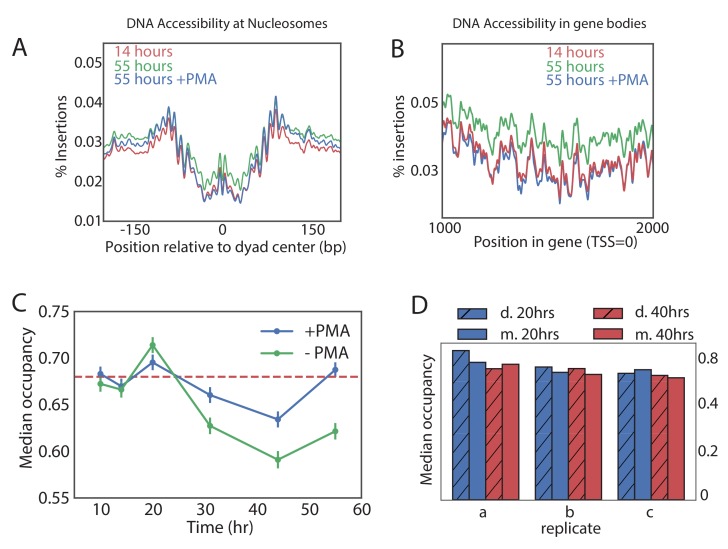
Figure 4. Global nucleosome occupancy remains nearly constant with aging.

(A,B) Tn5 insertion density around well-positioned nucleosomes (A) and 1000 bases downstream of TSS (B) at 14 hr, 55 hr and 55 hr after treatment with PMA. (C) Median nucleosomal occupancy estimated by NucleoATAC on well-positioned nucleosomes in open chromatin at different time points during time course. See Materials and methods for the method of estimation. Error bars represent five standard errors of occupancy. (D) Same as (C) but comparing mothers and daughters during aging time courses - three independent replicates are shown.

Figure 4.

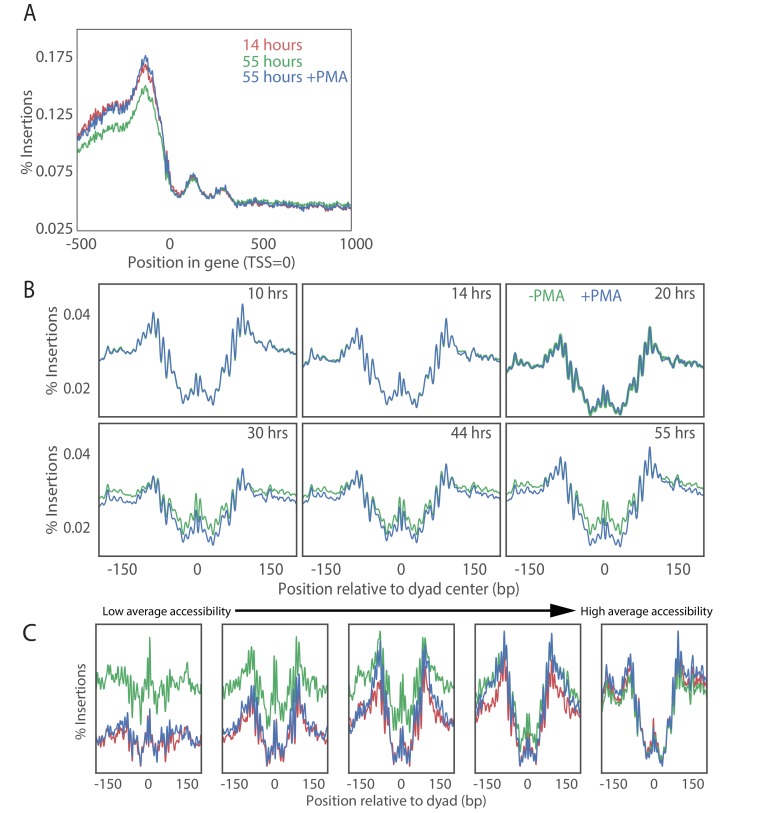
Figure 4—figure supplement 1. PMA treatment rescues young cell ATAC-seq profile at transcriptional start sites in old cell populations.

Figure 4—figure supplement 1.

(A) Metagene plot of ATAC-seq insertion density for genes aligned at the transcription start sites for young cells (red), old cells (green) and old cells with PMA treated (blue). (B) Effect of PMA is strongest at nucleosomes with low accessibility. We binned nucleosomes into five bins according to their average occupancy and observed that the nucleosomes in the low-accessible regions are affected the most consistent with addition of a constant background to the accessibility signal. (C) Insertion density around well-positioned nucleosomes before and after treatment with PMA at various times along aging time courses.
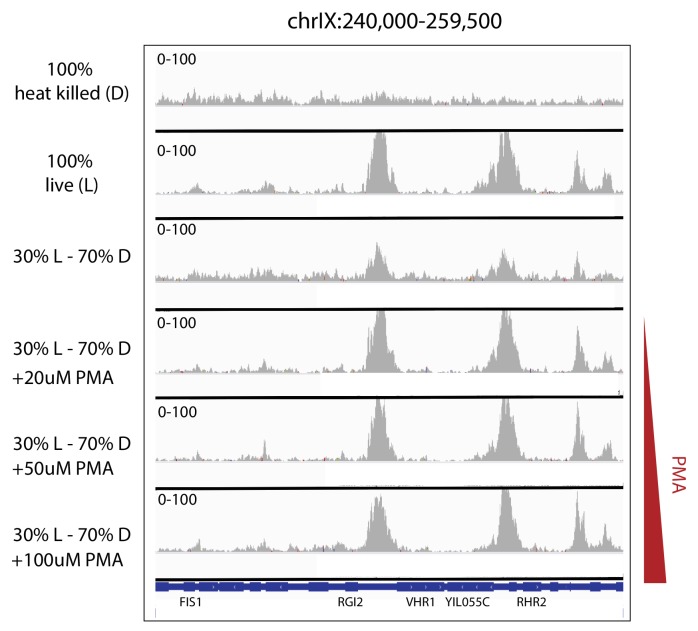
Figure 4—figure supplement 2. Efficacy of PMA in removing the ATAC-seq signature of heat-killed cells from mixed populations.

Figure 4—figure supplement 2.

Depth-normalized ATAC-seq coverage was plotted at specific locus to illustrate the lack of structure in ATAC-seq data from heat-killed cells (top panel) and that treatment with PMA effectively rescues live cell signal from a mixed live/dead population over a range of concentrations (panels 2–6).
Figure 4—figure supplement 3. Mean nucleosomal occupancy estimated by NucleoATAC on well-positioned nucleosomes in open chromatin.
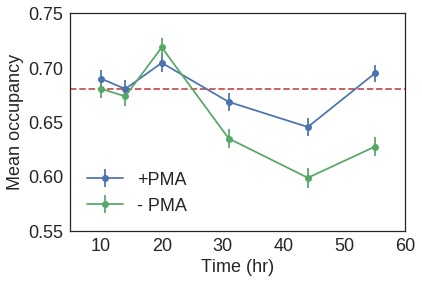
Figure 4—figure supplement 3.

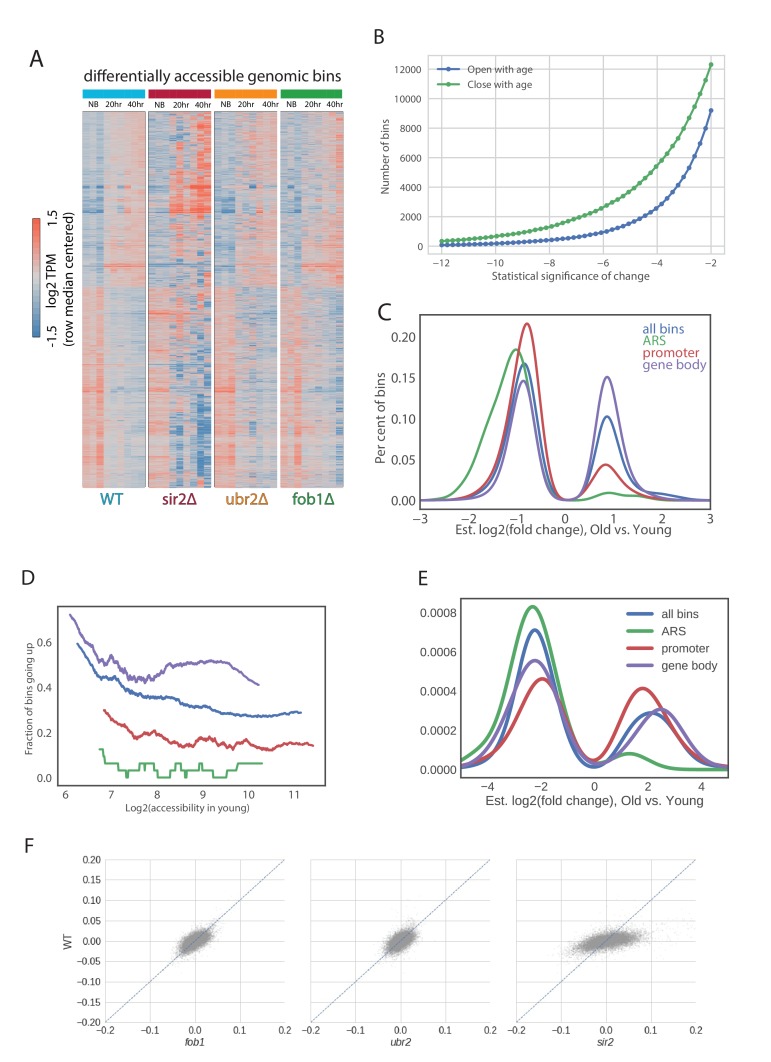
Figure 4—figure supplement 4. ATAC-seq analysis. .

Figure 4—figure supplement 4.

(A) Multiple local changes in chromatin during aging. We show a hierarchically clustered heatmap of bins that significantly change with age (newborn cells at 20 hr (NB), 20 hr of aging and 40 hr of aging) in all profiled strains (see Materials and methods). (B) Number of genomic bins significantly changing accessibility with age at each threshold of significance. (C) Distributions of fold changes of significantly changing bins that are in promoters, gene bodies, origins of replications and everywhere. Note that almost all significantly changing bins in ARSes (250) decrease in accessibility with age. (D) Differences in patterns of changes of accessibility between promoters, gene bodies and origins of replication can’t be explained by average initial accessibility of each genomic location type. We binned each type of genomic locations into bins according to accessibility in Log phase and asked what proportion of bins with this level of accessibility go up in each type of genomic location. Notably, at the same level of accessibility ARSes tend to close the strongest. (E) Closure of ARSes in metabolic cycle. Shown are changes in occupancy similar in transition from RB to OX phase of the metabolic cycle (data from [Gowans et al., 2018]). Similar to (C). (F) Comparisons of aging slopes of genomic bins between mutants.