

Abstract
Benzyl alcohol, a preservative commonly added to multidose therapeutic protein formulations, can accelerate aggregation of recombinant human interleukin-1 receptor antagonist (rhIL-1ra). To investigate the interactions between benzyl alcohol and rhIL-1ra, we used nuclear magnetic resonance to observe the effect of benzyl alcohol on the chemical shifts of amide resonances of rhIL-1ra and to measure hydrogen–deuterium exchange rates of individual rhIL-1ra residues. Addition of 0.9% benzyl alcohol caused significant chemical shifts of amide resonances for residues 90–97, suggesting that these solvent-exposed residues participate in the binding of benzyl alcohol. In contrast, little perturbation of exchange rates was observed in the presence of either sucrose or benzyl alcohol.
Keywords: Protein aggregation, NMR spectroscopy, Protein formulation, Protein structure, Excipients
INTRODUCTION
Antimicrobial preservatives are required to maintain sterility of therapeutic products in multidose formulations and drug delivery devices.1–5 Development of stable formulations of therapeutic proteins that contain antimicrobial agents is greatly complicated, however, by the tendency of proteins to aggregate in the presence of these additives.6–11 Such aggregation can reduce the biological activity of proteins12,13 and, more importantly, impact the safety of the formulation by eliciting immunogenicity in patients.14–16
Benzyl alcohol is one of the most commonly used preservatives in multidose therapeutic protein formulations.17 However, it has been shown to cause aggregation for several proteins, including recombinant human growth hormone,6 recombinant human interferon-γ,7,18 and recombinant human interleukin-1 receptor antagonist (rhIL-1ra).19–21 In earlier studies, no changes in rhIL-1ra secondary structure were observed by infrared (IR) spectroscopy upon addition of 0.9% (w/v) benzyl alcohol to rhIL-1ra solutions.19 However, subtle changes in tertiary structure determined from a decreased near-ultraviolet (UV) Circular Dichroism (CD) signal and increased 8-anilinonaphthalene-1-sulfonic acid (ANS) fluorescence revealed an increase in partially unfolded species within the protein population.19 A small increase (3%) of the a/b ratio,22 calculated from second-derivative UV spectra for rhIL-1ra in the presence of 0.9% (w/v) benzyl alcohol, also indicated greater solvent exposure of aromatic residues.19 Previous IR spectroscopy experiments19 also showed that the hydrogen–deuterium exchange (HX) rate averaged over all exchangeable residues of rhIL-1ra is accelerated at short time spans (<1.5 min) in the presence of 0.9% (w/v) benzyl alcohol at 37°C and pH 6.5. To explain these results, it was suggested that benzyl alcohol binds to rhIL-1ra and shifts the population toward partially unfolded species with increased mobility and greater time-averaged solvent exposure, which in turn lead to greater propensity to aggregate.19
Because the IR technique for measuring HX yields only a “global” rate of exchange averaged over all exchanging residues, it was not possible to use IR-based HX measurements to locate the site where benzyl alcohol might bind to rhIL1-ra. Indeed, an alternate explanation for the increased rates of HX for rhIL1-ra in the presence of benzyl alcohol might be that benzyl alcohol directly accelerates HX by nonspecifically diffusing into the protein, causing an increase in global HX without binding to a specific site.
In the current study, we used nuclear magnetic resonance (NMR) spectroscopy to map chemical shifts in the presence of benzyl alcohol and to measure HX for individual residues of rhIL-1ra in order to identify any specific benzyl alcohol binding site. Measurement of individual residue HX rates by NMR is a well established technique that has been used for several proteins (see Refs. 23–29) and has recently been used to examine the interactions of ANS with rhIL-1ra.30 This allowed us to differentiate between the possibilities of specific binding versus nonspecific partitioning of benzyl alcohol into the structure of IL-1ra. Furthermore, we mapped chemical shifts at two temperatures in order to probe whether the interactions of benzyl alcohol with IL-1ra might be hydrophobic in nature, and to examine whether any potential conformational changes in rhIL-1ra as a function of temperature might affect benzyl alcohol binding.
MATERIALS AND METHODS
Materials
Both 15N-labeled rhIL-1ra and unlabeled rhIL-1ra were produced by and purified (>99%) at Amgen Inc., Thousand Oaks, California. The 15N-labeled rhIL-1ra stock formulation contained 6.6 mg/mL protein in 10 mM sodium acetate buffer (pH 5.2) and 5 mM ethylenediaminetetraacetic acid (EDTA). rhIL-1ra stock solution was maintained at −20°C until needed. The unlabeled rhIL-1ra stock formulation contained 220 mg/mL protein in citrate buffered saline:10 mM sodium citrate buffer (pH 6.5), 140 mM sodium chloride, and 0.5 mM EDTA. All other chemicals were purchased from Sigma (St. Louis, MO) or Fisher Scientific (Waltham, MA) and were of reagent grade or higher quality.
Dialysis and Sample Preparation
Dialysis for buffer exchange from the stock formulation into 10 mM sodium citrate buffer (pH 6.5), 140 mM sodium chloride (“buffer”) was performed against excess solvent (2 × 1L volumes) overnight using Pierce 10000 Da MWCO Slide-A-Lyzer dialysis cassettes (Rockford, IL). Following dialysis, the labeled protein for each experiment was concentrated to a volume of 120 μL (250 mg/mL, 14.5 mM) using two Millipore Centricon® cellulose YM-3 (3000 Da nominal molecular weight limit) centrifugal concentrators (Billerica, MA) for 6–8 h at 7000 rpm (6500 g). Fresh deuterated buffer was prepared for each experiment with the appropriate excipient (sucrose or benzyl alcohol) at a pH meter reading of 6.1, which corresponds to pH 6.5 for nondeuterated buffer (i.e., pD = pH + 0.4).
NMR Spectroscopy
Resonance assignments were confirmed using standard 15N-total correlation spectroscopy (TOCSY) and nuclear Overhauser enhancement spectroscopy (NOESY) experiments performed on 25 mg/mL (1.45 mM) 15N-labeled rhIL-1ra samples in 10 mM sodium citrate buffer, 140 mM sodium chloride at pH 6.5 containing 10% D2O. Spectra were acquired at 25°C and 37°C on a Varian INOVA 500 MHz spectrometer (Santa Clara, CA) equipped with a room temperature HCN pulse (1 H, 13 C, 15 N). The Varian Biopack suite (Santa Clara, CA) of pulse sequences (with minor modifications) was used for data acquisition. All spectra were processed using NMRPipe software (Washington, DC),31 and visualization and analysis were performed using Sparky software (Sanf Francisco, CA).32 Backbone amide resonances were assigned by comparison with previously reported 1H and 15N chemical shifts.33
A two-dimensional 15N heteronuclear single quantum correlation (HSQC) experiment was used to determine 1H and 15N chemical shifts. A three-dimensional (3D) TOCSY–15N-HSQC experiment with a mixing time of 80 ms and a spinlock field of 5800 Hz provided confirmation of Hα, Hβ, and Hγ shifts. A 3D NOESY–15N-HSQC spectrum with a 100 ms mixing time was also collected for further confirmation of proton chemical shifts and sequential connectivities. Spectra were apodized in all dimensions using a cosine-squared window function and then zero filled. Additionally, all indirect dimensions were linear predicted to twice the number of acquired points prior to apodization, and indirect dimensions in 3D experiments were subject to baseline correction. Proton chemical shifts are referenced to water at 4.773 ppm at 25°C and 4.649 ppm at 37°C,34 15N dimensions were indirectly referenced to water as well using NMRPipe (see Ref. 35 for full protocol). Additionally, all experiments used a recycle time of 1.5 s; NOESY spectra used eight transients/FID (Free Induction Decay), whereas TOCSY and HSQC spectra used 16 transients/FID.
The protein primary sequence was obtained from the protein data bank (keyword: 1ILR). Minimum chemical shifts (Δδmin) were calculated using ccpNMR Analysis software (Cambridge, UK) as follows36:
| (1) |
Measurement of HX
Prior to recording data for exchange, the instrument parameters were optimized on a 10% D2O sample prepared at a labeled protein concentration identical to that of the exchange experiment to follow (i.e., 60 μL at 250 mg/mL diluted 10-fold to a final volume of 600 μL with 480 μL nondeuterated buffer and 60 μL deuterated buffer). To initiate exchange, 540 μL of deuterated buffer (with sucrose or benzyl alcohol if required) was added to 60 μL of concentrated labeled protein in H2O for a final labeled protein concentration of 25 mg/mL and final D2O concentration of 90%. The first spectrum of each series was recorded 10 min after the exchange was initiated (data collection required 8.5 min per HSQC spectrum and was started to be centered around each time point). At 25°C, subsequent spectra were recorded at the following times after the exchange was initiated: 10, 20, 30, and 45 min; 1, 1.25, 1.5, 2, 2.5, 3, 4, 5, 6, 8, 10, 12,16, 20, and 24 h; and continuing in 6 h increments up to 90 h. For the sample in buffer alone (no benzyl alcohol or excipients), additional time points were taken as far out as 1 week, but it was determined that the data collected in the first 90 h was sufficient for fitting rate constants as the remainder of the residues exchanged very slowly. At 37°C, subsequent spectra were recorded at 10 min intervals until 2 h after the exchange was initiated. All spectra were processed using a Lorentz-to-Gauss apodization function in both dimensions, and the volumes of the resulting crosspeaks were fit as Gaussians and normalized to the volume of the first time point (10 min) using NMR-Pipe. The volumes were then fit to an exponential decay according to Eq. 2 37 using the CurveFit software (La Jolla, CA)38:
| (2) |
with the initial intensity H0, the baseline C, and the observed exchange rate kobs as the free variables in the fit.
In addition to examining the effect of 0.9% benzyl alcohol on rhIL-1ra, we also tested separate rhIL-1ra samples in the presence of 0.5 M sucrose for comparison with previous results that used IR spectroscopy at 25°C.39 For experiments in the current study, we chose to examine solutions conditions similar to the commercialized formulation buffer and the previous HX data.19,39 Protein solutions in buffer alone (i.e., 10 mM sodium citrate, 140 mM NaCl, pH 6.5) are the reference states for comparing the effects of 0.9% benzyl alcohol and 0.5 M sucrose.
RESULTS
Cross-Peak Assignments
Recombinant human interleukin-1 receptor antagonist peak assignments were obtained from30 and verified independently using 15N-TOCSY and NOESY spectra, and are listed in Table 1. Our observations show a systematic offset of 1.3 ppm in the Nα chemical shift as compared with the previously assigned values,33 most likely due to a difference in referencing protocols, but are otherwise consistent.
Table 1.
Chemical Shift Assignments (ppm) and HX Rates for rhIL-1ra at 25°C in 10 mM Sodium Citrate Buffer, 140 mM Sodium Chloride at pH 6.5 Containing 10% D2O
| Residue | Observed 25°C | Buffer 25°C kobs | 0.9% Benzyl Alcohol 25°C kobs (min−1) | 0.5 M Sucrose 25°C kobs (min−1) | Buffer 37°C kobs | 0.9% Benzyl Alcohol 37°C kobs (min−1) | |
|---|---|---|---|---|---|---|---|
| Na | HN | ||||||
| 11 Met | 119.3 | 8.02 | fast | fast | fast | fast | fast |
| 12 Gin | 124.7 | 9.21 | fast | fast | fast | fast | fast |
| 13 Ala | 126.5 | 8.66 | fast | fast | fast | fast | fast |
| 14 Phe | 123.5 | 9.73 | 2.6E-04 ± 3.E-05 | 3.7E-04 ± 5.E-05 | medium | 2.4E-03 ± 3.E-04 | 2.5E-03 ± 4.E-04 |
| 15 Arg | 119.1 | 9.05 | 1.1E-03 ± 5.E-05 | 1.5E-03 ± 7.E-05 | 1.4E-03 ± 1.E-04 | 2.3E-03 ± 1.E-03 | 1.4E-03 ± 1.E-03 |
| 16 Ile | 120.5 | 9.06 | 3.2E-04 ± 1.E-05 | 2.6E-04 ± 2.E-05 | 3.0E-04 ± 7.E-05 | slow | slow |
| 17 Trp | 124.0 | 8.64 | 8.4E-04 ± 5.E-05 | slow | 4.8E-03 ± 2.E-03 | fast | fast |
| 18 Asp | 120.2 | 9.41 | slow | 3.2E-04 ± 1.E-04 | slow | 6.0E-04 ± 2.E-04 | 6.9E-04 ± 1.E-04 |
| 19 Val | 109.4 | 6.76 | 1.8E-03 ± 6.E-05 | 2.2E-03 ± 8.E-05 | 2.5E-03 ± 1.E-03 | 1.3E-02 ± 2.E-03 | 1.1E-02 ± 1.E-03 |
| 20 Asn | 119.4 | 8.36 | 7.9E-04 ± 3.E-05 | 9.0E-04 ± 4.E-05 | 7.4E-04 ± 6.E-05 | slow | slow |
| 22 Lys | 119.6 | 8.67 | 2.2E-03 ± 4.E-04 | slow | 1.7E-03 ± 3.E-04 | slow | slow |
| 23 Thr | 113.7 | 8.91 | 4.0E-04 ± 4.E-05 | 5.7E-04 ± 6.E-05 | 7.5E-04 ± 1.E-04 | 3.4E-03 ± 5.E-04 | 4.3E-03 ± 5.E-04 |
| 24 Phe | 122.1 | 9.58 | 3.1E-04 ± 2.E-05 | 7.4E-04 ± 3.E-04 | slow | 5.4E-04 ± 4.E-04 | 1.1E-03 ± 3.E-04 |
| 25 Tyr | 116.5 | 9.12 | slow | slow | slow | 1.9E-04 ± 9.E-05 | 4.9E-04 ± 1.E-04 |
| 26 Leu | 120.8 | 9.23 | 1.6E-03 ± 7.E-05 | 1.9E-03 ± 6.E-05 | 2.1E-03 ± 2.E-04 | 2.9E-04 ± 3.E-04 | |
| 27 Arg | 124.2 | 8.90 | 2.6E-03 ± 9.E-05 | 3.4E-03 ± 1.E-04 | 3.2E-03 ± 2.E-04 | 5.2E-02 ± 3.E-03 | medium |
| 30 Gin | 116.9 | 7.66 | 2.1E-02 ± 2.E-04 | 2.4E-02 ± 5.E-04 | 2.5E-02 ± 1.E-03 | medium | medium |
| 31 Leu | 124.7 | 8.83 | 8.6E-02 ± 2.E-02 | 9.5E-02 ± 2.E-02 | 1.3E-01 ± 6.E-02 | fast | fast |
| 32 Val | 125.6 | 9.19 | slow | slow | slow | slow | slow |
| 33 Ala | 118.9 | 7.29 | slow | slow | slow | slow | 1.7E-04 ± 1.E-04 |
| 34 Gly | 113.4 | 9.83 | 3.2E-04 ± 2.E-05 | 3.4E-04 ± 5.E-05 | slow | 6.9E-04 ± 2.E-04 | 5.8E-04 ± 2.E-04 |
| 35 Tyr | 121.3 | 9.26 | fast | fast | fast | slow | 6.8E-04 ± 2.E-04 |
| 36 Leu | 125.2 | 8.65 | slow | slow | slow | ||
| 37 Gin | 119.9 | 8.45 | fast | fast | fast | 8.3E-03 ± 2.E-03 | 6.8E-03 ± 1.E-03 |
| 40 Asn | 114.5 | 7.69 | fast | fast | fast | fast | fast |
| 41 Val | 116.0 | 7.43 | fast | fast | fast | fast | fast |
| 42 Asn | 117.6 | 7.79 | slow | 3.6E-03 ± 1.E-04 | 4.0E-04 ± 6.E-05 | 1.0E-03 ± 3.E-04 | 6.8E-04 ± 3.E-04 |
| 44 Glu | 119.5 | 7.14 | 5.4E-02 ± 6.E-03 | 6.9E-02 ± 3.E-03 | 6.2E-02 ± 4.E-03 | medium | medium |
| 45 Glu | 127.5 | 8.86 | 4.3E-02 ± 5.E-03 | 2.1E-02 ± 1.E-03 | 6.7E-02 ± 7.E-03 | fast | fast |
| 46 Lys | 123.5 | 8.06 | 2.7E-02 ± 3.E-03 | 3.0E-02 ± 1.E-03 | 2.4E-02 ± 6.E-03 | medium | 1.1E-02 ± 1.E-02 |
| 47 Lie | 121.9 | 9.13 | 2.5E-04 ± 2.E-05 | 3.3E-04 ± 6.E-05 | slow | ||
| 48 Asp | 128.7 | 9.31 | slow | 4.1E-04 ± 1.E-04 | slow | 8.5E-04 ± 3.E-04 | 7.5E-04 ± 2.E-04 |
| 49 Val | 120.2 | 8.84 | 3.9E-02 ± 1.E-02 | fast | fast | medium | medium |
| 50 Val | 125.5 | 8.04 | slow | slow | slow | slow | slow |
| 52 Lie | 122.4 | 8.38 | fast | fast | fast | fast | fast |
| 56 Ala | 122.0 | 8.28 | 1.8E-01 ± 3.E-02 | medium | 1.7E-01 ± 5.E-02 | ||
| 57 Leu | 118.3 | 9.30 | 3.1E-04 ± 2.E-05 | slow | slow | 3.8E-04 ± 2.E-04 | 4.3E-04 ± 2.E-04 |
| 59 Leu | 122.2 | 10.46 | slow | 9.2E-04 ± 3.E-04 | slow | slow | slow |
| 60 Gly | 109.9 | 9.33 | slow | 9.2E-04 ± 4.E-04 | slow | slow | slow |
| 62 His | 115.7 | 9.83 | fast | fast | fast | fast | fast |
| 63 Gly | 111.4 | 9.15 | fast | fast | fast | fast | fast |
| 64 Gly | 108.4 | 8.30 | fast | fast | fast | ||
| 65 Lys | 116.2 | 7.25 | fast | fast | fast | 1.3E-03 ± 6.E-04 | slow |
| 66 Met | 116.4 | 7.67 | 1.9E-04 ± 2.E-05 | 2.6E-04 ± 3.E-05 | 4.1E-04 ± 8.E-05 | 2.4E-03 ± 2.E-04 | 1.4E-03 ± 3.E-04 |
| 67 Cys | 117.6 | 9.10 | slow | slow | slow | slow | |
| 68 Leu | 124.9 | 8.08 | slow | slow | slow | slow | |
| 69 Ser | 114.0 | 9.15 | slow | slow | slow | 5.8E-04 ± 2.E-04 | 3.5E-04 ± 1.E-04 |
| 70 Cys | 117.5 | 7.58 | 3.3E-04 ± 9.E-05 | 3.5E-04 ± 3.E-05 | slow | 2.8E-03 ± 5.E-04 | 2.1E-03 ± 3.E-04 |
| 72 Lys | 125.2 | 8.33 | fast | fast | fast | fast | fast |
| 73 Ser | 118.3 | 8.38 | fast | fast | fast | fast | fast |
| 76 Glu | 120.7 | 8.09 | fast | fast | fast | fast | fast |
| 77 Thr | 120.7 | 7.91 | slow | 2.9E-02 ± 7.E-04 | slow | ||
| 78 Arg | 123.2 | 8.51 | fast | fast | fast | slow | slow |
| 79 Leu | 123.5 | 8.64 | fast | fast | fast | medium | medium |
| 80 Gin | 125.8 | 9.35 | slow | slow | slow | ||
| 81 Leu | 121.2 | 8.26 | fast | fast | fast | fast | fast |
| 82 Glu | 122.4 | 9.17 | slow | slow | slow | slow | slow |
| 83 Ala | 128.5 | 8.95 | fast | fast | fast | fast | fast |
| 84 Val | 125.0 | 7.70 | slow | 3.6E-04 ± 7.E-05 | 3.5E-04 ± 1.E-04 | 1.0E-03 ± 2.E-04 | 1.47E-03 ± 1.29E-04 |
| 85 Asn | 120.2 | 8.24 | fast | fast | fast | fast | fast |
| 86 Ile | 128.1 | 9.00 | 1.1E-01 ± 1.E-02 | medium | medium | fast | fast |
| 87 Thr | 108.6 | 7.45 | medium | medium | medium | fast | fast |
| 89 Leu | 120.3 | 6.48 | 4.5E-02 ± 3.E-03 | 5.5E-02 ± 1.E-02 | 2.5E-02 ± 1.E-03 | medium | 9.82E-03 ± 4.83E-03 |
| 90 Ser | 117.1 | 10.02 | fast | fast | fast | fast | fast |
| 91 Glu | 128.3 | 10.03 | fast | fast | fast | medium | medium |
| 92 Asn | 116.3 | 8.22 | fast | fast | fast | fast | fast |
| 93 Arg | 121.1 | 7.40 | fast | fast | fast | fast | fast |
| 96 Asp | 119.9 | 7.65 | fast | fast | fast | ||
| 97 Lys | 122.0 | 7.67 | fast | fast | fast | fast | fast |
| 98 Arg | 112.5 | 7.49 | fast | fast | fast | fast | fast |
| 99 Phe | 120.4 | 7.81 | 3.0E-03 ± 8.E-05 | 3.2E-03 ± 5.E-04 | 2.7E-03 ± 3.E-04 | 2.5E-02 ± 5.E-03 | 1.28E-02 ± 2.80E-03 |
| 101 Phe | 122.8 | 9.54 | slow | slow | slow | slow | 5.12E-04 ± 3.52E-04 |
| 102 Ile | 121.5 | 10.25 | slow | slow | 9.1E-04 ± 1.E-04 | 5.9E-04 ± 5.E-04 | |
| 103 Arg | 130.3 | 9.06 | 3.3E-02 ± 2.E-03 | 2.6E-02 ± 4.E-03 | 4.2E-02 ± 9.E-03 | fast | fast |
| 104 Ser | 121.8 | 8.56 | 5.0E-02 ± 6.E-03 | 6.2E-02 ± 1.E-02 | 8.1E-02 ± 3.E-02 | fast | fast |
| 105 Asp | 124.5 | 8.64 | 4.1E-02 ± 2.E-03 | 4.2E-02 ± 1.E-02 | 4.6E-02 ± 4.E-03 | 1.3E-03 ± 1.E-03 | |
| 106 Ser | 117.1 | 8.51 | fast | fast | fast | medium | medium |
| 109 Thr | 109.2 | 7.58 | 1.9E-01 ± 1.E-02 | medium | 1.5E-01 ± 2.E-02 | fast | fast |
| 110 Thr | 119.5 | 9.72 | 7.6E-04 ± 3.E-05 | 1.2E-03 ± 2.E-04 | 2.4E-03 ± 2.E-04 | 5.3E-03 ± 8.E-04 | 1.56E-02 ± 1.21 E-03 |
| 111 Ser | 120.3 | 8.77 | 1.7E-02 ± 4.E-04 | 2.4E-02 ± 1.E-03 | 2.5E-02 ± 9.E-04 | slow | 9.91E-04 ± 7.38E-04 |
| 112 Phe | 126.4 | 9.26 | medium | medium | medium | slow | 4.05E-04 ± 2.06E-04 |
| 113 Glu | 126.3 | 9.09 | 8.8E-04 ± 8.E-05 | slow | slow | ||
| 114 Ser | 120.4 | 8.90 | 3.1E-04 ± 2.E-05 | slow | 3.4E-04 ± 4.E-05 | 1.9E-03 ± 7.E-04 | slow |
| 115 Ala | 128.0 | 8.19 | 3.3E-03 ± 1.E-03 | 7.0E-04 ± 3.E-04 | 4.0E-03 ± 1.E-03 | 1.2E-03 ± 1.E-03 | slow |
| 119 Gly | 112.9 | 10.41 | 3.3E-02 ± 7.E-03 | 4.1E-02 ± 9.E-03 | 2.8E-02 ± 5.E-03 | medium | medium |
| 121 Phe | 121.4 | 9.47 | slow | slow | slow | 1.5E-02 ± 2.E-03 | 1.35E-02 ± 1.20E-03 |
| 122 Leu | 124.9 | 8.92 | 2.8E-04 ± 7.E-05 | slow | slow | 2.6E-03 ± 3.E-04 | 3.43E-03 ± 3.95E-04 |
| 123 Cys | 120.3 | 9.14 | 8.9E-04 ± 5.E-05 | 3.8E-04 ± 2.E-04 | slow | 4.8E-04 ± 2.E-04 | |
| 124 Thr | 109.4 | 9.17 | 3.7E-04 ± 2.E-05 | 6.5E-04 ± 9.E-05 | 5.9E-04 ± 3.E-05 | 2.1E-03 ± 3.E-04 | 5.44E-03 ± 6.91E-04 |
| 125 Ala | 122.3 | 9.35 | 5.6E-04 ± 3.E-05 | 8.0E-04 ± 7.E-05 | 7.2E-04 ± 3.E-05 | 5.5E-03 ± 1 .E-03 | 6.09E-03 ± 9.60E-04 |
| 126 Met | 117.5 | 8.70 | fast | fast | fast | fast | fast |
| 127 Glu | 119.2 | 7.96 | fast | fast | fast | fast | fast |
| 128 Ala | 123.6 | 8.90 | fast | fast | fast | fast | fast |
| 129 Asp | 114.8 | 8.66 | 3.9E-02 ± 2.E-03 | 3.7E-02 ± 1.E-02 | 4.4E-02 ± 5.E-03 | 5.3E-03 ± 9.E-04 | 6.37E-03 ± 8.66E-04 |
| 130 Gln | 116.9 | 8.63 | 9.2E-04 ± 3.E-05 | 1.1E-03 ± 1.E-04 | 1.2E-03 ± 6.E-05 | fast | fast |
| 132 Val | 127.5 | 8.11 | slow | slow | slow | slow | slow |
| 133 Ser | 124.2 | 9.07 | 9.3E-04 ± 7.E-05 | slow | 3.1E-04 ± 1.E-04 | slow | slow |
| 134 Leu | 117.4 | 8.49 | 4.9E-02 ± 3.E-03 | medium | 6.2E-02 ± 7.E-03 | ||
| 135 Thr | 114.6 | 9.40 | slow | 8.4E-04 ± 2.E-04 | 8.4E-04 2.E-04 | slow | 6.92E-04 ± 1.76E-04 |
| 136 Asn | 127.0 | 7.53 | fast | fast | fast | fast | |
| 137 Met | 119.7 | 8.35 | 1.9E-01 ± 1.E-02 | medium | medium | 5.6E-03 ± 3.E-03 | 6.77E-03 ± 1.14E-03 |
| 139 Asp | 117.7 | 8.48 | fast | fast | fast | fast | fast |
| 140 Glu | 118.8 | 7.56 | fast | fast | fast | fast | fast |
| 141 Gly | 106.7 | 8.15 | fast | fast | fast | fast | fast |
| 142 Val | 116.8 | 7.79 | fast | fast | fast | fast | fast |
| 143 Met | 117.0 | 7.98 | fast | fast | fast | fast | fast |
| 144 Val | 125.2 | 9.62 | 7.2E-04 ± 2.E-05 | 8.1E-04 ± 8.E-05 | 1.1E-03 ± 4.E-05 | 4.9E-03 ± 7.E-04 | 5.32E-03 ± 7.04E-04 |
| 145 Thr | 111.9 | 8.41 | fast | fast | fast | fast | fast |
| 146 Lys | 123.1 | 6.71 | 4.3E-03 ± 1.E-04 | 5.3E-03 ± 2.E-04 | 5.5E-03 ± 2.E-04 | 2.7E-02 ± 2.E-03 | 3.42E-02 ± 3.13E-03 |
| 147 Phe | 117.9 | 8.87 | 1.8E-03 ± 3.E-04 | slow | 2.2E-02 ± 2.E-03 | slow | slow |
| 148 Tyr | 121.6 | 9.49 | 3.2E-04 ± 1.E-04 | slow | 7.6E-04 ± 3.E-04 | 3.2E-04 ± 1.E-04 | 1.20E-03 ± 2.12E-04 |
| 149 Phe | 127.3 | 8.79 | 1.6E-02 ± 6.E-04 | 2.1E-02 ± 2.E-03 | 6.3E-02 ± 9.E-03 | medium | medium |
| 150 Gln | 125.2 | 8.75 | 3.9E-04 ± 2.E-05 | 5.2E-04 ± 7.E-05 | medium | slow | slow |
| 151 Glu | 128.9 | 9.16 | fast | fast | fast | fast | fast |
| 152 Asp | 126.2 | 8.58 | fast | fast | fast | fast | fast |
| 153 Glu | 127.1 | 7.80 | slow | slow | slow | fast | fast |
Values for kobs were fit using Eq. 2 (± standard error).
HX rate constants (kobs) were also measured for rhIL-1ra in buffer alone (“buffer”) and in the presence of 0.9% benzyl alcohol, at both 25°C and 37°C or 0.5M sucrose (at 25°C only).
HX rate constants for residues labeled “fast” indicate cross-peaks that appeared in spectra collected in 10% D2O, but had fully exchanged before the first time point at 10 min following initiation of HX by dilution to 90% D2O.
HX rate constants for residues labeled “medium” exchanged within the duration of the HX experiment, but the level of noise in the data precluded a good fit (i.e., standard error > kobs).
HX rate constants for residues labeled “slow” did not show significant exchange (i.e., less than 10% exchanged) during the 90 h duration of the HX experiment, and noise in the data often did not allow for a good fit (i.e., standard error > kobs).
Chemical Shift Mapping
Figures 1 and 2 display 1H–15N-HSQC spectra obtained at 25°C for rhIL-1ra in the presence of 0.9% benzyl alcohol and 0.5 M sucrose, respectively. The spectra (in red) are overlaid with the spectrum measured in buffer alone (in black) for comparison. Minimum chemical shifts between spectra with and without either 0.9% benzyl alcohol or 0.5 M sucrose were calculated according to Eq. 1 (Materials and Methods) and are displayed graphically in Figure 3. Residues showing the most significant shifts greater than 0.08 ppm (90 Ser, 91 Glu, 93 Arg, 96 Asp, and 97 Lys for shifts resulting from the addition of 0.9% benzyl alcohol; 63 Gly and 64 Gly for shifts resulting from the addition of 0.5 M sucrose) are mapped onto the crystal structure displayed in Figure 4.
Figure 1.

Recombinant human interleukin-1 receptor antagonist 1H–15N-HSQC spectra collected with (red) and without (black) 0.9% benzyl alcohol at 25°C. Buffer in each case contained 10 mM sodium citrate, 140 mM sodium chloride, pH 6.5.
Figure 2.

Recombinant human interleukin-1 receptor antagonist 1H–15N-HSQC spectra collected with (red) and without (black) 0.5 M sucrose at 25°C. Buffer in each case contained 10 mM sodium citrate, 140 mM sodium chloride, pH 6.5.
Figure 3.

Minimum rhIL-1ra chemical shifts for the addition of 0.9% benzyl alcohol (open squares) or 0.5 M sucrose (closed diamonds) to buffer at 25°C, 0.9% benzyl alcohol to buffer at 37° C (open circles). 63 Gly and 64 Gly show significant shifts (i.e., >0.08 ppm) upon addition of 0.5 M sucrose to the buffer. The prominent peak caused upon addition of 0.9% benzyl alcohol is caused by residues 90 Ser, 91 Glu, 93 Arg, 96 Asp, and 97 Lys.
Figure 4.
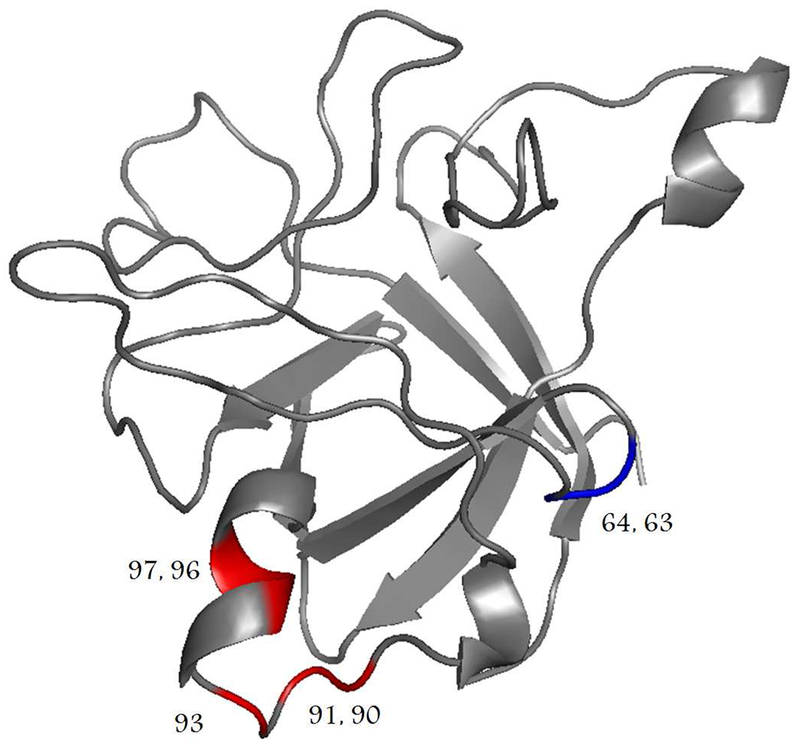
Mapping of chemical shift changes on the structure of rhIL-1ra. Numbers on the crystal structure label residues that shifted significantly (i.e., >0.08 ppm). Residues colored red (90 Ser, 91 Glu, 93 Arg, 96 Asp, and 97 Lys) shifted significantly upon addition of 0.9% benzyl alcohol to buffer at 25°C. Residues colored blue (63 Gly and 64 Gly) shifted significantly upon addition of 0.5 M sucrose to buffer at 25°C. The rhIL-1ra crystal structure was obtained from the protein data bank (keyword: 1ILR) and displayed using Pymol software (Portland, OR).
Because of the dependence of rhIL-1ra structure on temperature,40 spectra were also collected for 2 h at 37°C. Previous studies showed that after 168 h of incubation at 25°C, the extent of aggregation is limited to a few percent even in the presence of benzyl alcohol.40 The rate of rhIL-1ra aggregation is increased at 37°C with respect to the rate at 25°C, especially in the presence of benzyl alcohol.40 However, within the 2-h time frame for these experiments, the extent of rhIL-1ra aggregation was negligible. In the absence of benzyl alcohol, nearly all the cross-peaks shifted when the temperature was increased from 25°C to 37°C (Fig. 5), with residues 62 His, 63 Gly, and 64 Gly exhibiting the greatest shifts (Fig. 6).
Figure 5.

Recombinant human interleukin-1 receptor antagonist 1H–15N-HSQC spectra collected at 25°C (black) and 37°C (red). Buffer in each case contained 10 mM sodium citrate, 140 mM sodium chloride, pH 6.5.
Figure 6.

Minimum rhIL-1ra chemical shifts caused by increasing temperature from 25°C to 37°C. Closed squares represent rhIL-1ra chemical shifts observed in buffer alone. Open circles represent the effect of the temperature change on chemical shifts for rhIL-1ra residues in buffer plus 0.9% benzyl alcohol. In both cases, 62 His, 63 Gly, and 64 Gly exhibit the greatest temperature-induced shifts.
At both 25°C and 37°C, the largest chemical shifts that are observed upon addition of 0.9% benzyl alcohol occur at residues 90 Ser, 91 Glu, 93 Arg, and 97 Lys. These shifts are nearly identical in magnitude at the two temperatures. The minimum chemical shifts for all rhIL-1ra residues at 37°C upon addition of 0.9% benzyl alcohol to buffer are mapped onto the crystal structure in Figure 7. The residues showing the largest shifts cluster on a single area on the protein’s surface, whereas the residues located in the protein interior exhibit smaller shifts. The overall lack of chemical shift change suggests that benzyl alcohol does not introduce a large conformation change in rhIL-1ra. Thus, we used HX to determine whether the addition of benzyl alcohol impacted the dynamic properties of the protein.
Figure 7.

Minimum rhIL-1ra chemical shifts at 37°C upon addition of 0.9% benzyl alcohol to buffer, calculated using Eq. 4. Red residues, minimum chemical shifts greater than 0.1 ppm; orange residues, minimum chemical shifts between 0.06 and 0.1 ppm; yellow residues, minimum chemical shifts between 0.03 and 0.06 ppm,; white residues, minimum chemical shifts less than 0.03 ppm; and black residues, unassigned.
HX Measurements
To allow for comparison with previous IR-based measurements of HX,19 which showed that overall HX at short times (<1.5 min) is accelerated by benzyl alcohol and inhibited by the addition of sucrose. Global and individual HX rates were measured by NMR, by dilution of a protonated sample into D2O-containing buffer and rapid collection of 1H–15N-HSQC spectra. Global exchange rates for rhIL-1ra were calculated from the sum of all quantifiable 1H–15N-HSQC crosspeak volumes and are presented in Figure 8. The data were collected at 25°C over 90 h, and the peak intensities were normalized to the integrated intensity of the first spectrum, which was recorded at 10 min after the exchange was initiated. At 25°C, global HX of rhIL-1ra was inhibited by the addition of 0.5 M sucrose in comparison with HX in buffer alone. Addition of 0.9% benzyl alcohol to rhIL-1ra resulted in only minor differences in the overall HX rate at 25°C as compared with the exchange in buffer alone. These NMR data, recorded at times starting at 10 min after the HX was initiated, are consistent with IR spectroscopic measurements for global HX at 25°C.19
Figure 8.

Global HX for rhIL-1ra at 25°C from the sum of all observed 1H–15N-HSQC cross-peaks as a function of the remaining peak volume (intensity). The peak intensities were normalized to the first recorded spectra at 10 min after the exchange was initiated. Open circles, rhIL-1ra in buffer only (10 mM sodium citrate, 140 mM sodium chloride, pH 6.5); closed squares, rhIL-1ra in buffer with 0.5 M sucrose; and triangles, rhIL-1ra in buffer with 0.9% benzyl alcohol. Each series displays the HX from one experiment at each solution condition.
Hydrogen–deuterium exchange rate constants for individual residues were analyzed. The residues were grouped into three classes: those fully exchanged before the first time point (fast), those exchanging during the 90-h course of the experiment (medium), and those that were exchanged less than 10% over the course of the experiment (slow). Rate constants were obtained for medium exchangers by fitting the decay in cross-peak volume over time with Eq. 2. Predictably, the fastest exchanging residues (Fig. 9) are all located on the protein surface [confirmed by NAC-CESS (http://wolf.bms.umist.ac.uk/naccess) with an H2Ovolume of 1.4Å3], whereas residues in the protein core exchange more slowly. Only minor perturbations in HX exchange properties were noted in the presence of the excipients tested. The classification (slow, medium, or fast) for each residue did not change in the presence of 0.9% benzyl alcohol or 0.5 M sucrose as compared with the sample containing buffer alone, although some of the residues with medium rate constants did show statistically significant changes between these three solution conditions (see Table 1). These data suggest that neither benzyl alcohol nor sucrose greatly change the slow and medium timescale dynamics of rhIL-1ra. All residues that exhibited particularly large chemical shifts in the presence of benzyl alcohol (residues 90, 91, 93, 96, and 97) were “fast” exchangers, as is typical for solvent-exposed sites.
Figure 9.

Hydrogen–deuterium exchange rate constants (kobs) for individual rhIL-1ra residues at 37°C. Residues colored red were fully exchanged before the first data point at 10 min, residues colored orange were exchanged during the 10–120 min observation time, and yellow residues did not appreciably exchange (i.e., <10%) during the 10–120 min observation time. Unassigned residues are colored black.
The normalized rhIL-1ra global exchange rate is not affected by the addition of 0.9% benzyl alcohol (Fig. 8). Furthermore, none of the observed rate constants for individual residues measured at 37°C changed classification (e.g., from medium to fast) upon addition of 0.9% benzyl alcohol (see Table 1). Also, there were no changes in classification when rate constants measured at 25°C and 37°C in the absence of benzyl alcohol were compared (data not shown). Rate constants for individual residues at 37°C were fit using Eq. 2 and classified according to the same criteria used for the data at 25°C, and are listed in Table 1.
In the NMR measurement of HX at both 25° C and 37° C, many cross-peaks had already disappeared (i.e., dropped below the minimum contour level) by the first time point at 10 min after the exchange was initiated. The presence of benzyl alcohol has little effect on the intensities of the remaining cross-peaks (data not shown). Likewise, there were no significant differences between the remaining cross-peak intensities observed in the presence or absence of benzyl alcohol after 120 min of HX exchange (data not shown), indicating similar exchange rates for these slower exchanging residues in both solution conditions.
On the basis of these observations from NMR experiments, any changes to HX caused by addition of benzyl alcohol must affect only rapidly exchanging residues within the first 10 min after initiation of the exchange. This is consistent with the previously reported global HX rates measured by IR, where the most significant changes to rhIL-1ra HX at 37°C due to addition of benzyl occurred even before the first recorded IR measurement at 2 min.19
DISCUSSION
The significant chemical shift changes observed for rhIL-1ra residues 90–97 in the presence of benzyl alcohol (Fig. 7) are due to the changes in the local chemical environment of these residues, and suggest that this region forms the benzyl alcohol binding site for rhIL-1ra. Previous isothermal titration calorimetry experiments suggested weak hydrophobic binding of benzyl alcohol to rhIL-1ra.19 To examine the relative hydrophobicity of 90–97 region, a hydrophobicity plot for rhIL-1ra (Fig. 10) was generated on the Kyte–Doolittle scale.41 On this scale, values greater than zero represent hydrophobic regions, whereas values less than zero represent hydrophilic regions. Notably, residues 90 Ser, 91 Glu, 93 Arg, 96 Asp, and 97 Lys have the most negative values, indicating the hydrophilic nature of this region of the protein. The other residues of interest based on minimum shift analysis (62 His, 63 Gly, and 64 Gly) are clustered close to zero on the plot in Figure 10, indicating that they are not significantly hydrophobic or hydrophilic. Cation–π interactions involving 94 Lys and 97 Lys have been proposed as a potential contact site for reversible rhIL-1ra dimerization,42,43 and further irreversible aggregation.44 Notably, site-directed mutagenesis replacing 94 Lys with alanine significantly reduced aggregation.42 It is possible that benzyl alcohol is binding by the same cation–π interactions instead of by hydrophobic interactions as was previously proposed.19 Additional support for this point of view is provided by recent NMR studies of the interactions of ANS with rhIL-1ra,30 wherein ANS was shown to bind in the region of 90 Ser, 93 Arg, and 95 Gln.
Figure 10.

A hydrophobicity plot for rhIL-1ra generated on the Kyte–Doolittle scale (http://expasy.org/cgi-bin/protscale.pl) with a window size of seven, using a linear weight variation model. On this scale, values greater than zero represent hydrophobic regions and values less than zero represent hydrophilic regions.
At 37°C, benzyl alcohol-induced aggregation is much more rapid than at 25°C.40 Increasing the temperature from 25°C to 37°C in the absence of benzyl alcohol perturbed the observed chemical shifts, especially at residues 62 His, 63 Gly, and 64 Gly. But chemical shift perturbations observed upon addition of benzyl alcohol occurred predominately at the same residues and were essentially identical at both temperatures. This suggests that the temperature change did not create or remove benzyl alcohol binding sites. A similar observation was made for ANS binding to rhIL-1ra at 25°C and 37°C.30
Addition of sucrose partially inhibits the increases in rhIL-1ra aggregation observed when the temperature is raised from 25°C to 37°C.45 Interestingly, addition of sucrose results in substantial chemical shift changes at the same location (at residues 62 His, 63 Gly, and 64 Gly) that is most affected by temperature.
At the pH of interest, HX of solvent-exposed residues such as 90–97 occur too quickly (i.e., within 10 min of initiating the exchange) to be observed by the type of NMR measurements used in this study. However, the consistency in exchange rates at medium and slow timescales for all residues in the presence and absence of benzyl alcohol (e.g., slowly exchanging residues are slow in both conditions) indicates that the increased aggregation rates seen in the presence of benzyl alcohol cannot be explained by benzyl-induced increases in medium and slow dynamic processes occurring within the protein interior. This conclusion, coupled with the strongly localized chemical shift effects caused by addition of benzyl alcohol, supports the hypothesis that benzyl alcohol is binding to a specific surface region rather than diffusing nonspecifically into the protein.
The effect of addition of 1 M sucrose on the HX rate of rhIL-1ra in 10 mM sodium citrate, 140 mM sodium chloride at 25°C was measured previously using IR spectroscopy.39 The authors observed that the addition of sucrose inhibited the HX rate at short times (<1.5 min), which was attributed to preferential exclusion of the sugar from the protein’s surface, but little difference in the rate of HX was observed for longer times. Our global HX results (which are obtained for times longer than 10 min) show only slight decreases in HX rates upon addition of sucrose (Fig. 8), consistent with the earlier work.
CONCLUSIONS
Recent HX studies with interferon-γ18 and recombinant human granulocyte colony-stimulating factor45 revealed that benzyl alcohol causes only minor perturbations to the protein’s structure, whereas the protein core is largely unaffected. These limited structural perturbations are sufficient to populate partially unfolded species prone to irreversible aggregation. Our rhIL-1ra results show that benzyl alcohol binds to the protein’s surface, but does not induce global conformational destabilization or result in increased tendency to populate completely unfolded states, which would be manifest in greatly increased rates of HX. Thus, the increased rates of aggregation of rhIL-1ra seen in the presence of benzyl alcohol are likely the result of increased populations of only partially and conformationally perturbed species that are prone to irreversible aggregation, a conclusion that is consistent with the previous study of benzyl alcohol effects on rhIL-1ra aggregation.19
ACKNOWLEDGMENTS
This research was supported by NSF (National Science Foundation) grant number BES-0138595 and NIH NIBIB (National Institutes of Health) (National Institute of Biomedical Imaging and Bioengineering) grant number 1 R01 EB006006-01. 15N-labeled rhIL-1ra was a donation from Amgen, Inc., Thousand Oaks, California.
REFERENCES
- 1.Tan EL, Shah HS, Leister KJ, Kozick LM, Pasciak P, Vanderlaan RK, Yu CD, Patel B. 1993. Transforming growth factor-alpha (TGF-alpha) in a semisolid dosage form: Preservative and vehicle selection. Pharm Res 10(8):1238–1242. [DOI] [PubMed] [Google Scholar]
- 2.Batorova A, Martinowitz U. 2002. Continuous infusion of coagulation factors. Haemophilia 8(3):170–177. [DOI] [PubMed] [Google Scholar]
- 3.Belgaumi AF, Patrick CC, Deitcher SR. 1999. Stability and sterility of a recombinant factor VIII concentrate prepared for continuous infusion administration. Am J Hematol 62(1):13–18. [DOI] [PubMed] [Google Scholar]
- 4.Jorgensen JT, Mortensen HB, Jorgensen JOL. 1991. Patient acceptance of Nordiject: A new drug delivery system for growth-hormone. DICP 25(6):585–588. [DOI] [PubMed] [Google Scholar]
- 5.Akers MJ, Boand AV, Binkley DA. 1984. Preformulation method for parenteral preservative efficacy evaluation. J Pharm Sci 73(7):903–905. [DOI] [PubMed] [Google Scholar]
- 6.Maa YF, Hsu CC. 1996. Aggregation of recombinant human growth hormone induced by phenolic compounds. Int J Pharm 140(2):155–168. [Google Scholar]
- 7.Lam XM, Patapoff TW, Nguyen TH. 1997. The effect of benzyl alcohol on recombinant human interferon-gamma. Pharm Res 14(6):725–729. [DOI] [PubMed] [Google Scholar]
- 8.Gupta S, Kaisheva E. 2003. Development of a multidose formulation for a humanized monoclonal antibody using experimental design techniques. AAPS PharmSci 5(2):E8. [DOI] [PMC free article] [PubMed] [Google Scholar]
- 9.Rodrigues-Silva R, Antunes GF, Velarde DT, Santoro MM. 1999. Thermal stability studies of hyperimmune horse antivenoms. Toxicon 37(1):33–45. [DOI] [PubMed] [Google Scholar]
- 10.Remmele RL, Nightlinger NS, Srinivasan S, Gombotz WR. 1998. Interleukin-1 receptor (IL-1R) liquid formulation development using differential scanning calorimetry. Pharm Res 15(2):200–208. [DOI] [PubMed] [Google Scholar]
- 11.Fransson J, Hallen D, FlorinRobertsson E. 1997. Solvent effects on the solubility and physical stability of human insulin-like growth factor I. Pharm Res 14(5):606–612. [DOI] [PubMed] [Google Scholar]
- 12.Runkel L, Meier W, Pepinsky RB, Karpusas M, Whitty A, Kimball K, Brickelmaier M, Muldowney C, Jones W, Goelz SE. 1998. Structural and functional differences between glycosylated and nonglycosylated forms of human interferon-beta (IFN-beta). Pharm Res 15(4):641–649. [DOI] [PubMed] [Google Scholar]
- 13.Townsend MW, Deluca PP. 1990. Stability of ribonuclease A in solution and the freeze-dried state. J Pharm Sci 79(12):1083–1086. [DOI] [PubMed] [Google Scholar]
- 14.Schellekens H 2002. Immunogenicity of therapeutic proteins: Clinical implications and future prospects. Clin Ther 24(11):1720–1740. [DOI] [PubMed] [Google Scholar]
- 15.Schellekens H 2002. Bioequivalence and the immunogenicity of biopharmaceuticals. Nat Rev Drug Discov 1(6):457–462. [DOI] [PubMed] [Google Scholar]
- 16.Yon JM. 1996. The specificity of protein aggregation. Nat Biotechnol 14(10):1231–1231. [DOI] [PubMed] [Google Scholar]
- 17.Nair B 2001. Final report on the safety assessment of benzyl alcohol, benzoic acid, and sodium benzoate. Int J Toxicol 20:23–50. [DOI] [PubMed] [Google Scholar]
- 18.Tobler SA, Holmes BW, Cromwell ME, Fernandez EJ. 2004. Benzyl alcohol-induced destabilization of interferon-gamma: A study by hydrogen–deuterium isotope exchange. J Pharm Sci 93(6):1605–1617. [DOI] [PubMed] [Google Scholar]
- 19.Zhang Y, Roy S, Jones LS, Krishnan S, Kerwin BA, Chang BS, Manning MC, Randolph TW, Carpenter JF. 2004. Mechanism for benzyl alcohol-induced aggregation of recombinant human interleukin-1 receptor antagonist in aqueous solution. J Pharm Sci 93(12):3076–3089. [DOI] [PubMed] [Google Scholar]
- 20.Roy S, Jung R, Kerwin BA, Randolph TW, Carpenter JF. 2005. Effects of benzyl alcohol on aggregation of recombinant human interleukin-1-receptor antagonist in reconstituted lyophilized formulations. J Pharm Sci 94(2):382–396. [DOI] [PubMed] [Google Scholar]
- 21.Chi EY, Kendrick BS, Carpenter JF, Randolph TW. 2005. Population balance modeling of aggregation kinetics of recombinant human interleukin-1 receptor antagonist. J Pharm Sci 94(12):2735–2748. [DOI] [PubMed] [Google Scholar]
- 22.Ragone R, Colonna G, Balestrieri C, Servillo L, Irace G. 1984. Determination of tyrosine exposure in proteins by second-derivative spectroscopy. Biochemistry 23(8):1871–1875. [DOI] [PubMed] [Google Scholar]
- 23.Liu K, Cho HS, Hoyt DW, Nguyen TN, Olds P, Kelly JW, Wemmer DE. 2000. Deuterium-proton exchange on the native wild-type transthyretin tetramer identifies the stable core of the individual subunits and indicates mobility at the subunit interface. J Mol Biol 303(4):555–565. [DOI] [PubMed] [Google Scholar]
- 24.Olofsson A, Ippel JH, Wijmenga SS, Lundgren E, Ohman A. 2004. Probing solvent accessibility of transthyretin amyloid by solution NMR spectroscopy. J Biol Chem 279(7):5699–5707. [DOI] [PubMed] [Google Scholar]
- 25.Ippel JH, Olofsson A, Schleucher J, Lundgren E, Wijmenga SS. 2002. Probing solvent accessibility of amyloid fibrils by solution NMR spectroscopy. Proc Natl Acad Sci U S A 99(13):8648–8653. [DOI] [PMC free article] [PubMed] [Google Scholar]
- 26.Olofsson A, Sauer-Eriksson AE, Ohman A. 2006. The solvent protection of alzheimer amyloid-beta-(1-42) fibrils as determined by solution NMR spectroscopy. J Biol Chem 281(1):477–483. [DOI] [PubMed] [Google Scholar]
- 27.Whittemore NA, Mishra R, Kheterpal I, Williams AD, Wetzel R, Serpersu EH. 2005. Hydrogen–deuterium (H/D) exchange mapping of Abeta 1-40 amyloid fibril secondary structure using nuclear magnetic resonance spectroscopy. Biochemistry 44(11):4434–4441. [DOI] [PubMed] [Google Scholar]
- 28.Yamaguchi KI, Katou H, Hoshino M, Hasegawa K, Naiki H, Goto Y. 2004. Core and heterogeneity of beta2-microglobulin amyloid fibrils as revealed by H/D exchange. J Mol Biol 338(3):559–571. [DOI] [PubMed] [Google Scholar]
- 29.Hoshino M, Katou H, Hagihara Y, Hasegawa K, Naiki H, Goto Y. 2002. Mapping the core of the beta(2)-microglobulin amyloid fibril by H/D exchange. Nat Struct Biol 9(5):332–336. [DOI] [PubMed] [Google Scholar]
- 30.Latypov RF, Liu D, Gunasekaran K, Harvey TS, Razinkov VI, Raibekas AA. 2008. Structural and thermodynamic effects of ANS binding to human interleukin-1 receptor antagonist. Protein Sci 17(4):652–663. [DOI] [PMC free article] [PubMed] [Google Scholar]
- 31.Delaglio F, Grzesiek S, Vuister GW, Zhu G, Pfeifer J, Bax A. 1995. NMRPipe: A multidimensional spectral processing system based on UNIX pipes. J Biomol NMR 6(3):277–293. [DOI] [PubMed] [Google Scholar]
- 32.Goddard TD, Kneller DG. 1977. Sparky 3: NMR assignment and integration software. San Franciso: University of California. [Google Scholar]
- 33.Stockman BJ, Scahill TA, Roy M, Ulrich EL, Strakalaitis NA, Brunner DP, Yem AW, Deibel MR Jr. 1992. Secondary structure and topology of interleukin-1 receptor antagonist protein determined by heteronuclear three-dimensional NMR spectroscopy. Biochemistry 31(23):5237–5245. [DOI] [PubMed] [Google Scholar]
- 34.Orbons LPM, van derMarel GA, van Boom JH, Altona C. 1987. An NMR study of polymorphous behaviour of the mismatched DNA octamer d(m5C-G-m5C-G-A-G-m5C-G) in solution. Eur J Biochem 170:225–239. [DOI] [PubMed] [Google Scholar]
- 35.Markley JL, Bax A, Arata Y, Hilbers CW, Kaptein R, Sykes BD, Wright PE, W¨thrich K. 1998. Recommendations for the presentation of NMR structures of proteins and nucleic acids. J Mol Biol 280(5):933–952. [DOI] [PubMed] [Google Scholar]
- 36.Farmer BT II, Constantine KL, Goldfarb V, Friedrichs MS, Wittekind M, Yanchunas J Jr., Robertson JG, Mueller L. 1996. Localizing the NADP+ binding site on the MurB enzyme by NMR. Nat Struct Biol 3(12):995–997. [DOI] [PubMed] [Google Scholar]
- 37.Bai YW, Milne JS, Mayne L, Englander SW. 1993. Primary structure effects on peptide group hydrogen exchange. Proteins 17(1):75–86. [DOI] [PMC free article] [PubMed] [Google Scholar]
- 38.Palmer AG, Rance M, Wright PE. 1991. Intramolecular motions of a zinc finger DNA-binding domain from Xfin characterized by proton-detected natural abundance carbon-12 heteronuclear NMR spectroscopy. J Am Chem Soc 113(12):4371–4380. [Google Scholar]
- 39.Kendrick BS, Chang BS, Arakawa T, Peterson B, Randolph TW, Manning MC, Carpenter JF. 1997. Preferential exclusion of sucrose from recombinant interleukin- 1 receptor antagonist: Role in restricted conformational mobility and compaction of native state. Proc Natl Acad Sci U S A 94(22):11917–11922. [DOI] [PMC free article] [PubMed] [Google Scholar]
- 40.Roy S, Katayama D, Dong A, Kerwin BA, Randolph TW, Carpenter JF. 2006. Temperature dependence of benzyl alcohol- and 8-anilinonaphthalene-1-sulfonate-induced aggregation of recombinant human interleukin-1 receptor antagonist. Biochemistry 45(12):3898–3911. [DOI] [PubMed] [Google Scholar]
- 41.Kyte J, Doolittle RF. 1982. A simple method for displaying the hydropathic character of a protein. J Mol Biol 157(1):105–132. [DOI] [PubMed] [Google Scholar]
- 42.Raibekas AA, Bures EJ, Siska CC, Kohno T, Latypov RF, Kerwin BA. 2005. Anion binding and controlled aggregation of human interleukin-1 receptor antagonist. Biochemistry 44(29):9871–9879. [DOI] [PubMed] [Google Scholar]
- 43.Alford JR, Kwok SC, Roberts JN, Wuttke DS, Kendrick BS, Carpenter JF, Randolph TW. 2008. High concentration formulations of recombinant human interleukin-1 receptor antagonist: I. Physical characterization. J Pharm Sci 97(8):3035–3050. [DOI] [PMC free article] [PubMed] [Google Scholar]
- 44.Alford JR, Kendrick BS, Carpenter JF, Randolph TW. 2007. High concentration formulations of recombinant human interleukin-1 receptor antagonist: II. Aggregation kinetics. J Pharm Sci 97(8):3005–3021. [DOI] [PubMed] [Google Scholar]
- 45.Thirumangalathu R, Krishnan S, Brems DN, Randolph TW, Carpenter JF. 2006. Effects of pH, temperature, and sucrose on benzyl alcohol-induced aggregation of recombinant human granulocyte colony stimulating factor. J Pharm Sci 95(7):1480–1497. [DOI] [PubMed] [Google Scholar]