

Abstract
We report on the quantitative proteomic analysis of single mammalian cells. Fluorescence-activated cell sorting was employed to deposit cells into a newly developed nano-droplet sample processing chip, after which samples were analyzed by ultrasensitive nanoLC-MS. An average of circa 670 protein groups were confidently identified from single HeLa cells, which is a far greater level of proteome coverage for single cells than has been previously reported. We demonstrate that the single-cell proteomics platform can be used to differentiate cell types from enzyme-dissociated human lung primary cells and identify specific protein markers for epithelial and mesenchymal cells.
Keywords: cell typing, droplets, microfluidics, single-cell proteomics, ultrasensitive LC-MS
By directly identifying and quantifying the functional drivers of both normal and disease physiology, proteomic techniques can be used to evaluate drug treatments, discover biomarkers, and develop a deep, systems-level understanding of biological processes.[1,2] Extending proteomic analyses to single mammalian cells should inform on the tissue microenvironment,[3] cell signaling,[4] tumor microheterogeneity,[5] embryogenesis, and rare cells such as circulating tumor cells.[6] Unfortunately, sensitivity limitations of mass spectrometry (MS)-based methods have resulted in minimum sample requirements of thousands to millions of cells for in-depth global proteome profiling.
Substantial efforts have been devoted to extending proteomic analyses to much smaller samples by reducing analyte losses during sample preparation, separation, ionization, and MS.[7,8] For example, advances in MS instrumentation, including nanoelectrospray ionization, ion optics and high-field mass analyzers have resulted in low-zeptomole detection limits that are sufficient to analyze many proteins at the single-cell level.[9–11] While further analytical advances will provide additional benefit to nanoscale sample analysis, the main bottleneck is now the inefficient isolation and preparation of trace samples. Adsorptive losses of proteins and peptides to the surfaces of reaction vessels become prohibitive for ultra-small samples when conventional pipetting and sample containers (for example, glass vials or microcentrifuge tubes) are employed. As such, strategies to minimize surface exposure through, for example, the use of low-binding tubes, minimizing reaction volumes, and reducing the number of sample transfer steps have substantially reduced sample losses and increased sensitivity. In addition, filter-aided sample preparation[12] and immobilized digestion protocols[13,14] can increase digestion efficiency and enhance sensitivity. Using such methods, 600–1500 proteins have been identified from samples comprising 100 to 2000 mammalian cells.[12,13,15,16] In-depth proteomic analyses have also been achieved for large cells such as Xenopus laevis oocytes,[17] blastomeres from X. laevis embryos,[18] and single muscle fibers,[19] which usually contain microgram amounts of protein.
To further increase sample processing efficiency with the ultimate aim of analyzing single cells, we recently developed a microfluidics-based approach termed nanoPOTS (nano-droplet processing in one-pot for trace samples).[20] Briefly, nanoPOTS uses robotic nanoliter liquid handling to dispense cells and reagents into photolithographically patterned nano-wells, and all processing steps take place in a single-pot workflow. The total processing volume following addition of cell suspension, MS-compatible surfactant, reducing agent, alkylating agent, and multiple proteases is circa 200 nL, and the surface area of each nanowell is just 0.8 mm2, which greatly minimizes adsorptive losses to the reaction vessel surfaces relative to other processing strategies. We have shown that, in combination with ultrasensitive nanoLC-MS, over 3000 proteins could be confidently identified from as few as 10 HeLa cells.[20] We also used nanoPOTS to prepare and analyze thin sections of single pancreatic islets that were isolated by laser microdissection from both non-diabetic and diabetic donor tissues. An average of more than 2500 proteins were identified from each islet section, and significant differences in protein expression between the two sample types were found using label-free quantification.
In this work, we have interfaced the nanoPOTS platform with fluorescence-activated cell sorting (FACS) and evaluated the potential of nanoPOTS for the analysis of proteins within single mammalian cells containing only circa 0.15 ng of total protein.[21] Coupling to FACS extends the nanoPOTS workflow in three important ways. First, it enables precise numbers of cells to be loaded into each nanowell, whereas dispensing a fixed volume from cell suspension requires careful tuning of the cell concentration and results in stochastic variation in the number of cells per well. Second, FACS substantially dilutes the cell suspension in phosphate-buffered saline (PBS) solution prior to sorting, which greatly reduces background contamination that can arise from secreted proteins and lysed cells. Such background contamination was found to be minor in our previous work for samples comprising 10 or more cells,[20] but this was a concern for further reducing the sample size. Finally, FACS serves as an important “front end” for biochemical analyses, enabling cell-type-specific or rare-cell isolation from mixed populations based on fluorescence or light scattering properties.
A schematic of FACS–nanoPOTS coupling is shown in Figure 1a. The nanoPOTS chip was fabricated on a 25 × 75 mm glass microscope slide,[20] which can be mounted on the corresponding adapter of the FACS system. The nanowell array comprised hydrophilic glass pedestals on a hydrophobic patterned surface. The open structure of the nanoPOTS chip allowed the direct deposition of cell-containing droplets from FACS. Cultured mammalian cells or homogenized primary cells from lung tissue were loaded into the FACS system and sorted into nanowells based on fluorescence intensities or cell sizes. Using fluorescently labeled HeLa cells as a demonstration, zero, one, three, or six cells can be precisely collected into nanowells (Figure 1b). Collection of 21 single cells to populate the nanoPOTS chip array was demonstrated with a collection efficiency of 100% (Supporting Information, Figure S1). After proteomic processing in nanoliter volumes, the cell digests were analyzed using nanoLC-MS with a 30-μm-i.d. LC column operating at a flow rate of 60 nLmin−1 and an Orbitrap Fusion Lumos mass spectrometer.[10] In addition to single cells, samples comprising 20 cells were also collected, which served as a library for transfer of identifications using MaxQuantQs Match Between Runs (MBR) algorithm.[22] Label-free quantification was employed to assess protein expression levels among single cells.
Figure 1.
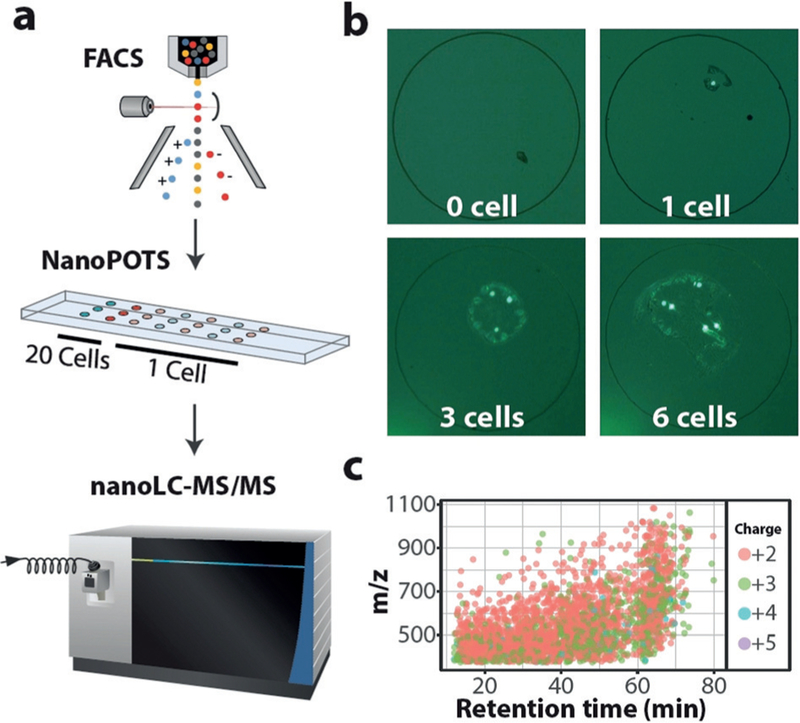
a) Cells are FACS-sorted into nanowells. Cells are lysed and proteins are extracted, denatured, reduced, alkylated, and finally digested into peptides in the nanoPOTS chip. Peptides are separated and sequenced with ultrasensitive nanoLC-MS. b) Fluorescence micro-graphs show the precise collection of defined numbers of HeLa cells in nanowells. Nanowell diameters are 1 mm. c) Representative plot showing 2825 peptides identified from a single HeLa cell.
We first analyzed cultured HeLa cells to evaluate the sensitivity and proteome coverage of the single cell proteomics platform. Samples containing blank (0 cell), 1 cell, 3 cells, and 6 cells (Figure 1b) were processed and analyzed. Only 38 unique peptides corresponding to 18 proteins were identified from the blank samples, demonstrating the FACS-based cell isolation approach can substantially minimize protein contamination from the cell suspension. For cell-containing samples, nearly linear increases in peptide and protein identifications were observed (Figure 2a,b), indicating that overall platform sensitivity dominated proteome coverage (rather than MS sequencing speed).[10] The average MS/MS- based peptide identifications were 792, 1637, and 2297, resulting in protein group identifications of 211, 403, and 568, for triplicate analyses of 1, 3, and 6 cells, respectively. We next employed the MaxQuant MBR algorithm, in which unsequenced peptides were identified based on accurate masses and LC retention times. MBR significantly increased sensitivity and proteome coverage; average protein identifications increased to 669, 889, and 1153 for 1, 3, and 6 cells, respectively (Figure 2b). Given that single HeLa cells contain circa 0.15 ng of total protein,[21] we are able to for the first time confidently detect hundreds to over 1000 proteins from samples comprising subnanogram amounts of protein.
Figure 2.
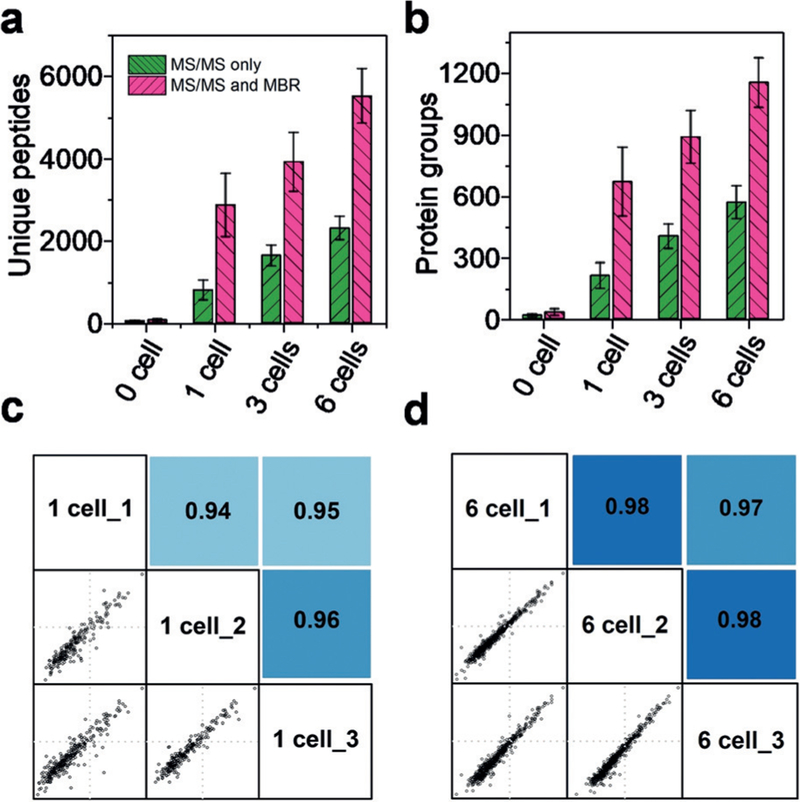
a) Number of unique peptides and b) protein groups identified from triplicate analysis of 0 (blank), 1, 3, and 6 cells based on MS/MS only and MS/MS with MBR. Pairwise correlation of log10-transformed protein LFQ intensities between c) 1 and d) 6 cell samples. Pearson correlation coefficients were labeled with color coded background.
We next evaluated whether the identified proteins were quantifiable using label-free quantification. The MS1 peak intensities of peptides were summed to generate protein intensities, and were then normalized based on the maxLFQ algorithm of MaxQuant.[23] For the single-cell group, after filtering to contain at least two valid LFQ values out of three total samples, 332 proteins were found to be quantifiable. Pairwise analysis of any two single cell samples indicated Pearson correlation coefficients ranging from 0.94 and 0.96 (Figure 2c). The relatively low correlations were mainly the result of technical variability, as similar coefficients of variation (CVs) were observed between diluted HeLa digest samples (0.5 ng total protein, median value, 14%) and single HeLa cells (median value, 17%) (Supporting Information, Figure S2). For the six-cell loadings, 716 proteins were quantifiable and higher correlation with CV ≥.97 were observed (Figure 2d). Protein intensities spanning 3 and 4 orders of magnitude were observed for 1- and 6-cell samples, respectively, indicating that large dynamic ranges were achieved for the ultra-sensitive proteomic analyses. These results suggest that label-free quantification can be used to assess protein expression differences among single cells.
We evaluated the feasibility of our label-free single cell proteomics platform to differentiate human cell types from a clinical specimen based on proteome expression. Primary human lung epithelial and mesenchymal cells were isolated by the LungMAP Human Tissue Core (see Experimental Section). Cryopreserved lung epithelial and mesenchymal cells were FACS-sorted into nanowells at a count of either one cell per well or 20 cells per well. For each cell type, three single-cell samples and three 20-cell samples were analyzed. The 20-cell samples served as a reference sample for the smaller single-cell samples to enhance protein identification using MBR as described above and previously.[20] 817 proteins were identified across the samples containing 20 cells, and 485 proteins were identified across the single-cell samples using the MaxQuant MBR algorithm (Supplementary dataset 1). Of the 485 proteins identified across the single-cell samples, 328 proteins were quantifiable based on the same criteria applied to the HeLa samples. The levels of all 328 proteins quantified in single cells were projected onto their principal components. Principal component analysis (PCA) revealed the single-cell proteomes clustered by cell type (Figure 3a), indicating that our label-free single-cell proteomics platform can identify cell types based on protein expression alone.
Figure 3.
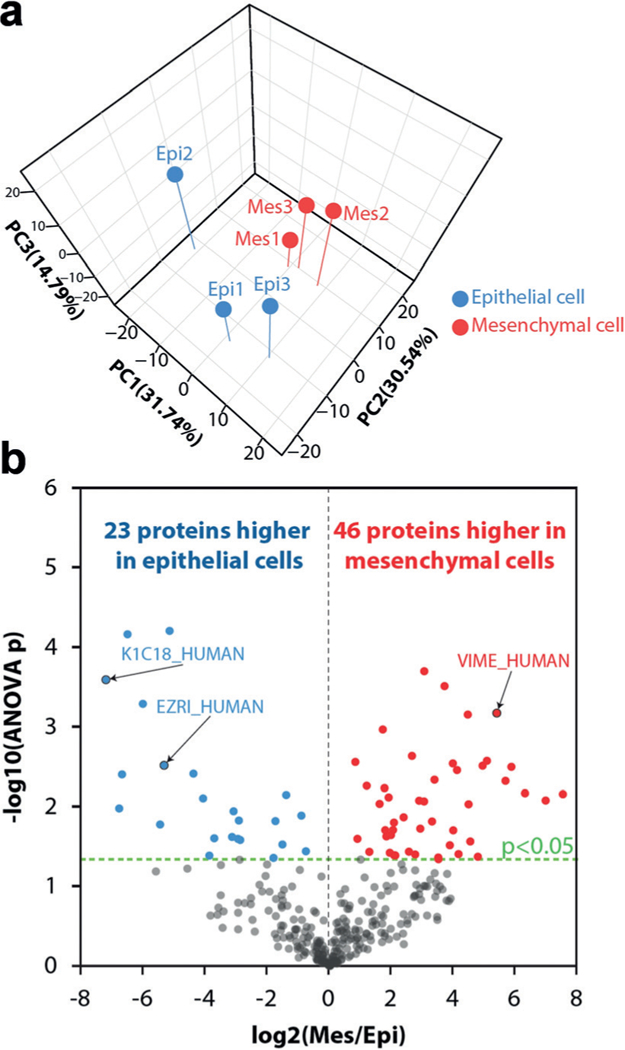
a) Unsupervised PCA based on label-free quantification of proteins expressed epithelial and mesenchymal cells from human lung. b) Volcano plot of differentially expressed proteins. Epithelial cell Replicate 2 was excluded for this analysis.
To identify features facilitating the distinction of the two cell types, analyses of variance (ANOVA) were performed. ANOVA comparing single-cell epithelial and mesenchymal proteomes revealed circa 15% of quantified proteins (48 proteins) to be significantly differential (p < 0.05) (Supporting Information, Figure S3; Supplementary dataset 1). Among the significantly differential proteins were those expected to be cell type specific, such as vimentin (VIME_human),[24] a mesenchymal marker, which was higher in abundance in mesenchymal cells, and ezrin (EZRI_human), an epithelial cell marker, which was higher in abundance in epithelial cells. The PCA plot indicated a separation between Epi2 and Epi1, Epi3 that perhaps could represent a true biological difference not accounted for in the above ANOVA. Indeed, prior work has shown there are quite distinct subtypes of lung epithelial cells,[25] and Epi2 may represent one of these. To perform a more focused two-state comparison, we repeated the ANOVA analysis excluding the second sorted epithelial cell (Epi2) from the analysis. This subsequent ANOVA analysis revealed similar results to the prior analysis, with circa 20% of quantified proteins (66) being significantly differential (p < 0.05) (Figure 3b). Among the significantly differential proteins were the previously described cell-type-specific markers vimentin and ezrin as well as keratin 18 (K1C18_human), which was higher in abundance in epithelial cells and is a well-known epithelial cell marker protein.
Analyses of single cell transcriptomes through single-cell RNA sequencing (scRNA-seq) have proven useful in more fully characterizing cell populations within tissue homogenates, leading to the identification of rare and new cell populations by differentiating cell types based on transcript expression alone.[25,26] However, markers for cell populations inferred from scRNA-seq data are not as readily applicable for isolating cell populations, as measured RNA levels are only moderately correlated with protein levels.[27,28] The single-cell proteomics platform reported in this study has enabled direct cell differentiation based on proteome expression. This opens the door to several potential biological applications including the identification of previously unappreciated cell populations and, crucially, protein-level markers for these novel cell populations that can immediately be utilized for purifying those populations by using antibody-based FACS approaches. To enable large-scale study of single cells, the analysis throughput can be increased by using sample multiplexing based on isobaric barcoding,[29] multiple LC columns,[30] and high-speed gas-phase separations in place of LC.[31] Finally, we anticipate the platform will find broad application in various biomedical research areas, including identification of circulating tumor cells, understanding stem cell development, and interrogation of tumor heterogeneity, particularly as additional sensitivity gains lead to greater proteome coverage at the single-cell level.
Experimental Section
NanoPOTS chips containing an array of 5 × 13 nanowells with diameter of 1 mm and on-center spacing of 2.25 mm were fabricated on a standard microscope slide (Telic, Valencia, USA).[20] The nanowell surface retained its native hydrophilicity while the surrounding chip surface was treated to be hydrophobic with a solution containing 2% heptadecafluoro-1,1,2,2-tetrahydrodecyl)dimethylchlorosilane (PFDS) in 2,2,4-trimethylpentane (v/v). A glass spacer was fabricated by laser-milling and then affixed to the nanoPOTS chip with silicone adhesive. A cover plate was fabricated by spin coating a layer of PDMS (30 μm) on a glass slide. The cover plate can reversibly seal to the nanowell chip through the spacer to minimize evaporation during reaction incubation procedures.
A fluorescence-activated cell sorter (Influx, BD Biosciences, San Jose, USA) was employed for collecting cells into nanowells. The cell sorter was trained to fit in the format of the nanowell chip and fluorescent beads were used to confirm targeting and optimize cell sorter parameters. For stained HeLa cells, forward and side scatter were used to exclude cellular debris, and fluorescence (excited at 488 nm and emitted at 520/15 nm) was used to select cells. For unstained HeLa cells, forward and side scatter were used for cell selection. The lung primary cells were stained with a membrane impermeant dye propidium iodide (91 mgmL−1, 5 min) to detect dead cells. Sort gates were set to exclude selection of the dead cell population. The cells were sorted based on fluorescence excited at 520 nm and emitted at 585/29 nm. To minimize the effect of cell volume on single-cell protein quantification, side scatter combined with forward scatter or fluorescence was used to select cells with similar size for analysis.
For proteomic sample preparation, reagents were dispensed into nanowells using a home-built robotic liquid handling system with subnanoliter dispensing resolution. The robotic system was enclosed in a Lexan chamber and maintained at 95% humidity to minimize evaporation during dispensing. Cells were lysed and proteins were extracted with 0.2% DDM and 5 mm DTT and heating at 70°C for 1 h. Proteins were alkylated with 10 mm IAA for 30 min, and digested with Lys-C and Trypsin (0.25 ng protease in each well) for for 4 h and 6 h, respectively.
Digested samples were cleaned up with a SPE column and separated on a nanoLC column (50-cm long, 30 μm i.d.) under a flow rate of 60 nLmin−1 and a 60-min linear gradient of 8–22% buffer B (0.1 formic acid in acetonitrile). All data were acquired using an Orbitrap Fusion Lumos Tribrid mass spectrometer (ThermoFisher) under automated data dependent acquisition mode. MaxQuant (version 1.5.3.30) was employed for database searching and label-free protein quantification.[22] Both peptides and proteins were filtered with a false discovery rate (FDR) of 0.01. MBR algorithm was activated to improve proteome coverage with an alignment window of 15 min and a match time window of 0.5 min. iBAQ protein intensities were used for quantification. The output tables were processed and visualized in R.[32]
Supplementary Material
Acknowledgements
This work was supported by the NIH grants R33 CA225248 and R21 EB020976 (R.T.K.), U01 HL122703 and UC4DK108101 (C.A.) and P41 GM103493 (R.D.S.). This research was performed using EMSL, a national scientific user facility sponsored by the Department of EnergyQs Office of Biological and Environmental Research and located at PNNL. We thank the LungMAP HTC for providing isolated primary human epithelial and mesenchymal cells (U01 HL122700 to G.P.)
Footnotes
Supporting information and the ORCID identification number(s) for the author(s) of this article can be found under: https://doi.org/10.1002/anie.201802843
Conflict of interest
The authors declare no conflict of interest.
References
- [1].Nilsson T, Mann M, Aebersold R, Yates JR, Bairoch A, Bergeron JJM, Nat. Methods 2010, 7, 681–685. [DOI] [PubMed] [Google Scholar]
- [2].Mann M, Kulak NA, Nagaraj N, Cox J, Mol. Cell 2013, 49, 583–590. [DOI] [PubMed] [Google Scholar]
- [3].Halpern KB, Shenhav R, Matcovitch-Natan O, Tlth B, Lemze D, Golan M, Massasa EE, Baydatch S, Landen S, Moor AE, et al. , Nature 2017, 542, 352–356. [DOI] [PMC free article] [PubMed] [Google Scholar]
- [4].Lein E, Borm LE, Linnarsson S, Science 2017, 358, 64–69. [DOI] [PubMed] [Google Scholar]
- [5].Ståhl PL, Salmén F, Vickovic S, Lundmark A, Navarro JF, Magnusson J, Giacomello S, Asp M, Westholm JO, Huss M, et al. , Science 2016, 353, 78–82. [DOI] [PubMed] [Google Scholar]
- [6].Warkiani ME, Khoo BL, Wu L, Tay AKP, Bhagat AAS, Han J, Lim CT, Nat. Protoc 2015, 11, 134–148. [DOI] [PubMed] [Google Scholar]
- [7].Smith RD, Shen Y, Tang K, Acc. Chem. Res 2004, 37, 269–278. [DOI] [PubMed] [Google Scholar]
- [8].Altelaar AFM, Heck AJR, Curr. Opin. Chem. Biol 2012, 16, 206–213. [DOI] [PubMed] [Google Scholar]
- [9].Sun L, Zhu G, Zhao Y, Yan X, Mou S, Dovichi NJ, Angew. Chem. Int. Ed 2013, 52, 13661–13664; Angew. Chem. 2013, 125, 13906–13909. [DOI] [PMC free article] [PubMed] [Google Scholar]
- [10].Zhu Y, Zhao R, Piehowski PD, Moore RJ, Lim S, Orphan VJ, Paša-Tolić L, Qian WJ, Smith RD, Kelly RT, Int. J. Mass Spectrom. 2018, 427, 4–10. [DOI] [PMC free article] [PubMed] [Google Scholar]
- [11].Li S, Plouffe BD, Belov AM, Ray S, Wang X, Murthy SK, Karger BL, Ivanov AR, Mol. Cell. Proteomics 2015, 14, 1672–1683. [DOI] [PMC free article] [PubMed] [Google Scholar]
- [12].Wiśniewski JR, Ostasiewicz P, Mann M, Proteome Res J. 2011, 10, 3040–3049. [DOI] [PubMed] [Google Scholar]
- [13].Clair G, Piehowski PD, Nicola T, Kitzmiller JA, Huang EL, Zink EM, Sontag RL, Orton DJ, Moore RJ, Carson JP, et al. , Sci. Rep 2016, 6, 39223. [DOI] [PMC free article] [PubMed] [Google Scholar]
- [14].Sielaff M, Kuharev J, Bohn T, Hahlbrock J, Bopp T, Tenzer S, Distler U, Proteome Res J. 2017, 16, 4060–4072. [DOI] [PubMed] [Google Scholar]
- [15].Chen Q, Yan G, Gao M, Zhang X, Anal. Chem 2015, 87, 6674–6680. [DOI] [PubMed] [Google Scholar]
- [16].Wang N, Xu M, Wang P, Li L, Anal. Chem 2010, 82, 2262–2271. [DOI] [PubMed] [Google Scholar]
- [17].Virant-Klun I, Leicht S, Hughes C, Krijgsveld J, Mol. Cell. Proteomics 2016, 15, 2616–2627. [DOI] [PMC free article] [PubMed] [Google Scholar]
- [18].Lombard-Banek C, Moody SA, Nemes P, Angew. Chem. Int. Ed 2016, 55, 2454–2458; Angew. Chem. 2016, 128, 2500–2504. [DOI] [PMC free article] [PubMed] [Google Scholar]
- [19].Murgia M, Toniolo L, Nagaraj N, Ciciliot S, Vindigni V, Schiaffino S, Reggiani C, Mann M, Deshmukh AS, Zeiler M, et al. , EMBO Rep 2015, 16, 387–395. [DOI] [PMC free article] [PubMed] [Google Scholar]
- [20].Zhu Y, Piehowski PDD, Zhao R, Chen J, Shen Y, Moore RJJ, Shukla AK, Vladislav PA, Campbell-Thompson ML, Mathews CE, et al. , Nat. Commun 2018, 9, 882. [DOI] [PMC free article] [PubMed] [Google Scholar]
- [21].Volpe P, Eremenko-Volpe T, Eur. J. Biochem 1970, 12, 195–200. [DOI] [PubMed] [Google Scholar]
- [22].Tyanova S, Temu T, Cox J, Nat. Protoc 2016, 11, 2301–2319. [DOI] [PubMed] [Google Scholar]
- [23].Cox J, Hein MY, Luber CA, Paron I, Nagaraj N, Mann M, Mol. Cell. Proteomics 2014, 13, 2513–2526. [DOI] [PMC free article] [PubMed] [Google Scholar]
- [24].Sudo T, Iwaya T, Nishida N, Sawada G, Takahashi Y, Ishibashi M, Shibata K, Fujita H, Shirouzu K, Mori M, et al. , Ann. Surg. Oncol 2013, 20, 324–335. [DOI] [PubMed] [Google Scholar]
- [25].Treutlein B, Brownfield DG, Wu AR, Neff NF, Mantalas GL, Espinoza FH, Desai TJ, Krasnow MA, Quake SR, Nature 2014, 509, 371–375. [DOI] [PMC free article] [PubMed] [Google Scholar]
- [26].Tang Q, Iyer S, Lobbardi R, Moore JC, Chen H, Lareau C, Hebert C, Shaw ML, Neftel C, Suva ML, et al. , J. Exp. Med 2017, 214, 2875–2887. [DOI] [PMC free article] [PubMed] [Google Scholar]
- [27].Schwanh-usser B, Busse D, Li N, Dittmar G, Schuchhardt J, Wolf J, Chen W, Selbach M, Nature 2011, 473, 337–342. [DOI] [PubMed] [Google Scholar]
- [28].Muers M, Nat. Rev. Genet 2011, 12, 518. [DOI] [PubMed] [Google Scholar]
- [29].McAlister GC, Huttlin EL, Haas W, Ting L, Jedrychowski MP, Rogers JC, Kuhn K, Pike I, Grothe RA, Blethrow JD, et al. , Anal. Chem 2012, 84, 7469–7478. [DOI] [PMC free article] [PubMed] [Google Scholar]
- [30].Livesay EA, Tang K, Taylor BK, Buschbach MA, Hopkins DF, LaMarche BL, Zhao R, Shen Y, Orton DJ, Moore RJ, et al. , Anal. Chem 2008, 80, 294–302. [DOI] [PMC free article] [PubMed] [Google Scholar]
- [31].Deng L, Ibrahim YM, Hamid AM, Garimella SVB, Webb IK, Zheng X, Prost SA, Sandoval JA, Norheim RV, Anderson GA, et al. , Anal. Chem 2016, 88, 8957–8964. [DOI] [PMC free article] [PubMed] [Google Scholar]
- [32].Lê S, Josse J, Husson F, Stat J. Software 2008, 25, 1–18. [Google Scholar]
Associated Data
This section collects any data citations, data availability statements, or supplementary materials included in this article.