Abstract
Computational simulations of blood flow contribute to our understanding of the interplay between vascular geometry and hemodynamics. With an improved understanding of this interplay from computational fluid dynamics (CFD), there is potential to improve basic research and the targeting of clinical care. One avenue for further analysis concerns the influence of time on the vascular geometries used in CFD simulations. The shape of blood vessels changes frequently, as in deformation within the cardiac cycle, and over long periods of time, such as the development of a stenotic plaque or an aneurysm. These changes in the vascular geometry will, in turn, influence flow within these blood vessels. By performing CFD simulations in geometries representing the blood vessels at different points in time, the interplay of these geometric changes with hemodynamics can be quantified. However, performing CFD simulations on different discrete grids leads to an additional challenge: how does one directly and quantitatively compare simulation results from different vascular geometries? In a previous study, we began to address this problem by proposing a method for the simplified case where the two geometries share a common centerline. In this companion paper, we generalize this method to address geometric changes which alter the vessel centerline. We demonstrate applications of this method to the study of wall shear stress in the left coronary artery. First, we compute the difference in wall shear stress between simulations using vascular geometries derived from patient imaging data at two points in the cardiac cycle. Second, we evaluate the relationship between changes in wall shear stress and the progressive development of a coronary aneurysm or stenosis.
Keywords: hemodynamics, computational fluid dynamics, vasculature
2010 MSC: 92, 76
1. Introduction
Recent advancements in biomedical imaging have led to profound interest in performing computational fluid dynamics (CFD) simulations in patient-specific geometries derived from medical imaging data. CFD simulations have been shown to be effective for measuring patient-specific hemodynamic risk factors for clinical use, such as fractional flow reserve in the coronary arteries, by using geometries reconstructed from medical imaging data [1]. Likewise, CFD simulations in image-derived geometries have also been used to understand biophysical mechanisms at play in vascular anomalies, such as a relationship between wall shear stress and aneurysm development [2]. Wall shear stress – the tangential force along the vessel wall caused by blood flow – is an important factor for the biophysical function of the endothelial cells which comprise the vessel wall and has been connected to the formation of atherosclerotic lesions in the coronary arteries [3]. Hemodynamic parameters computed in patient-specific CFD simulations can therefore be used to guide clinical practice and to perform basic biomedical research. One avenue for improving the state of current simulations is to systematically account for patient data collected at multiple time points. The purpose of this study is to provide a tool for comparing and distinguishing the differences between CFD simulations in vascular geometries derived from patient imaging data at multiple time points. We illustrate the application of this framework to study wall shear stress in the left coronary artery.
The dominant factor in determining wall shear stress in the coronary arteries is vessel geometry [4]. However, the shape and position of coronary arteries change over a range of timescales. Located on the surface of the heart, the coronary arteries are translated and deformed with each heartbeat. While CFD simulations typically use the position of the coronary arteries at a single point in the cardiac cycle, the dynamic motion of the coronary arteries can influence hemodynamic factors. Indeed, CFD studies of a single branch in the right coronary artery have shown that vessel deformation due to the cardiac cycle may significantly influence wall shear stress [5, 6]. In contrast, the formation of atherosclerotic plaques in arteries progressively creates stenoses – narrowings in the effective channel for blood flow – over months or years. Similarly, the development of aneurysms – localized dilatations in the blood vessel walls – involves the blood vessel expanding slowly over a long period of time. Both vascular abnormalities are strongly associated with hemodynamics. For stenoses, the association of atherosclerosic progression with wall shear stress is well established in the coronary arteries [7, 3]. Likewise, CFD study of coronary aneurysms associated with Kawasaki disease has shown a drastic decrease in wall shear stress within the aneurysm [8]. Therefore, clear applications exist for comparing CFD results in geometries corresponding to multiple points in the cardiac cycle or to different stages in the development of vascular abnormalities.
Comparisons of hemodynamics in vascular geometries at different time points require some commonality between the compared objects. To compare CFD results at a given position on two geometries, a method is required to define this same (or, ‘homologous’) position on both geometries. However, by definition, a naive direct comparison is precluded when the simulations are conducted on different 3D geometries and on different discrete computational grids. Two general approaches to this problem seem to exist. In the first approach, the complexity of the comparison may be reduced by selecting a subset of locations - e.g., a series of cross-sectional slices along both geometries - and comparing hemodynamic factors only at these locations (e.g., [9, 10, 11, 12]). This approach is effective, but inherently limits the detail of the comparison. For the case of cross-sectional slices, for example, the CFD results along the 2D surface of the geometry are reduced to a set of 1D comparisons. In the second approach, vascular registration algorithms may be used to align the geometries. Registration using rigid-body rotation has been used to align intracranial aneurysms taken from the same patient at different time points and estimate the displacement between them [13, 14, 2]. Further, vascular image registration methods that incorporate local deformations have also been developed; see the review in [15]. Registration itself is not sufficient for a direct comparison: a rule for determining homologous points must still be defined to determine how simulation results at a given location change between the two geometries. Boussel et al. reasonably addressed this problem by assuming that displacement between the registered geometries occurs only in the radial direction [14]. However, to the best of our knowledge, a more general transform for quantitatively comparing simulation results between two registered geometries does not exist.
In a previous companion paper [16], we proposed a method to address the idealized case of a comparison between two vascular geometries with identical centerlines. We extended [14] by defining a general framework for identifying homologous vertices on the geometries and demonstrated the comparison could be effected to study the relationship of wall shear stress with an aortal stenosis and an aortal aneurysm. In this work, we significantly improve this method to incorporate different centerlines and, therefore, support the local deformations and rotations which may occur as vascular geometries change over time. The capability of our method is demonstrated by application to study the influence of vascular shape changes on CFD results in the left anterior descending (LAD) branch of the left coronary artery. We focus on wall shear stress defined on the surface of the blood vessel, though similar applications could potentially be made for variables like velocity that are defined throughout the vessel volume.
The remainder of the paper is organized as follows: Sections 2.1 and 2.2 provide details about the image segmentation and computational hemodynamics solver used in this study, respectively. Section 2.3 presents the proposed mapping between vascular geometries taken from medical imaging data of the same patient at two time points. Three applications of this mapping are then presented in section 3. Section 3.1 applies the mapping to exhibit the differences between flow simulations in the LAD at different points in the cardiac cycle. Sections 3.2 and 3.3 employ the mapping to compare flow simulations at multiple points in the development of an aneurysm and stenosis.
2. Methods
2.1. Vascular geometry preparation
The vascular geometries used in this study are derived from computed tomography angiography (CTA) scans of a left coronary artery. The imaging data was acquired from Brigham and Women’s Hospital (Boston, MA) with appropriate IRB approval. The raw DICOM image files were segmented using Materialise Mimics (Materialise, Leuven, Belgium) using the coronal, sagittal, and axial views. Two segmentations were performed, during the systolic and diastolic phases of the cardiac cycle, to produce a pair of vascular geometries. The geometry files were exported from Mimics as surface meshes in the stereolithography (STL) format. We will focus this study on the left anterior descending (LAD) artery and its branches, as shown in figure 1. For the sake of simplicity, the resulting LAD geometries from the two points in the cardiac cycle will be referred to hereafter as the systolic and diastolic geometries. The vessel centerlines for both LAD geometries were computed with Materialise Mimics.
Figure 1.
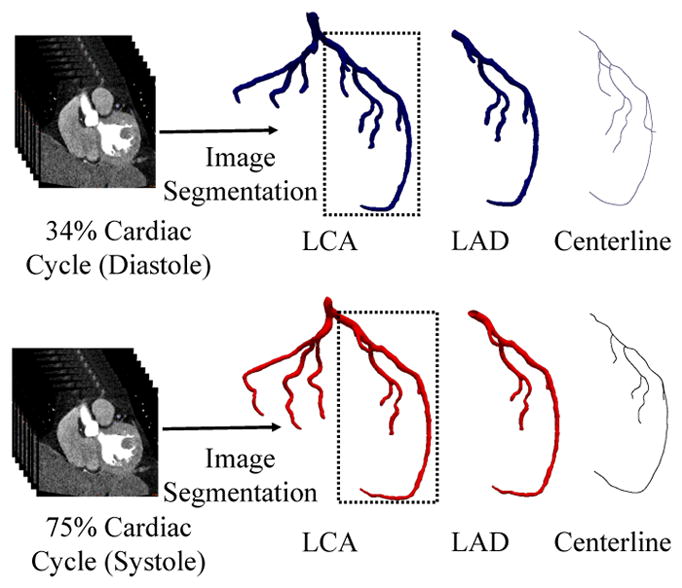
Patient CTA data is segmented at diastolic (top row) and systolic (bottom row) phases of the cardiac cycle to reconstruct two left coronary artery (LCA) models. We focus on the left anterior descending (LAD) artery, with the centerline structure shown at right.
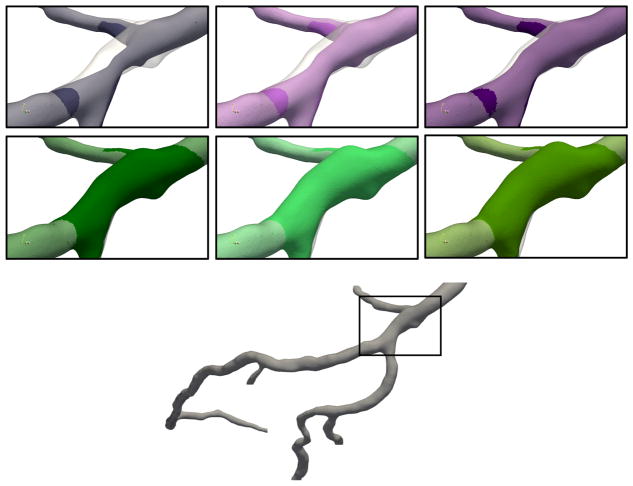
Additional geometries were created to represent the development of a stenosis or aneurysm in the diastolic LAD geometry. We use the mesh software Blender (Blender Institute, Amsterdam, Netherlands) to narrow or widen one region of the geometry to artificially introduce stenoses and aneurysms, respectively. The area surrounding the artificially narrowed or widened region was smoothed, in order to create a natural transition, leading to modifications in the geometry which extend beyond the stenosis or aneurysm itself. Further, vessel centerlines in all branches were recomputed with Mimics for each new stenosed or aneurysmal geometry. Stenosis or aneurysm degree is measured by the ratio of the cross-sectional area of the stenosis or aneurysm to the normal cross-sectional area of the branch. Stenoses of 25%, 50%, and 75% were created, along with aneurysms of 125%, 150%, and 175%. The stenosis and aneurysm location is shown in figure 2, along with comparison images of the geometries.
Figure 2.
(Top) From left to right, stenoses of 75%, 50%, and 25%. (Middle) From left to right, aneurysms of 25%, 50%, and 75%. (Bottom) Full diastolic LAD geometry with location of stenosis or aneurysm marked. The gray overlay indicates the original diastolic geometry.
2.2. Computational fluid dynamics simulations
We perform flow simulations in the left coronary arteries using HARVEY, a parallel CFD application focused on hemodynamics [17]. HARVEY implements the lattice Boltzmann method, a weakly compressible Navier-Stokes solver. Using in vitro experimental data, the application has been validated for Newtonian flow in a patient-specific vascular geometry [9]. Details of the numerical implementation and parallel performance may be found in our previous work [18, 16].
The regular Cartesian grid used by the lattice Boltzmann method in HARVEY is based on the STL files generated from segmentation. Surface hemodynamic factors, such as wall shear stress, are output over the region of the Cartesian grid adjacent to the vessel wall. For the purpose of analysis, we project surface hemodynamic factors from the simulation domain back onto the surface STL file. As a result, the methods presented in this paper are not tied to a computational fluid dynamics solver with a Cartesian grid and would work similarly if a finite element or finite volume flow solver were employed.
Simulations in HARVEY were conducted using 32 cores on Intel Xeon E5-2699V4 processors of the Duke Compute Cluster. The resolution of the simulations was 75μm, based on a convergence study in coronary geometries derived from CTA imaging data. We use a steady inflow with a Poiseuille profile and a maximum velocity of 0.4m/s, and run the simulation until an approximate steady-state is achieved. This steady inflow is a reasonable approximation of the maximum inflow to the left coronary artery during diastole. For the sake of simplicity, a simple fixed pressure condition is enforced at the outlet. Likewise, flow was assumed to be Newtonian with a dynamic viscosity of 4 cP [19].
2.3. Mapping between vascular geometries
Two basic characteristics of vascular geometries are their tree-like structures and their locally tubular shapes within a branch of the tree. For different timepoints from the same patient, the vessels will have the same branching structure, but will differ in several respects. First, variations can be introduced by the imaging or segmentation modalities [20, 21]. Segmentations of multiple datasets could lead to different positioning and orientation of the geometries, though this can be substantially mitigated with rigid-body registration [15]. Furthermore, manual aspects of the segmentation process have the potential to introduce segmentation bias and inter-observer differences. Additionally, features of the imaging modality and process – including acquisition angle, patient movement, resolution, and the timepoint in the cardiac cycle – influence imaging data quality. These features may also lead to small side branches of large blood vessels appearing shorter or longer in certain reconstructions. Second, substantive differences will appear in the geometries due to the times at which the data was collected. The length and curvature of branches may change between scans taken at different points in the cardiac cycle. Likewise, the development of vascular abnormalities, such as aneurysms or stenoses, will lead to local changes in curvature and diameter. Our purpose in this work is to build upon rigid-body registration by developing a mapping which attempts to control for inherent changes due to imaging and segmentation while retaining the important biophysical differences.
To represent the tree-like structure, we use the vessel centerlines computed from the segmentation software Mimics. Centerline extraction from imaging data or segmented vascular geometries is a standard component of segmentation methods (e.g., [22]) and CFD analysis (e.g., [23]). As indicated in figure 3, the centerlines represent each branch by a set of points along the approximate center of the vessel and are connected to other centerlines at the vessel bifurcations.
Figure 3.
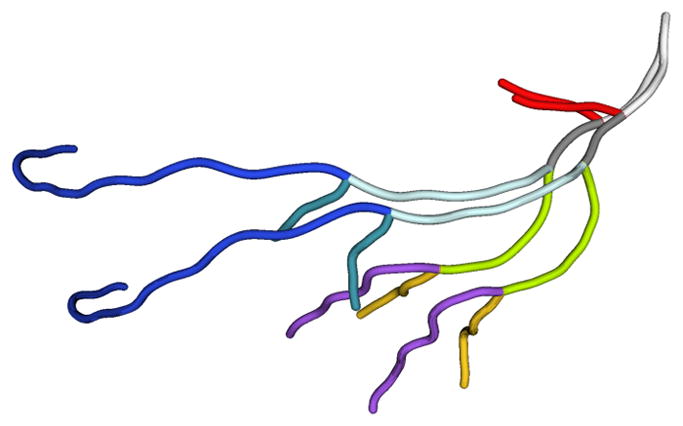
Centerlines for the LAD during the systolic and diastolic phases, colored by branch.
The first step in mapping between the two geometries involves establishing a mapping between centerlines in each branch, based on the raw centerline data from Mimics. For notational simplicity, we shall refer to the domain geometry as X and the co-domain geometry as Y . Therefore, we aim to establish a one-to-one mapping f for each branch 𝔅,
| (1) |
between centerpoint sets CX and CY in the domain and co-domain, respectively. Further, the set of points c ∈ CX(𝔅) are required to lie in the same normalized position along the branch 𝔅 as f(c) ∈ CY (𝔅). Computing the new centerpoints that satisfy this mapping requires linear or spline interpolation of the raw centerline data to determine homologous centerpoints in the same normalized position along the vessel.
However, the determination of branch length requires special treatment. For branches that are fully represented in the vessel geometry – from base to bifurcation – we assume that any difference between the branch lengths computed from the raw centerlines data is due to stretching or compression. However, for branches which might have been truncated by the limitations of the imaging or segmentation process, we truncate the longer branch to match the length of the shorter branch. In either case, the result of this process is that a bijective mapping f trivially exists between the new sets of centerline points for each branch 𝔅 of the vessel geometries.
The second step in developing a mapping between the two geometries is to associate the vertices of each geometry to the centerlines of the nearest branch. For each vertex s of the domain geometry SX, we determine the branch 𝔅 to which the vertex sX belongs. Further, within this branch, we find the centerpoint c ∈ CX(𝔅) which is nearest to the vertex sX in terms of Euclidean distance. Using this association of each vertex with a branch and a centerpoint within that branch, the set of vertices SX is consequently grouped into subsets TX(𝔅i, cj) corresponding to branch 𝔅i and centerpoint cj within this branch. These subsets form a partition of SX:
Associated with each vertex s ∈ TX(𝔅i, cj) is a vector v(s, cj ), which is computed as the normalized unit vector in the direction from vertex s to centerpoint cj . Assuming the branch geometry is locally convex with respect to the centerline, this vector will be unique over the set TX(𝔅i, cj ). With the exception of certain saccular (or ‘berry’) aneurysms, such as may occur in the cerebral vasculature, this convexity assumption is reasonable for almost all vascular geometries.
The final step is to use the mapping between centerlines as the basis for mapping between the vascular geometries themselves. In this mapping g, we seek to identify a homologous vertex h in the co-domain for each vertex s in the domain:
| (2) |
We assume that the vertices s and h in the co-domain must be associated with the same branch 𝔅i and centerpoint cj within this branch. In the absence of rotation, we define the homologous vertex h as that which maximizes the cosine similarity between the unit vectors v(s, cj) and v(h, cj ):
| (3) |
for a given s ∈ TX(𝔅i, cj ). However, as the centerline orientation can change, the local rotation matrix R(cj) between the centerline tangent vectors t(cj) is computed using Rodrigues’ rotation formula. The homologous vertex h is then identified by
| (4) |
over the same conditions as above. For each vertex on the domain SX, a homologous vertex on the co-domain SY is therefore identified by this mapping. However, the identified vertex in the co-domain is not unique and may represent the homologous vertex for multiple vertices in the domain. As a result, the mapping is not bijective and the reverse mapping of the domain onto the co-domain will not necessarily identify the same homologous vertex.
The resulting mapping between the domain and co-domain vessel geometries has applications for topological and hemodynamic analysis. First, the mapping can also be used to project hemodynamic factors from simulations in the co-domain vessel geometry onto the domain geometry. In this way, the difference between hemodynamic factors in the domain and co-domain geometries is computed on a per-vertex basis. As discussed in the subsequent application sections, this per-vertex comparison facilitates quantitative comparisons of CFD results while limiting data reduction. Second, the approximate displacement of each vertex from domain to co-domain is computed from the difference in magnitude of the unnormalized vectors v(s, cj) and v(h, cj ). Displacement between homologous vertices is therefore defined as the change in distance to the ‘common’ point on the centerline. This local displacement can be used to help quantify the development of a vascular abnormality, such as an aneurysm growth, or the diameter change of a blood vessel over the cardiac cycle.
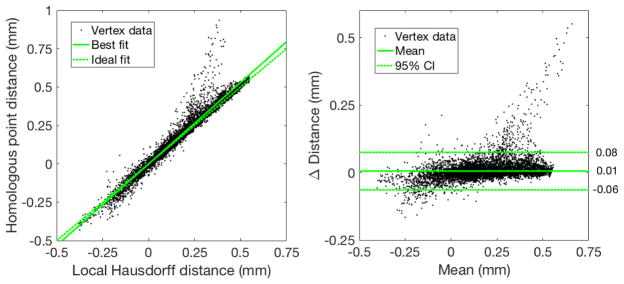
We note that other methods for computing local vascular displacement exist, such as local Hausdorff distance [2, 16]. Defined as the minimum distance between this vertex and any vertex on the other geometry, local Hausdorff distance is obtained from the Part Comparison Analysis tool in Materialise 3-matic (Materialise, Leuven, Belgium). To evaluate the possible disagreement between these two metrics, we compute displacement between the original diastolic and the 25% stenosis geometries in the stenosis region indicated by the inset in figure 2. Figure 4 compares per-vertex displacement computed by the distance between homologous vertices with local Hausdorff distance. We observe a strong correlation between the two metrics (R2 = 0.96). Further, the 95% confidence interval from Bland-Altman analysis is less than 0.1mm, which is reasonable for the displacement magnitude observed here. In the upper right of figure 4, the distance between homologous vertices does meaningfully exceed the local Hausdorff distance. For this small set of vertices, local Hausdorff distance identifies a nearest vertex on a different branch of the other geometry, the distance to which is smaller than the distance to the homologous vertex. Therefore, the displacement metric from our mapping agrees very well overall with a standard metric like local Hausdorff distance.
Figure 4.
Bland-Altman analysis for displacement between the original diastolic and the 25% stenosis geometries in the stenosis region. Each datapoint corresponds to a single vertex on the diastolic geometry. The reproducibility coefficient is 0.07.
3. Results
3.1. Shape and position within the cardiac cycle
For blood flow simulations in the coronary arteries, geometries are typically derived from segmenting patient-imaging data at a single timepoint in the cardiac cycle. Many coronary artery hemodynamic simulations assume the vessel walls to be rigid and, consequently, the entire cardiac cycle is simulated in the position and shape of the coronary arteries at this single instant. Among simulations with deformable vessel walls, the motion of the wall over the cardiac cycle is usually determined by the interaction with the fluid (e.g., [24]). In contrast, the work of Torii et al. introduced a method for the dynamic vessel motion of a right coronary over the course of a cardiac cycle [5, 6]. Their work generates a single, time-dependent and deformable mesh from different points in the cardiac cycle and the mesh triangulation does not change in time. However, the more common use case involves meshes segmented at different points in the cardiac cycle with independent triangulations, requiring the identification of homologous vertices. Therefore, to determine whether the fidelity of these computational models could be improved by taking into account multiple timepoints in the cardiac cycle, an analysis framework to determine the influence hemodynamic factors of interest, such as wall shear stress, is required.
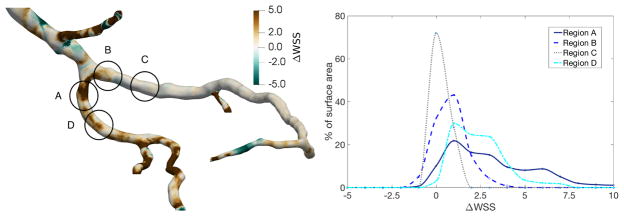
In this section, we apply the mapping procedure developed in the section 2.3 to illustrate how flow simulations conducted in geometries corresponding to different points in the cardiac cycle might be compared. Figure 5 displays results from simulations for wall shear stress in the diastolic and systolic coronary geometries. The significance of the changes in wall shear stress at the two cardiac cycle time points is most easily evaluated with a common frame of reference. In figure 6, the mapping is used to subtract systolic wall shear stress from the diastolic values at homologous vertices. As a result, we are able to compute the change in wall shear stress over the entire surface of the geometry. For this study, we focus on 4 regions near the bifurcation of the LAD and diagonal arteries, denoted as regions A–D in figure 6. For the two regions (A, D) in the diagonal, wall shear stress is significantly higher in the diastolic geometry, even distal to the bifurcation. Conversely, much lower changes in wall shear stress are observed within the two regions (B, C) in the LAD, where the average change is nearer to zero.
Figure 5.
Wall shear stress results from flow simulations in diastolic (left) and systolic (right) geometries.
Figure 6.
Change in wall shear stress from systolic to diastolic geometry, plotted over the surface of the diastolic geometry (left) and binned according to the percentage of surface area with the observed change in wall shear stress in the four denoted regions (right).
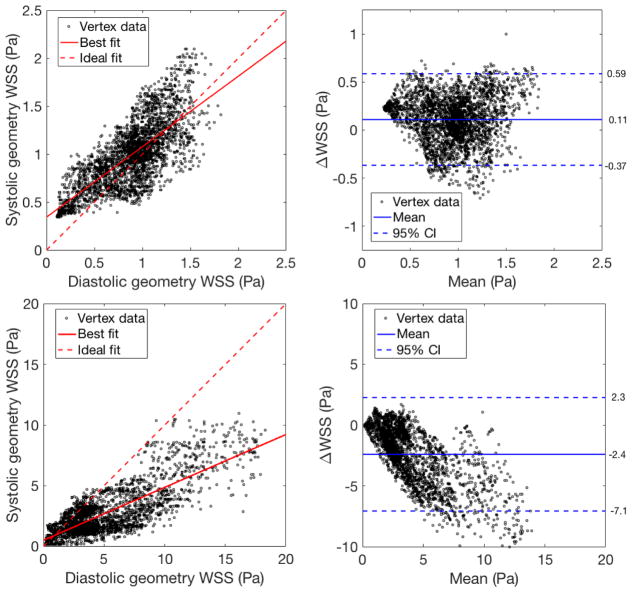
As the simulations in the systolic and diastolic geometries purport to study the same quantity – wall shear stress in the same locations on the LAD coronary artery – we use Bland-Altman analysis to determine the significance of the wall shear stress change. Figure 7 shows the Bland-Altman analysis for regions C and A. Each datapoint corresponds to a single vertex on the diastolic geometry. Within region C, the bias is minimal (0.1 Pa) and the 95% confidence interval is about 0.5Pa, which falls within many ranges for physiological classification of high or low wall shear stress [25]. Conversely, for region A, both the bias and 95% confidence interval are very large relative to these standard wall shear stress classification ranges.
Figure 7.
Bland-Altman analysis for regions C (top) and A (bottom) from figure 6. The reproducibility coefficients are 0.48 and 4.7, respectively.
Therefore, this analysis allows for the determination of whether simulations in the systolic and diastolic geometries under consideration lead to physiologically different wall shear stress results. In this simple test case, wall shear stress measured with CFD in the two geometries leads to a significant disagreement in some regions. By allowing for Bland-Altman analysis to be performed on a per-vertex basis, we allow for a more complete and targeted characterization than with reduced data, such as comparing circumferentially averaged data on homologous slices.
3.2. Progressive development of a stenosis
Effective comparisons between simulation results conducted in vascular geometries derived from patient imaging data at different time points are also interesting over much longer time scales than the cardiac cycle. Vascular abnormalities, such as a stenosis related to atherosclerosis, develop over periods of months or years. While the risk to the patient remains low, the abnormality is monitored by clinicians but surgical intervention is unlikely to occur. Clinical care could be improved by methods that would help identify vascular abnormalities with the potential to significantly worsen. Hemodynamic factors derived from patient-specific simulations, such as wall shear stress, are indicators of possible disease progression [7, 3, 26]. Our framework attempts to quantitatively assess the correlation between anatomical changes over a period of time and the wall shear stress obtained from CFD analysis.
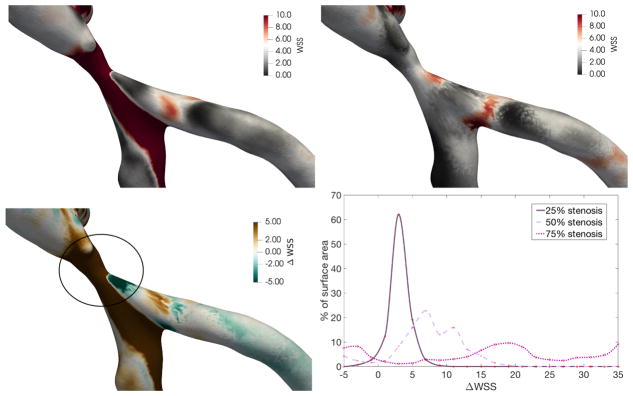
To study the influence of a stenosis on surface hemodynamics, we conduct flow simulations in the three stenosed geometries from section 2.1 and compare the results with the normal diastolic geometry. A stenosis will generally expected to significantly increase wall shear stress due to the increased velocity in the narrowed region. However, changes in wall shear stress in a patient-specific geometry can be more challenging to predict, as regions of low wall shear stress may develop beyond the stenosis. Simulation results from the diastolic geometry are mapped onto each of the stenosed geometries to facilitate a direct comparison. As shown in figure 8 for the 75% stenosis geometry, this allows for the displacement and the difference in wall shear stress, both relative to the diastolic geometry, to be computed over the surface of the stenosed geometry. We observe that the expected large increase in wall shear stress is not limited to the stenosis, but continues until the bifurcation, while also decreasing wall shear stress in small regions after the stenosis.
Figure 8.
(Top left) Wall shear stress for 75% stenosis. (Top right) Normal wall shear stress for normal geometry, mapped onto geometry with 75% stenosis. (Bottom left) Change in wall shear stress between normal and 75% stenosis geometries. (Bottom right) Percentage of surface area with the given binned change in wall shear stress from the diastolic geometry to the stenosed geometry, over the region of the stenosis.
To quantify these differences in wall shear stress, we compute the proportion of vessel surface area around the stenosis with given changes in wall shear stress. For this region, figure 8 shows how the distribution of the proportion of surface area with a given wall shear stress change evolves from the 25% to the 50% and 75% stenoses. As the stenosis percentage increases above 25%, we note significant portions of surface area have very high increases in wall shear stress. Further, the regions of potentially relevant decreases in wall shear stress also expand with stenosis development. Therefore, a stenosis percentage in the range of 25% to 50% may indicate a critical threshold for wall shear stress change in this patient geometry.
3.3. Progressive development of an aneurysm
The developed framework also provides a method for investigating the relationship of hemodynamic parameters with morphological change in an aneurysm. Development of aneurysms in the coronary arteries is associated with Kawasaki disease [27]. Previous computational studies have established that these coronary aneurysms are associated with abnormal flow patterns, including substantially decreased wall shear stress [8]. Patient-specific flow simulations have the potential to improve predictions of the risk of thrombosis associated with a patient’s aneurysm [28]. These studies could be extended to investigate whether low wall shear stress is associated with further aneurysm development, as hypothesized for cerebral aneurysms [14, 29].
Flow simulations are conducted in the three aneurysmal geometries from section 2.1 to show how the mapping introduced here could be applied to quantitatively study a hypothetical relationship between aneurysm development and low wall shear stress. Simulation results from the diastolic geometry are mapped on the aneurysmal geometries to show how wall shear stress changes. For each successive degree of aneurysm expansion, figure 9 shows how the change in wall shear stress is distributed over the surface area of the aneurysm. As expected, we find that larger decreases in wall shear stress occur over the progression of aneurysm development.
Figure 9.
(Left) Percentage of surface area with the given binned change in wall shear stress from the diastolic geometry to the aneurysmic geometry, over the region of the aneurysm denoted in figure 8. (Right) Change in wall shear stress as a function of vertex displacement, where positive and negative displacement indicate expansion and compression, respectively.
Further, the new tool provides a platform for investigating the relationship between displacement and the change in wall shear stress. Figure 9 plots the change in wall shear stress as a function of displacement over the aneurysm surface. The R2 values for the best linear fit lines are 0.419, 0.560, and 0.537 for the 25%, 50%, and 75% aneurysms, respectively. For this artificial example, we can conclude that there is some relationship between aneurysm development and decreasing wall shear stress. Therefore, the method for mapping simulation results allows for investigating whether changes in the wall shear stress distribution are associated with morphological changes and, potentially, indicative of future aneurysm progression.
4. Conclusions
In this paper, we have presented a framework for comparing CFD simulation results in patient-specific geometries corresponding to different time points. This framework uses the centerlines of the geometries to represent the tree-like structure of the vascular geometries and systematically divides the vascular geometries into branches. Within each branch, the centerline forms the basis of a mapping which identifies homologous positions on the surface of the two geometries. The identification of homologous positions allows for simulation results from two different geometries to be mapped onto a single geometry, enabling the difference in hemodynamic factors to be directly computed at a given position. The resulting framework is sufficiently general to handle the complexity of most vascular geometries and, as a post-processing tool, is not limited to use with a specific CFD solver.
We have presented a set of representative application cases for an LAD coronary artery. First, we considered the difference between simulation results in two LAD geometries, segmented during the systolic and diastolic phases of the cardiac cycle. Second, we considered the development of a stenosis and an aneurysm in the LAD. In each case, the mapping was used to put CFD simulation results from the multiple geometries on a common frame of reference to facilitate analysis. We believe that such an analysis tool will expand the utility of patient-specific CFD simulations. Further applications could be made to clarify how data from different imaging modalities influences CFD simulations in reconstructed geometries, as in [11].
Acknowledgments
We thank Daniel Puleri and Mahsa Dabagh for helpful comments that improved the manuscript. We also thank Jane Leopold for arranging access to imaging data at Brigham and Women’s Hospital. Research reported in this publication was supported by the Office of the Director, National Institutes of Health under Award Number DP5OD019876. The content is solely the responsibility of the authors and does not necessarily represent the official views of the National Institutes of Health. We also acknowledge support from the Big Data-Scientist Training Enhancement Program (BD-STEP) of the Department of Veterans Affairs and from the Hartwell Foundation.
Footnotes
Publisher's Disclaimer: This is a PDF file of an unedited manuscript that has been accepted for publication. As a service to our customers we are providing this early version of the manuscript. The manuscript will undergo copyediting, typesetting, and review of the resulting proof before it is published in its final citable form. Please note that during the production process errors may be discovered which could affect the content, and all legal disclaimers that apply to the journal pertain.
References
- 1.Taylor CA, Fonte TA, Min JK. J Am Coll Cardiol. 2013;61(22):2233–2241. doi: 10.1016/j.jacc.2012.11.083. [DOI] [PubMed] [Google Scholar]
- 2.Sforza D, Putman C, Tateshima S, Vinuela F, Cebral J. AJNR Am J Neuroradiol. 2012;33(6):1115–1120. doi: 10.3174/ajnr.A2908. [DOI] [PMC free article] [PubMed] [Google Scholar]
- 3.Chatzizisis YS, Coskun AU, Jonas M, Edelman ER, Feldman CL, Stone PH. J Am Coll Cardiol. 2007;49(25):2379–2393. doi: 10.1016/j.jacc.2007.02.059. [DOI] [PubMed] [Google Scholar]
- 4.Myers J, Moore J, Ojha M, Johnston K, Ethier C. Ann Biomed Eng. 2001;29(2):109–120. doi: 10.1114/1.1349703. [DOI] [PubMed] [Google Scholar]
- 5.Torii R, Keegan J, Wood N, Dowsey A, Hughes A, Yang G, Firmin D, Mcg Thom S, Xu X. Br J Radiol. 2009;82:S24–S32. doi: 10.1259/bjr/62450556. [DOI] [PubMed] [Google Scholar]
- 6.Torii R, Keegan J, Wood NB, Dowsey AW, Hughes AD, Yang GZ, Firmin DN, Thom SAM, Xu XY. Ann Biomed Eng. 2010;38(8):2606–2620. doi: 10.1007/s10439-010-0008-4. [DOI] [PubMed] [Google Scholar]
- 7.Malek AM, Alper SL, Izumo S. J Am Med Assoc. 1999;282(21):2035–2042. doi: 10.1001/jama.282.21.2035. [DOI] [PubMed] [Google Scholar]
- 8.Sengupta D, Kahn AM, Burns JC, Sankaran S, Shadden SC, Marsden AL. Biomech Model Mechanobiol. 2012;11(6):915–932. doi: 10.1007/s10237-011-0361-8. [DOI] [PMC free article] [PubMed] [Google Scholar]
- 9.Gounley J, Chaudhury R, Vardhan M, Driscoll M, Pathangey G, Winarta K, Ryan J, Frakes D, Randles A. Engineering in Medicine and Biology Society (EMBC). 2016 IEEE 38th Annual International Conference of the, IEEE; 2016; pp. 3429–3432. [DOI] [PMC free article] [PubMed] [Google Scholar]
- 10.Boyd AJ, Kuhn DC, Lozowy RJ, Kulbisky GP. J Vasc Surg. 2016;63(6):1613–1619. doi: 10.1016/j.jvs.2015.01.040. [DOI] [PubMed] [Google Scholar]
- 11.Timmins LH, Suo J, Eshtehardi P, Molony DS, McDaniel MC, Oshinski JN, Giddens DP, Samady H. Int J Cardiovasc Imaging. 2016;32(9):1327–1336. doi: 10.1007/s10554-016-0918-9. [DOI] [PubMed] [Google Scholar]
- 12.Bulant C, Blanco P, Talou GM, Bezerra CG, Lemos P, Feijóo R. J Biomech. 2017;51:65–76. doi: 10.1016/j.jbiomech.2016.11.070. [DOI] [PubMed] [Google Scholar]
- 13.Jou LD, Wong G, Dispensa B, Lawton MT, Higashida RT, Young WL, Saloner D. Am J Neuroradiol. 2005;26(9):2357–2363. [PMC free article] [PubMed] [Google Scholar]
- 14.Boussel L, Rayz V, McCulloch C, Martin A, Acevedo-Bolton G, Lawton M, Higashida R, Smith WS, Young WL, Saloner D. Stroke. 2008;39(11):2997–3002. doi: 10.1161/STROKEAHA.108.521617. [DOI] [PMC free article] [PubMed] [Google Scholar]
- 15.Matl S, Brosig R, Baust M, Navab N, Demirci S. Med Image Anal. 2017;35:1–17. doi: 10.1016/j.media.2016.05.005. [DOI] [PubMed] [Google Scholar]
- 16.Gounley J, Vardhan M, Randles A. Proceedings of the Platform for Advanced Scientific Computing Conference; ACM; 2017. p. 2. [Google Scholar]
- 17.Randles AP, Kale V, Hammond J, Gropp W, Kaxiras E. Parallel & Distributed Processing (IPDPS). 2013 IEEE 27th International Symposium on, IEEE; 2013; pp. 1063–1074. [Google Scholar]
- 18.Randles A, Draeger EW, Oppelstrup T, Krauss L, Gunnels JA. Proc. International Conference for High Performance Computing, Networking, Storage and Analysis; ACM; 2015. p. 1. [Google Scholar]
- 19.Ku DN. Annu Rev Fluid Mech. 1997;29(1):399–434. [Google Scholar]
- 20.Hamdan A, Asbach P, Wellnhofer E, Klein C, Gebker R, Kelle S, Kilian H, Huppertz A, Fleck E. JACC: Cardiovasc Imaging. 2011;4(1):50–61. doi: 10.1016/j.jcmg.2010.10.007. [DOI] [PubMed] [Google Scholar]
- 21.Radaelli A, Peiro J. Int J Numer Method Biomed Eng. 2010;26(1):3–34. doi: 10.1002/cnm.1235. [DOI] [PMC free article] [PubMed] [Google Scholar]
- 22.Mendonca AM, Campilho A. IEEE Trans Med Image. 2006;25(9):1200–1213. doi: 10.1109/tmi.2006.879955. [DOI] [PubMed] [Google Scholar]
- 23.Doyle BJ, Callanan A, Burke PE, Grace PA, Walsh MT, Vorp DA, McGloughlin TM. J Vasc Surg. 2009;49(2):443–454. doi: 10.1016/j.jvs.2008.08.064. [DOI] [PMC free article] [PubMed] [Google Scholar]
- 24.Vignon-Clementel IE, Figueroa C, Jansen K, Taylor C. Comput Methods Biomech Biomed Engin. 2010;13(5):625–640. doi: 10.1080/10255840903413565. [DOI] [PubMed] [Google Scholar]
- 25.Wellnhofer E, Osman J, Kertzscher U, Affeld K, Fleck E, Goubergrits L. Atherosclerosis. 2010;213(2):475–481. doi: 10.1016/j.atherosclerosis.2010.09.007. [DOI] [PubMed] [Google Scholar]
- 26.Yamamoto E, Siasos G, Zaromytidou M, Coskun AU, Xing L, Bryniarski K, Zanchin T, Sugiyama T, Lee H, Stone PH, et al. Circ Cardiovasc Interv. 2017;10(8):e005455. doi: 10.1161/CIRCINTERVENTIONS.117.005455. [DOI] [PubMed] [Google Scholar]
- 27.Kato H, Sugimura T, Akagi T, Sato N, Hashino K, Maeno Y, Kazue T, Eto G, Yamakawa R. Circulation. 1996;94(6):1379–1385. doi: 10.1161/01.cir.94.6.1379. [DOI] [PubMed] [Google Scholar]
- 28.Sengupta D, Kahn AM, Kung E, Moghadam ME, Shirinsky O, Lyskina GA, Burns JC, Marsden AL. Biomech Model Mechanobiol. 2014;13(6):1261–1276. doi: 10.1007/s10237-014-0570-z. [DOI] [PMC free article] [PubMed] [Google Scholar]
- 29.Sforza DM, Kono K, Tateshima S, Viñuela F, Putman C, Cebral JR. J Neurointerv Surg. 2016;8(4):407–412. doi: 10.1136/neurintsurg-2014-011339. [DOI] [PubMed] [Google Scholar]


