Abstract
The epithelial integrity is maintained by the cytoskeleton and cell adhesion. However, it remains unknown how deregulated cytoskeleton is associated with cancer. We identified Cancer-related Regulator of Actin Dynamics (CRAD) as frequently mutated or transcriptionally downregulated in colorectal cancer (CRC). We found that CRAD stabilizes the cadherin-catenin-actin (CCA) complex via capping protein inhibition. CRAD loss inhibits F-actin polymerization and subsequently disrupts the CCA complex, which leads to β-catenin release and Wnt signaling hyperactivation. In mice, CRAD knockout induces the epithelial cell integrity loss and Wnt signaling activation, resulting in intestinal mucinous adenoma development. With APC mutation, CRAD knockout initiates and accelerates mucinous and invasive adenoma development in the colorectum. These results define CRAD as a tumor suppressor, of which inactivation deregulates the cytoskeleton and hyperactivates Wnt signaling, initiating mucinous CRC. Our study reveals the unexpected roles of an actin cytoskeletal regulator in maintaining epithelial cell integrity and suppressing tumorigenesis.
Epithelial monolayer integrity is maintained to significant extents via cell-cell adhesion, the cytoskeleton, and basement membrane interaction1–3. Cell adhesion proteins and the cytoskeleton are intimately associated, with prime examples being the E-cadherin-catenin complex and filamentous actin (F-actin). E-cadherin participates in cell adhesion and contact inhibition, being part of a large complex composed of catenins and additional proteins (e.g., α-, β-, and p120-catenin, vinculin, α-actinin, and eplin) that is stabilized by interactions with F-actin2–5. F-actin polymerization, which involves the addition of ATP-globular actin (G-actin) at the barbed (+) end of filaments, is controlled by capping proteins (CPs) and CP regulators6. CPs directly bind to and block the barbed (+) end of filaments or to ATP-G-actin, resulting in inhibition of actin assembly. Several CP regulators control CPs. For example, Formins and ENA/VASP compete with CPs for actin binding7, 8. Alternatively, V-1 and phospholipids, bind to CPs and prevent CPs interactions with actin9, 10. Given that F-actin stabilizes the E-cadherin-catenin complex for the maintenance of epithelial cell integrity, we hypothesized that reduced epithelial cell integrity through deregulation of the cytoskeleton and the E-cadherin-catenin complex contributes to tumorigenesis. Our unbiased and comprehensive approaches identified CRAD (Cancer-related Regulator of Actin Dynamics; KIAA1211, hereafter referred as CRAD) as a tumor suppressor in CRC.
CRAD is markedly mutated in small cell lung cancer (SCLC) patient samples, having a ranking of third following TP53 and RB111. Herein, our comprehensive approaches reveal that CRAD inactivation initiates mucinous intestinal tumorigenesis by disrupting the epithelial cell integrity.
CRAD inactivation in CRC
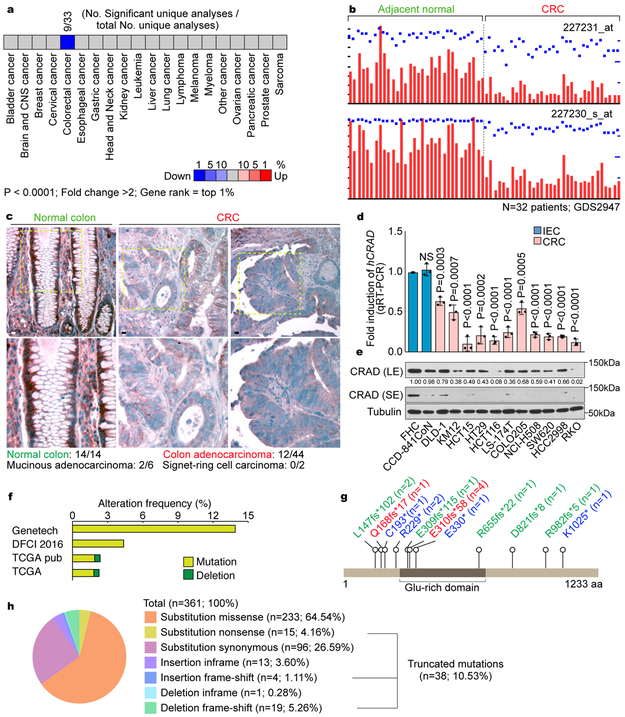
To identify potential tumor suppressor genes specifically inactivated in CRC, we selected genes in which expression is significantly downregulated in CRC. Analysis of Oncomine datasets showed that the transcriptional level of CRAD/KIAA1211 was notably downregulated in CRC samples (Fig. 1a). Analysis of GEO datasets also indicated the significant downregulation of CRAD mRNA in CRC, compared to the adjacent normal samples (Fig. 1b). Immunohistochemistry (IHC) of tissue microarray (TMA) also showed decreased CRAD in CRC (Fig. 1c, Table S1). Furthermore, CRC cells exhibited the reduced CRAD mRNA expression (Fig. 1d) and protein levels (Fig. 1e), compared to intestinal epithelial cells (IECs). Additionally, CRAD alleles harbor nonsense mutations in CRC patient samples and CRC cell lines (Figs. 1f-1h, S1). Interestingly, in the CRC cell lines not carrying genetic mutations in CRAD, transcriptional downregulation of CRAD was observed (Fig. 1d), which was restored by inhibition of methyltransferase (Fig. S1c). These results suggest that CRAD is inactivated by genetic mutation or transcriptional downregulation in CRC.
Figure 1. CRAD inactivation in CRC.
a, Oncomine analysis of CRAD expression in human cancers.
b, GEO (GDS2947) analysis of CRAD expression in adjacent normal tissues vs. colorectal adenoma tissues. n=32 patients; probes: 227231_at and 227230_s_at.
c, IHC of CRAD in normal colon and colorectal adenocarcinoma. Images are representative of 14 normal colon and 38 CRC samples.
d and e, CRAD expression in IECs and CRC cells. qRT-PCR (d; n=3 independent experiments) and IB (e) analyses. The representative images are shown from three independent IB experiments.
f, Genetic alteration of CRAD. cBioportal datasets: Genentech 2012 (n=72 patient samples); TCGA pub 2012 (n=212 patient samples); TCGA provisional (n=220 patient samples); DFCI 2016 (n=619 patient samples).
g and h, COSMIC analysis of CRAD mutations in CRC. n values indicate patient sample number.
Scale bars indicate 50μm; Error bars: mean ± S.D.; NS: not significant (P>0.05); Two-sided unpaired t-test.
Positive regulation of the actin polymerization by CRAD
Given the mutation or downregulation of CRAD in CRC, we hypothesized that CRAD is a tumor suppressor in CRC. To test this, we examined whether CRAD inactivation is involved in cell transformation-related cell morphological change12, as reflected in the respective cell morphologies and actin distributions of IECs versus CRC cell lines (Figs. S2a, S2b). We found that CRAD depletion (Figs. S2c, S2d) induced IEC shrinkage (Figs. S2e, S2f), indicated by reduced cell areas and decreased Phalloidin staining, a marker for F-actin (Fig. S2g). Conversely, CRAD ectopic expression increased cell area in CRC cells, with an elevated presence of the actin cytoskeleton (Figs. S2h-S2k). These results suggest that CRAD increases the actin cytoskeleton formation.
CRAD: an inhibitor of capping proteins
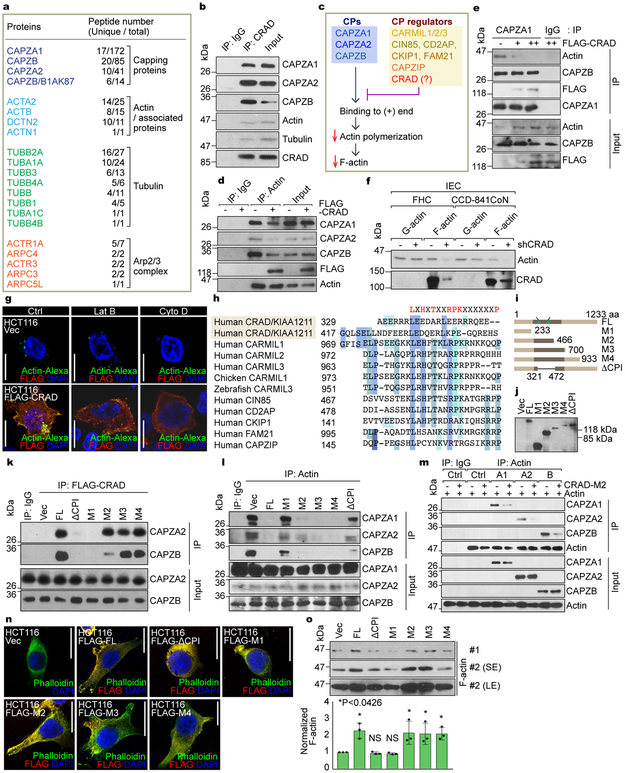
Given the enhanced actin cytoskeleton by CRAD, we sought to dissect its detailed molecular mechanism. Employing the tandem affinity purification and mass spectrometry, we identified CRAD-interacting proteins: CPs, actin/tubulin-associated proteins, and the Arp2/3 protein complex (Fig. 2a, Table S2). CPs (CAPZA1, CAPZB, and CAPZA2) exhibited the high scores with regards to peptide numbers. Co-immunoprecipitation (co-IPs) from cell lysates as well as pull-down assays of purified proteins validated the endogenous and direct interaction between CRAD and CPs, respectively (Figs. 2b, S2l). Thus, we hypothesized that CRAD enhances the F-actin polymerization by inhibiting CPs (Fig. 2c). We examined whether CRAD interferes with the binding of CPs to actin. Co-IP assays showed that ectopic CRAD reduced the interaction between CPs and actin (Fig. 2d, 2e). F-actin controls the cytoskeletal dynamics and stretched cell morphologies (Figs. S2e-S2k)13–15. For F-actin assembly, monomeric G-actin undergoes polymerization at the barbed (+) end through a conformational change, represented by the high ratio of F-actin to G-actin. The fractionation of F-/G-actin indicated decreased F-actin levels in CRAD-depleted IECs (Figs. 2f, S2m). Conversely, CRAD ectopic expression increased F-actin in CRC cells (Figs. S2n, S2o), consistent with the Phalloidin staining. Having determined that CPs directly bind to the barbed (+) end of F-actin and inhibit the F-actin polymerization6, we next asked whether CRAD sequesters CPs from F-actin and increases the uncapped barbed (+) ends of F-actin. Visualizing the uncapped barbed (+) ends 16 showed that the ectopic expression of CRAD increased uncapped barbed (+) ends (Fig. 2g). Additionally, highly expressed CRAD increased the uncapped barbed (+) ends in the Latrunculin B (Lat B, an inhibitor of monomeric G-actin)-treated condition but not in the Cytochalasin D (Cyto D, a blocker of barbed [+] end)-treated condition (Fig. 2g). These results suggest that CRAD-upregulated the actin polymerization is mainly due to the increase of the extendable barbed (+) end by inhibiting CPs, independently of the increase of monomeric G-actin. Direct CP regulators including CARMILs, FAM21, and CD2AP harbor a capping protein interaction (CPI) motif6. Interestingly, CRAD also contains two potential CPI motifs at 329 and 417 amino acid residues (Fig. 2h). To determine whether these predicted CPI motifs in CRAD are required for CP inhibition, we constructed CRAD mutants (M1-M4, ΔCPI; Figs. 2i, 2j). Co-IP showed that unlike FL (full-length) and M2-M4 mutants, M1 and ΔCPI mutants (lacking CPI motifs) did not bind to CPs (Fig. 2k), and failed to inhibit the interaction of CPs with actin (Fig. 2l). Also in vitro protein binding assays using the purified proteins of actin, CPs, and CRAD-M2 (Fig. S2p) showed that CRAD inhibited the actin-CP binding (Figs. 2m, S2q). Moreover, in CRC cells, M1 and ΔCPI mutants failed to induce a stretched cell morphology (Fig. 2n) and F-actin polymerization (Fig. 2o), whereas other mutants did (M2-M4; Figs. 2n, 2o). These data suggest that CRAD downregulates the interaction between CPs and the barbed (+) ends via the CPI motifs in CRAD, which increases F-actin polymerization (Fig. S3).
Figure 2. Positive regulation of the actin polymerization by CRAD-inhibited capping proteins.
a, CRAD-interacting proteins identified by tandem affinity purification and mass spectrometry (TAP-MS) (see Table S2). TAP-MS was performed once.
b, The endogenous interaction of CRAD with CPs, actin, and tubulin. FHC cell lysates were analyzed for co-IP.
c, Illustration of the hypothetical model of CRAD-induced actin polymerization.
d and e, The decreased interaction between CPs and actin by CRAD. The reciprocal co-IP analysis of HCT116 cells transfected with FLAG-CRAD plasmid, with either actin (d) or CAPZA1 antibodies (e).
f, Decreased F-actin by CRAD depletion in IECs. Fractionation and IB assays of F-/G-actin.
g, The increase of uncapped barbed (+) ends by CRAD. Cells were permeabilized by the saponin-containing buffer for visualization of uncapped barbed (+) ends using Super Resolution microscope. Images are representative of two independent experiments (n=3 each independent samples) with similar results.
h, Comparative amino acid sequence analysis of potential CPI motifs in CRAD with those in known CP regulators.
i and j, The generation of CRAD mutant constructs (i) and IB assays (j). IB was performed once.
k and l, CRAD-CPs binding via CPI motifs. The reciprocal co-IP analysis of HCT116 cell lysates transfected with FLAG-CRAD (FL, ΔCPI, and M1-M4) plasmids, with either FLAG (k) or actin antibodies (l).
m, The decreased interaction between CAPZs and actin by CRAD. Direct binding and blocking were analyzed by co-IP assay using purified recombinant proteins.
n and o, The increase of F-actin formation by ectopic expression of CPI motifs-containing CRAD mutants. After 24hr transfection with each plasmid, HCT116 CRC cells were visualized by Phalloidin IF staining (n). Images are representative of three independent experiments (n=3 each independent samples) with similar results. Cells were also fractionated into F-actin and G-actin and analyzed for IB (o; upper), (normalized by G-actin expression using ImageJ [u; lower]). SE/LE: short or long exposure.
Scale bars indicate 20μm; Data in panels b, d-f, k-m, and o are from n=3 independent experiments; Error bars: mean ± S.D.; NS: not significant (P>0.05); Two-sided unpaired t-test.
CRAD loss-activated Wnt signaling by disrupting the CCA complex
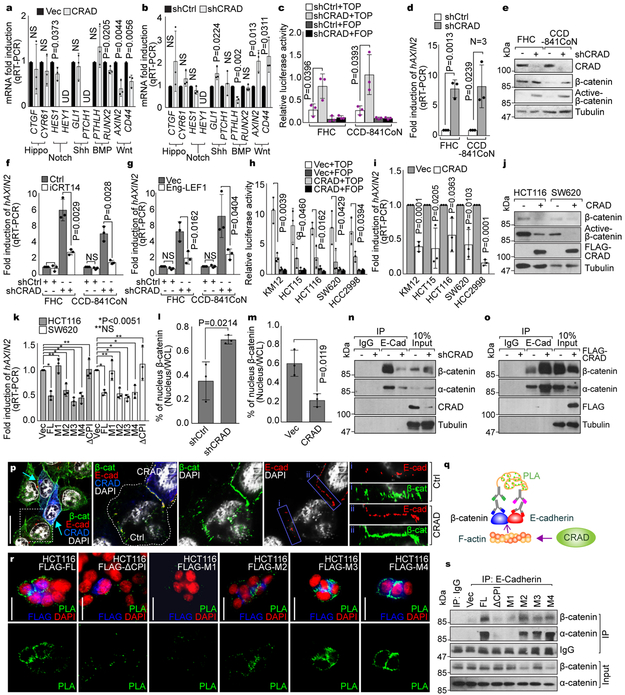
Next, we sought to determine how CRAD-modulated actin cytoskeleton is associated with intestinal tumorigenesis. Owing to deregulation of various developmental pathways in CRC, we examined the effects of CRAD on Wnt, Hedgehog, BMP, Notch, and Hippo signaling. Interestingly, CRAD overexpression downregulated Wnt/β-catenin target genes (AXIN2 and CD44; Fig. 3a). Conversely, in IECs, CRAD depletion augmented Wnt/β-catenin target gene expression (Fig. 3b). Additionally, CRAD expression is mutually exclusive to the expression of AXIN2 in CRC (Fig. S4a). Consistently, the level of nuclear β-catenin in IECs and CRC cell lines was inversely correlated with the expression of CRAD (Fig. S4b). These results imply that CRAD might be negatively associated with Wnt/β-catenin signaling. Indeed, CRAD depletion increased β-catenin reporter activity, AXIN2 expression, and the level of active β-catenin in IECs (Figs. 3c-3e). Importantly, treatment of cells with iCRT14, an inhibitor of β-catenin-TCF binding, suppressed CRAD depletion-induced β-catenin reporter activation (Fig. 3f). Also, Engrailed-LEF1 (Eng-LEF1), a dominant-negative mutant blocking β-catenin-mediated gene activation17, suppressed AXIN2 upregulation in CRAD-depleted IECs (Fig. 3g). These results indicate that CRAD knockdown-induced upregulation of the β-catenin reporter and target genes is due to β-catenin-mediated transcriptional activation.
Figure 3. Loss of CRAD-activated Wnt signaling by disrupting CCA complex.
a, Decreased Wnt signaling target genes by CRAD. 24hr after transfection, HCT116 cells were analyzed for qRT-PCR.
b, Increased Wnt signaling target genes by CRAD knockdown. CRAD-depleted CCD-841CoN cells were analyzed for qRT-PCR.
c and d, Increased β-catenin transcriptional activity by CRAD depletion. IECs were transfected with β-catenin reporter plasmids (TOP/FOPFLASH) for luciferase assays (c). qRT-PCR for AXIN2 (d).
e, Increased β-catenin protein by CRAD depletion in IECs. IB assays.
f and g, Inhibition of CRAD depletion-induced AXIN2 upregulation by iCRT14 (f) or Eng-LEF1 (g). 24hr after iCRT14 (an inhibitor of β-catenin-TCF binding; 100μM) treatment or Eng-LEF1 (a dominant-negative mutant blocking β-catenin-mediated gene activation) transient transfection, IECs were analyzed for qRT-PCR.
h-j, Suppression of β-catenin transcriptional activity by CRAD in CRC cells. 24hr after transfection, CRC cells were analyzed for TOP/FOPFLASH luciferase analysis (h), qRT-PCR of AXIN2 (i), and IB for β-catenin (j). Experiment performed once.
k, The inhibition of β-catenin target gene expression by CPI motif-containing CRAD mutants. 24hr after transfection, CRC cells were analyzed for TOP/FOPFLASH luciferase activity.
l, Decreased nuclear β-catenin by CRAD. IECs (l) and CRC cells (m) were transfected with shCtrl or shCRAD and Vec or CRAD, respectively. After 48hr, cells were fractionated into the cytosolic and nucleus fractions, followed by IB. Quantification of nucleus β-catenin was assessed using ImageJ.
n, Decreased interaction between E-cadherin and catenins by CRAD depletion. Co-IP assays of shCRAD-CCD-841CoN. The representative images are shown from three independent experiments with similar results.
o and p, Increased interaction between E-cadherin and catenins by CRAD. HCT116 cells were transfected with FLAG-CRAD plasmid. Co-IP assays (o) and IF staining (p). Arrows indicate CRAD-expressing cells. Compared to i (non-transfected cells), ii (CRAD-expressing cells) displays the increased colocalization of E-cadherin and β-catenin by CRAD. The representative images are shown from three independent experiments with similar results.
q, Illustration of E-cadherin-β-catenin binding analysis using Duolink assays.
r and s, Restoration of E-cadherin-β-catenin binding by CPI motif-containing CRAD mutants in CRC cells. Duolink assay (r). Green (PLA) fluorescence indicates E-cadherin-β-catenin interaction. Co-IP analysis (s).
Representative images of three experiments with similar results; Scale bars indicate 20μm; Data in panels a-h and k-m are from n=3 independent experiments; Error bars: mean ± S.D.; NS: not significant (P>0.05); Two-sided unpaired t-test;
To complement this, we also examined the effects of CRAD ectopic expression on Wnt/β-catenin signaling in CRC cells. CRAD expression suppressed β-catenin reporter activity, AXIN2, and active β-catenin (Figs. 3h-3j). Moreover, the M1 and ΔCPI constructs failed to downregulate AXIN2 (Fig. 3k), suggesting that the CPI motifs in CRAD are required for suppression of β-catenin target gene activation.
Catenin proteins connect E-cadherin to the actin cytoskeleton, which contributes to the maintenance of epithelial cell integrity through cell-cell adhesion4,5,18,19, and downregulates nuclear translocation of catenins20. Given the role of CRAD in modulating the actin cytoskeleton (Fig. 2), we asked whether CRAD has an impact on the interaction between catenins and E-cadherin. In IECs, CRAD knockdown increased the levels of β-catenin and α-catenin both in the cytosol and the nucleus (Figs. 3l, S4c). Conversely, CRAD expression decreased nuclear β-catenin in HCT116 CRC cells (Figs. 3m, S4d). Moreover, co-IP assays showed that CRAD knockdown reduced the interaction between E-cadherin and catenin proteins (Figs. 3n, S4e). Conversely, in CRC cells, CRAD overexpression induced the binding of catenin proteins with E-cadherin (Figs. 3o, S4f). The Super Resolution microscopic analyses also showed that CRAD-expressing HCT116 cells displayed the increased β-catenin associated with E-cadherin at cell-cell adhesion (Figs. 3p, S4g). Since the actin cytoskeletal dynamics modulates E-cadherin-mediated cell adhesion5,18,21, we asked whether CRAD-modulation of the actin cytoskeleton affects E-cadherin-catenin binding. Duolink (Fig. 3q) and co-IP assays showed that the ectopic expression of the FL and M2-M4 mutants stabilized the E-cadherin-catenin complex, while M1 and ΔCPI mutants did not (Figs. 3r, 3s). We also checked β-catenin transcriptional activity under conditions of actin-cytoskeletal inhibition versus stabilization. Actin polymerization inhibitors (Lat B, Cyto D) increased the transcriptional activity of β-catenin, while an F-actin stabilizer (Jasplakinolide) reduced it (Figs. S4h, S4i). These results suggest that under normal conditions, CRAD enhances the actin polymerization via CP inhibition, which stabilizes the CCA complex. Conversely, upon CRAD inactivation, a diminished actin cytoskeleton destabilizes the CCA complex. This releases β-catenin from the cadherin, followed by nuclear translocation of β-catenin and activation of Wnt/β-catenin target genes (Fig. S4j).
Inhibition of CRC cell proliferation by CRAD
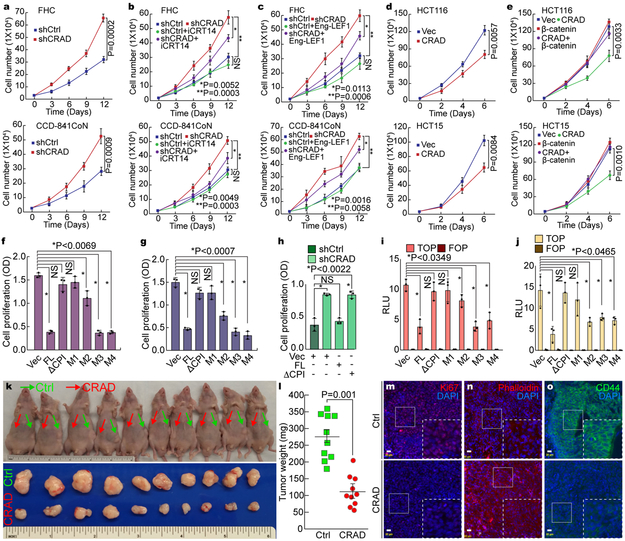
Having observed the inactivation of CRAD in CRC (see Fig. 1), and CRAD inactivation-induced Wnt/β-catenin signaling activation, we next determined the effects of CRAD on IEC and CRC cell proliferation. Given high expression of CRAD in IECs, we depleted endogenous CRAD in IECs using shRNA. CRAD knockdown increased IEC proliferation (Fig. 4a), reversed by iCRT14 (Figs. 4b, S5a, S5b) or Eng-LEF1 (Figs. 4c, S5c-S5e). These data indicate that CRAD depletion-induced IECs hyperproliferation is mediated by β-catenin target gene activation. Conversely, CRAD overexpression inhibited CRC cell proliferation (Figs. 4d, S5f-S5h), which was rescued by β-catenin (Figs. 4e, S5i-S5o). These results suggest that CRAD-induced CRC cell growth inhibition is mainly due to the suppression of β-catenin signaling. Additionally, unlike the FL and M2-M4 mutants, the ΔCPI and M1 constructs did not inhibit CRC cell proliferation (Figs. 4f, 4g, S5p, S5q). Importantly, CRAD depletion-induced IEC hyperproliferation was reverted by expression of FL, but not by expression of the ΔCPI mutant (Fig. 4h). Similarly, β-catenin reporter activity was downregulated by the FL and M2-M4 whereas the ΔCPI or M1 did not (Figs. 4i, 4j). These results suggest that the CPI motifs of CRAD are required to inhibit CRC cell proliferation.
Figure 4. Inhibition of CRC cell proliferation by CRAD.
a, IEC hyperproliferation by CRAD depletion. The proliferation of FHC and CCD-841CoN cells (shCtrl [control] and shCRAD) were analyzed by cell counting.
b and c, Suppression of shCRAD-induced cell hyperproliferation by β-catenin inhibition in IECs. FHC and CCD-841CoN (shCtrl and shCRAD) cells were treated with iCRT14 (100μM) for 14 days, and cell number was counted (b). IECs (shCtrl and shCRAD) were transfected with Eng-LEF1 and analyzed for cell proliferation (c).
d, CRC cell growth inhibition by CRAD expression. HCT116 and HCT15 cells (Vec [control] and CRAD expressing) were analyzed for cell proliferation.
e, β-catenin rescues CRAD-induced CRC cell growth inhibition. HCT116 and HCT15 cells were transfected with CRAD or β-catenin plasmids and analyzed for cell proliferation.
f-h, CRC cell growth inhibition by CPI motif-containing CRAD mutants. CRAD (FL, ΔCPI, and M1-M4)-transfected CRC cells were analyzed for cell proliferation. HCT116 (f); SW620 cells (g). CCD-841CoN cells were transfected with each plasmid and analyzed for cell proliferation (h).
i and j, Suppression of β-catenin reporter by CPI motif-containing CRAD mutants. HCT116 (i) and SW620 (j) cells transfected with CRAD FL or mutant constructs were analyzed for luciferase activity.
k-o, Inhibition of ex vivo tumor development by CRAD. HCT116 (control [Ctrl]) and HCT116-CRAD cells were subcutaneously injected into the left flank (control; green arrows; k) and the right flank (CRAD-expressing; red arrows; k), and analyzed for tumor weight (l; n=10 mice) and IHC (m-o); Ki67 (m); Phalloidin (n); CD44 (o). These experiments (k and l) were performed once.
Scale bars indicate 20μm; Data in panel a-j and o are from n=3 independent experiments; Error bars: mean ± S.D.; NS: not significant (P>0.05); Two-sided unpaired t-test.
Furthermore, xenograft transplantation assays showed that compared to HCT116, HCT116-CRAD injected mice exhibited the reduced tumor development (Figs. 4k, 4l), with notably decreased cell proliferation, increased F-actin, and downregulated β-catenin target (Figs. 4m-4o). These in vitro and ex vivo results suggest that CRAD inhibits CRC proliferation via suppression of β-catenin.
Intestinal adenoma development by CRAD KO
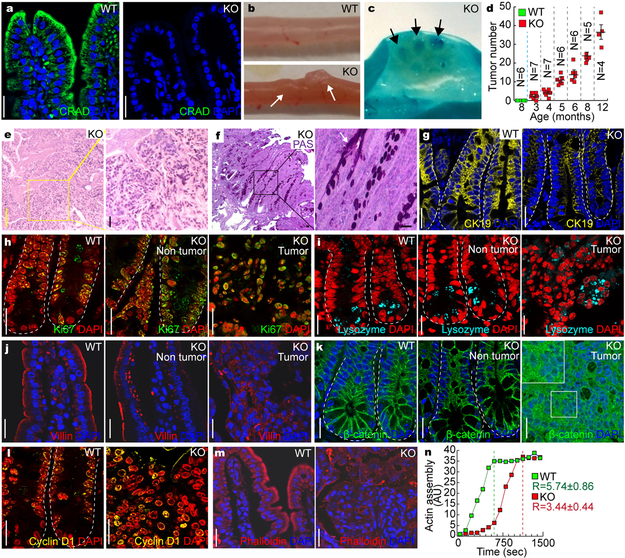
To address in vivo consequence of CRAD gene inactivation in CRC, we established a CRAD knockout (KO) mouse model (Figs. 5a, S6a-6d). Importantly, CRAD KO mice displayed adenoma development in the small intestine (Figs. 5b, 5c), in an age-dependent manner (Fig. 5d). Additionally, we found that CRAD KO mouse showed the decreased Wnt/β-catenin target genes without the alteration of other signalings (Fig. S6e). Intriguingly, CRAD KO mice also developed pulmonary lesions resembling the early small cell lung cancer and solid pseudopapillary neoplasm (SPN) of the pancreas (Figs. S6f, S6g). These results are somewhat supported by the previous studies showing high mutation rates of CRAD in SCLC11, and the constitutively active mutation of β-catenin in SPN of the pancreas22. Interestingly, mucin deposition in CRAD KO-induced intestinal adenoma was observed by H&E staining and Periodic Acid-Schiff (PAS) staining (Figs. 5e, 5f). Moreover, CRAD KO tumors displayed the heterogeneous loss of epithelial cell integrity (H&E, CK19; Figs. 5e, 5g, S6h). The loss of epithelial cell integrity is known to induce mucosal secretion and intestinal inflammation23. Of note, CRAD KO mice displayed the slightly increased intestinal inflammation (Figs. S6i, S6j). We also observed cell hyperproliferation in CRAD KO mice, indicated by the elevated number of Ki67- and phospho-Histone H3 (pHH3)-positive cells (Figs. 5h, S6k-S6n) without notable differences in cell death (Fig. S6o). Additionally, IHC results for lysozyme (Paneth cells) and chromogranin A (neuroendocrine cells) indicated an increase in Paneth cells and a decrease in neuroendocrine cells in the CRAD KO intestine (Figs. 5i, S6p), which might be because canonical Wnt signaling induces Paneth cell differentiation24. Given that CRAD depletion activates Wnt/β-catenin signaling by disrupting the CCA complex (see Fig. 3), we also examined cell-cell adhesion. CRAD KO mice showed the disorganized localization of E-cadherin and Villin (Figs. 5j, S6q). Additionally, β-catenin and its target genes were upregulated in CRAD KO mice (Figs. 5k, 5l, S6r). Also, CRAD KO-induced intestinal tumors exhibited the disorganized and decreased levels of F-actin (Fig. 5m). Moreover, compared to WT, intestinal extracts from the CRAD KO showed the delayed rate in actin polymerization (Fig. 5n). These results strongly suggest that CRAD KO per se is sufficient to initiate intestinal tumorigenesis with the loss of epithelial cell integrity and the aberrant activation of Wnt/β-catenin signaling.
Figure 5. Intestinal adenoma development by CRAD KO.
a, CRAD expression in the small intestine. Immunohistochemistry (IHC) of mouse intestine. CRAD KO mouse serves as a negative control.
b and c, Intestinal adenoma development in CRAD KO mice. The adenomas in the small intestine of CRAD KO mice (3mo of age; b). Methylene blue staining (c). Arrows indicate intestinal adenoma.
d, Age-dependent intestinal adenoma development in CRAD KO mice. N values indicate the number of mice. Error bars: mean ± S.D. The experiment was performed once.
e, Hematoxylin and eosin (H&E) staining of intestinal adenoma (CRAD KO).
f, Periodic Acid-Schiff (PAS) staining of intestinal adenoma in CRAD KO mice.
g, Disruption of epithelial cell integrity. Cytokeratin 19 (CK19). Arrows: Villi not expressing CK19.
h, Cell hyperproliferation in CRAD KO small intestine. CRAD KOKi67.
i, Abnormal differentiation of IECs by CRAD KO. WT and CRAD KO small intestine were immunostained with Lysozyme.
j, Disorganized cell adhesion in CRAD KO mice. Cells were stained with Villin.
k, The increase of β-catenin in CRAD KO tumor.
l, Upregulation of β-catenin target genes in the intestinal adenoma of CRAD KO mice. IHC for Cyclin D1.
m, Disorganized actin cytoskeleton in CRAD KO-induced tumor. F-actin was visualized by Phalloidin staining.
n, The decrease of the actin polymerization in CRAD KO mice. Cell extracts from the small intestine were analyzed for actin polymerization assays. n=3 independent experiments. R values indicate the velocity of actin assembly.
Representative images of three independent mice per group (WT vs. KO); AU: arbitrary unit; Scale bars indicate 20μm.
Accelerated intestinal tumorigenesis by CRAD heterogeneous KO
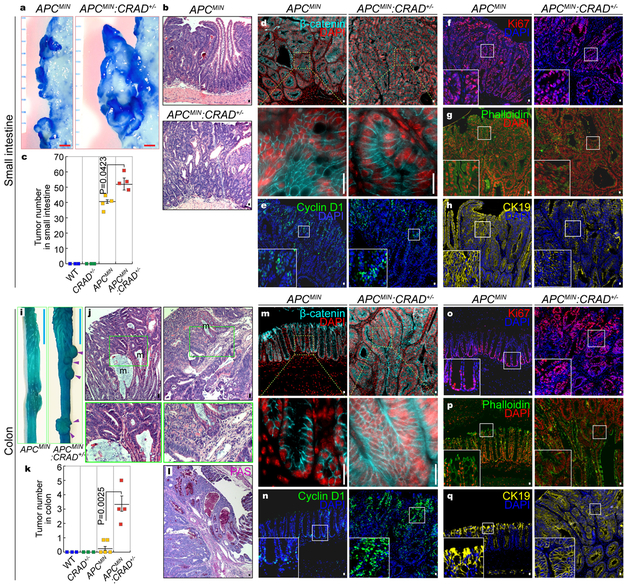
Given that CRAD gene mutations are often heterozygous in CRC patients (Fig. S7a), we asked whether genetic ablation of one allele of CRAD gene is associated with intestinal tumorigenesis. Compared to the APCMIN strain, APCMIN:CRAD+/− mice exhibited an evident increase in tumor numbers in the small intestine (Figs. 6a-6c) without the change in β-catenin or cell proliferation (Figs. 6d-6f). Furthermore, unlike adenomas from APCMIN, tumors of APCMIN:CRAD+/− displayed the loss of both F-actin (Fig. 6g) and epithelial cell properties (Fig. 6h), as observed in CRAD KO mice (see Figs. 5g, 5m).
Figure 6. Accelerated intestinal tumorigenesis by CRAD heterogeneous KO.
a, Representative images of intestinal tumors from the small intestine of APCMIN (n=4 mice) and APCMIN:CRAD+/− (n=4 mice) (4mo of age).
b and c, The increase of small intestinal tumors in APCMIN:CRAD+/− (n=4) mice, compared to APCMIN (n=4) mice. Representative H&E images of small intestinal tumors in APCMIN and APCMIN:CRAD+/− mice (b). Quantification of adenomas (4mo of age; c).
d-h, IHC of intestinal tumors from the small intestine of APCMIN and APCMIN:CRAD+/− mice. β-catenin (d); Cyclin D1 (e); Ki67 (f); Phalloidin (g); CK19 (h).
i, Colorectal tumors in APCMIN:CRAD+/− (n=4) mice (4mo of age; Arrowheads).
j, H&E staining of the colorectal tumors in APCMIN:CRAD+/− mice. m: mucin-accumulated lesion. 4mo of age. n=3.
k, Comparative analysis of colorectal tumors (4mo of age). WT (n=3 mice); CRAD+/− (n=3 mice); APCMIN (n=5 mice); APCMIN:CRAD+/− (n=4 mice.)
l, PAS staining of colorectal tumors in APCMIN:CRAD+/− mice.
m-q, IHC of colorectal tumors from APCMIN and APCMIN:CRAD+/− mice (4mo of age). β-catenin (m); Cyclin D1 (n); Ki67 (o); Phalloidin (p); CK19 (q).
Images of panel b, d-h, j, and l-q are representative of IHC experiments from three independent tumors; Red scale bars indicate 1mm; Blue scale bars indicate 10mm; Black or white scale bars indicate 20μm; Error bars: mean ± S.D.; Two-sided unpaired t-test.
Whereas APCMIN mice barely develop tumors in the colorectum25, APCMIN:CRAD+/− compound mice displayed severely invasive and mucinous adenomas in the colon (Figs. 6i-6k). Intriguingly, colonic tumors of APCMIN:CRAD+/− mice showed a markedly increased accumulation of mucin (Fig. 6l), similar to human mucinous colorectal carcinoma (MC)26. Colonic adenomas from APCMIN:CRAD+/− mice also exhibited significant upregulation of β-catenin (Fig. 6m), Cyclin D1 (Figs. 6n, S7b, S7c), and cell hyperproliferation (Figs. 6o, S7d, S7e). Consistent with tumors in the small intestine, the heterogeneous loss of both F-actin and CK19 was also observed in colonic tumors of APCMIN:CRAD+/− mice (Figs. 6p, 6q). Moreover, we observed the invasive adenoma development in APCMIN:CRAD+/− mice, represented by the disruption of the basal membrane (Fig. S7f). Of note, both APCMIN and APCMIN:CRAD+/− mice did not display the expression of mesenchymal markers (Fig. S7g), implying that epithelial-mesenchymal transition might not be involved in invasive tumor development in APCMIN:CRAD+/− mice. These results suggest that, in conjunction with APC inactivation, the deletion of CRAD allele leads to intestinal tumorigenesis in both the small and large intestine, which reveals a pathologic outcome of CRAD heterozygous mutation during intestinal tumorigenesis.
Mucinous Intestinal tumorigenesis by CRAD KO
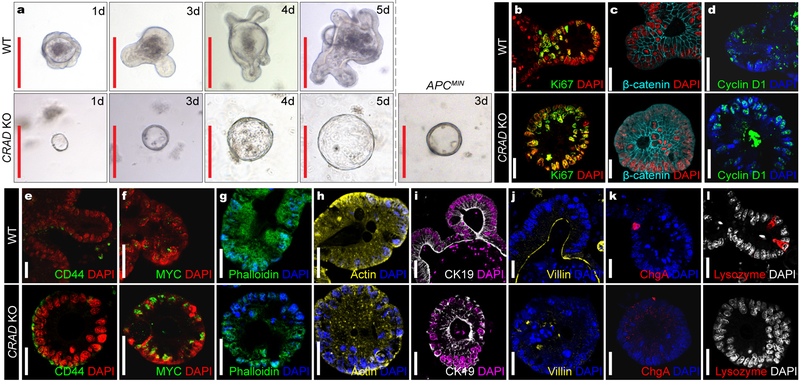
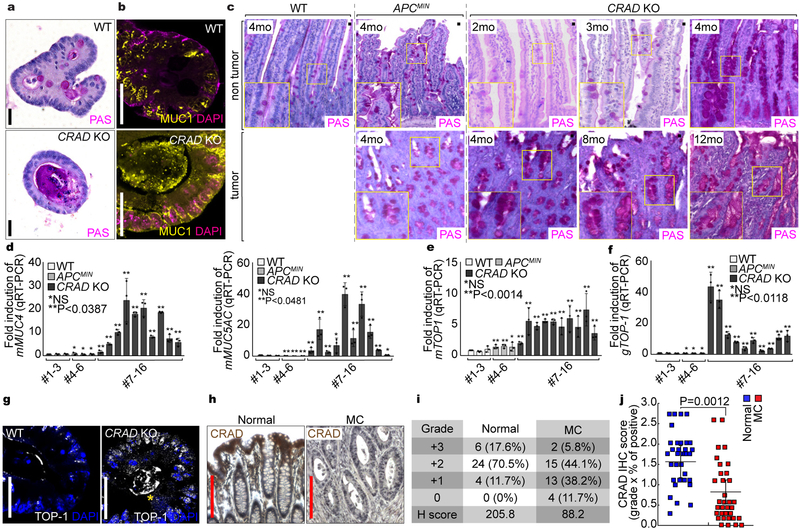
We next examined the mucinous tumor phenotype driven by CRAD KO. Transformation or early tumor lesions can be assessed by development of the cystic spheroid organoid formation instead of the normal crypt organoids27. Interestingly, CRAD KO developed the cystic spheroid as shown in APCMIN organoids (Fig. 7a). CRAD KO cystic organoids exhibited the increased cell proliferation (Figs. 7b, S8a), stabilized β-catenin (Figs. 7c, S8b), upregulated β-catenin target genes (Figs. 7d-7f), disrupted actin cytoskeleton (Figs. 7g, 7h), abnormality of epithelial cell integrity (Fig. 7i), disorganized cell adhesion (Fig. 7j), and decreased IEC differentiation (Figs. 7k, 7l). CRAD KO cystic organoids also displayed the high expression of mucins (Figs. 8a, 8b) as shown in CRAD KO tumors (see Figs. 5e, 5f), indicating that CRAD KO upregulates mucin expression in a cell-autonomous manner. The goblet cells secrete various mucins, and the number of the goblet cells is increased in the MC28, 29. Intriguingly, the non-tumor and tumor region of CRAD KO exhibited the increase in mucin expression (Figs. 8c, S8c) and the goblet cell number (Fig. S8d). qRT-PCR confirmed the marked upregulation of mMUC in CRAD KO tumors but not in APCMIN tumors (Figs. 8c, S8e). Despite the implication of Wnt-Notch signaling axis in the goblet cell differentiation30, only Wnt signaling target genes were upregulated by CRAD KO (Fig. S6e). MC is characterized by amplification of TOP-1 (Topoisomerase-1) allele31. We found that the CRAD KO tumors exhibited the increase in both mRNA and genomic DNA levels of TOP-1, whereas APCMIN tumors did not (Figs. 8e, 8f). Consistently, CRAD KO tumors and cystic spheroids also showed the upregulation of TOP-1 (Figs. 8g, S8f). Of note, TOP-1 upregulation (2mo; Fig. S8g) precedes mucin deposition (4mo; Figs. 8c, 8d, S8c). Furthermore, IHC of MC TMA showed the downregulation of CRAD expression in MC patient samples (Figs. 8h-8j). Oncomine datasets also indicated that CRAD expression is mutually exclusive to the expression of MUC5B and MUC5AC in MC (Fig. S8h). These data suggest that the loss or downregulation of CRAD is associated with the development of MC. Together, these results strongly suggest that the deletion of CRAD leads to the mucinous intestinal tumorigenesis.
Figure 7. Mucinous Intestinal tumorigenesis by CRAD KO.
a, Cystic spheroids formation by CRAD KO. Isolated crypts from WT, CRAD KO, and APCMIN were maintained in the organoid culture medium. These data are representative of three independent organoid experiments with similar results. 10 organoids per group [WT vs. KO] were analyzed.
b-l, IHC analysis of the organoids derived from CRAD WT and KO mouse intestine. Compared to WT, CRAD KO-driven cystic spheroids showed that increase of cell proliferation (Ki67; b), increase of β-catenin (c) and its target genes (Cyclin D1 [d]; CD44 [e]; MYC [f]), disruption of the actin cytoskeleton (Phalloidin [g]; Actin [h]), loss of epithelial cell integrity (CK19 [i]; Villin [j]), and decreased IEC lineage differentiation (Chromogranin A: ChgA; [k]; Lysozyme [l]).
Representative images of three experiments; Red scale bars indicate 20μm; White scale bars indicate 20μm.
Figure 8. Increased mucin deposition by CRAD KO.
a and b, Excessive mucin deposition in CRAD KO-induced cystic spheroids. PAS staining (a) and IHC of MUC1 (b) were performed using organoids from WT and CRAD KO mice.
c and d, Increased mucin deposition in CRAD KO-induced tumors. After fixation and paraffin embedding, each sample was stained with PAS (c). Increased mucin expression in CRAD KO tumors (qRT-PCR; d).
e-g, Upregulation of TOP-1 in CRAD KO tumors. WT intestine (#1–3) and tumors from APCMIN (#4–6) and CRAD KO (#7–16) were analyzed for TOP-1 mRNA (qRT-PCR; e; n=3) and genomic DNA (real-time PCR; f). After 5 days of culture, normal crypt organoid from CRAD WT and spheroid organoids from CRAD KO were immunostained with a TOP-1 antibody (g).
h-j, CRAD inactivation in MC patients. IHC of TMA with CRAD antibody, Images are representative of 34 patients samples (h). After scoring of CRAD expression, H-scores (i) and IHC scores (j) were calculated. Normal (n=34 patient samples) vs. MC (n=34 patient samples).
Images of panel a-c and g are representative of three independent experiments; Red scale bars indicate 200μm; black or white scale bars indicate 20μm; Data in panel d-f were obtained from n=3 independent experiments; Error bars: mean ± S.D.; NS: not significant (P>0.05); Two-sided unpaired t-test.
Discussion
APC mutation in CRC causes aberrant Wnt/β-catenin signaling activation. However, the β-catenin protein exhibits heterogeneous nuclear localization in the presence of the homogeneous mutation in APC32, 33. This ‘β-catenin paradox’ model32–35 suggests that further activation of APC mutation-driven Wnt signaling contributes to intestinal tumorigenesis. In epithelial cells, APC competes with E-cadherin for β-catenin binding36, suggesting that β-catenin might also be partially sequestered by E-cadherin in the APC mutated condition. Thus, it is likely that E-cadherin-mediated redistribution of β-catenin might be an additional layer limiting Wnt signaling in normal tissues.
Our study proposes that the interaction between the E-cadherin-catenin complex and the actin cytoskeleton might be a key factor suppressing tumorigenesis. Similarly, during embryogenesis, cadherin antagonizes β-catenin activity37. Although E-cadherin and APC might also be potential candidate regulators for CCA complex in tumorigenesis, E-cadherin mutation rate is meager in CRC38 and APC’s function is inhibited by CPs39. Therefore, it is plausible that the defects in other key regulators of the CCA complex might be implicated in CRC. Our findings that CRAD ablation-induced F-actin depolymerization leads to intestinal tumorigenesis strongly suggest that CRAD-modulated actin cytoskeletal dynamics and CCA complex stabilization plays a crucial tumor suppressive role in the intestinal epithelium.
The limitation of APCMIN mouse model is that the development of intestinal adenomas mainly occurs in the small intestine not frequently in the colorectum, unlike human CRC25. CRAD KO mice develop tumors in both the small and large intestine (Fig. 6), which somewhat recapitulates human CRC pathology. Moreover, the APCMIN:CRAD+/− mice display microinvasion without EMT (Figs. S7f, S7g), implying the potential roles of CRAD inactivation in CRC metastasis.
MC (10–15% of human CRC) is highly metastatic and therapeutically resistant31. However, the molecular mechanism of MC development remains elusive. Tumors developed from CRAD KO mice display the excessive mucin deposition (Figs. 5e, 5f, 6j, 6l) with TOP-1 upregulation (Figs. 8e, 8f), mimicking human MC. This is further supported by the downregulation of CRAD in human MC (Figs. 8h-8j). Of note, APCMIN mice do not develop mucinous adenoma, implying that CRAD loss-induced MC development process might include distinct pathologic events in addition to Wnt/β-catenin hyperactivation. In normal intestine, mucin secreted by goblet cells is primarily involved in innate host defense. However, an abnormally elevated secretion of mucin contributes to CRC progression40. Thus, CRAD inactivation might also contribute to tumorigenesis via high mucin secretion, beyond Wnt signaling. It is noteworthy that CRAD KO cystic organoids display mucin upregulation in a cell-autonomous manner (Figs. 8a, 8b), excluding the potential involvement of immunocytes in mucin expression. Importantly, given no precedent MC mouse model, our CRAD KO mice may be highly beneficial to studies of human MC etiology.
Together, our study reveals that CRAD is a tumor suppressor and indispensable for the maintenance of epithelial cell integrity through modulation of the cytoskeleton and thereby CCA complex.
Supplementary Material
Acknowledgements
We appreciate to John A. Cooper for insightful comments and recommendation on the experiment and result analysis. We thank Seung-Hyo Lee, Han Na Suh, Sung Ho Lee, and Kwon-Sik Park for helpful comments on the manuscript. This work was supported by the Cancer Prevention Research Institute of Texas (RP140563 to J-.I.P.), the National Institutes of Health (R01 CA193297–01 to J-.I.P.; 5R01 GM107079 to P.D.M.; R01 GM126048 to W.W.), the Department of Defense Peer Reviewed Cancer Research Program (CA140572 to J-.I.P.), a Duncan Family Institute for Cancer Prevention and Risk Assessment Grant (IRG-08–061-01 to J-.I.P.), a Center for Stem Cell and Developmental Biology Transformative Grant (MD Anderson Cancer Center to J-.I.P.), an Institutional Research Grant (MD Anderson Cancer Center to J-.I.P.), a New Faculty Award (MD Anderson Cancer Center Support Grant to J-.I.P.), a Metastasis Research Center Grant (MD Anderson to J-.I.P.), and a Uterine SPORE Career Enhancement Program (MD Anderson to J-.I.P.). The core facility (DNA sequencing and Genetically Engineered Mouse Facility) was supported by the MD Anderson Cancer Center Support Grant (CA016672).
Footnotes
Disclosure of Potential Conflicts of Interest
The authors declare no competing financial interests.
References
- 1.Mege RM, Gavard J & Lambert M Regulation of cell-cell junctions by the cytoskeleton. Curr Opin Cell Biol 18, 541–548 (2006). [DOI] [PubMed] [Google Scholar]
- 2.Gumbiner BM & Kim NG The Hippo-YAP signaling pathway and contact inhibition of growth. J Cell Sci 127, 709–717 (2014). [DOI] [PMC free article] [PubMed] [Google Scholar]
- 3.Oda H & Takeichi M Evolution: structural and functional diversity of cadherin at the adherens junction. J Cell Biol 193, 1137–1146 (2011). [DOI] [PMC free article] [PubMed] [Google Scholar]
- 4.Maiden SL & Hardin J The secret life of alpha-catenin: moonlighting in morphogenesis. J Cell Biol 195, 543–552 (2011). [DOI] [PMC free article] [PubMed] [Google Scholar]
- 5.Bianchini JM et al. Reevaluating alphaE-catenin monomer and homodimer functions by characterizing E-cadherin/alphaE-catenin chimeras. J Cell Biol 210, 1065–1074 (2015). [DOI] [PMC free article] [PubMed] [Google Scholar]
- 6.Edwards M et al. Capping protein regulators fine-tune actin assembly dynamics. Nat Rev Mol Cell Biol 15, 677–689 (2014). [DOI] [PMC free article] [PubMed] [Google Scholar]
- 7.Bear JE et al. Antagonism between Ena/VASP proteins and actin filament capping regulates fibroblast motility. Cell 109, 509–521 (2002). [DOI] [PubMed] [Google Scholar]
- 8.Xue B & Robinson RC Guardians of the actin monomer. Eur J Cell Biol 92, 316–332 (2013). [DOI] [PubMed] [Google Scholar]
- 9.Schafer DA, Jennings PB & Cooper JA Dynamics of capping protein and actin assembly in vitro: uncapping barbed ends by polyphosphoinositides. J Cell Biol 135, 169–179 (1996). [DOI] [PMC free article] [PubMed] [Google Scholar]
- 10.Taoka M et al. V-1, a protein expressed transiently during murine cerebellar development, regulates actin polymerization via interaction with capping protein. J Biol Chem 278, 5864–5870 (2003). [DOI] [PubMed] [Google Scholar]
- 11.George J et al. Comprehensive genomic profiles of small cell lung cancer. Nature 524, 47–53 (2015). [DOI] [PMC free article] [PubMed] [Google Scholar]
- 12.Ambros VR, Chen LB & Buchanan JM Surface ruffles as markers for studies of cell transformation by Rous sarcoma virus. Proc Natl Acad Sci U S A 72, 3144–3148 (1975). [DOI] [PMC free article] [PubMed] [Google Scholar]
- 13.de Curtis I & Meldolesi J Cell surface dynamics - how Rho GTPases orchestrate the interplay between the plasma membrane and the cortical cytoskeleton. J Cell Sci 125, 4435–4444 (2012). [DOI] [PubMed] [Google Scholar]
- 14.Gauthier NC, Masters TA & Sheetz MP Mechanical feedback between membrane tension and dynamics. Trends Cell Biol 22, 527–535 (2012). [DOI] [PubMed] [Google Scholar]
- 15.Pollard TD & Cooper JA Actin, a central player in cell shape and movement. Science 326, 1208–1212 (2009). [DOI] [PMC free article] [PubMed] [Google Scholar]
- 16.Bryce NS et al. Cortactin promotes cell motility by enhancing lamellipodial persistence. Curr Biol 15, 1276–1285 (2005). [DOI] [PubMed] [Google Scholar]
- 17.Montross WT, Ji H & McCrea PD A beta-catenin/engrailed chimera selectively suppresses Wnt signaling. J Cell Sci 113 (Pt 10), 1759–1770 (2000). [DOI] [PubMed] [Google Scholar]
- 18.Kwiatkowski AV et al. In vitro and in vivo reconstitution of the cadherin-catenin-actin complex from Caenorhabditis elegans. Proc Natl Acad Sci U S A 107, 14591–14596 (2010). [DOI] [PMC free article] [PubMed] [Google Scholar]
- 19.Maiden SL et al. Specific conserved C-terminal amino acids of Caenorhabditis elegans HMP-1/alpha-catenin modulate F-actin binding independently of vinculin. J Biol Chem 288, 5694–5706 (2013). [DOI] [PMC free article] [PubMed] [Google Scholar]
- 20.Hong S, Troyanovsky RB & Troyanovsky SM Binding to F-actin guides cadherin cluster assembly, stability, and movement. J Cell Biol 201, 131–143 (2013). [DOI] [PMC free article] [PubMed] [Google Scholar]
- 21.Braga VM & Yap AS The challenges of abundance: epithelial junctions and small GTPase signalling. Curr Opin Cell Biol 17, 466–474 (2005). [DOI] [PubMed] [Google Scholar]
- 22.Tanaka Y et al. Frequent beta-catenin mutation and cytoplasmic/nuclear accumulation in pancreatic solid-pseudopapillary neoplasm. Cancer Res 61, 8401–8404 (2001). [PubMed] [Google Scholar]
- 23.Peterson LW & Artis D Intestinal epithelial cells: regulators of barrier function and immune homeostasis. Nat Rev Immunol 14, 141–153 (2014). [DOI] [PubMed] [Google Scholar]
- 24.van Es JH et al. Wnt signalling induces maturation of Paneth cells in intestinal crypts. Nat Cell Biol 7, 381–386 (2005). [DOI] [PubMed] [Google Scholar]
- 25.Moser AR, Pitot HC & Dove WF A dominant mutation that predisposes to multiple intestinal neoplasia in the mouse. Science 247, 322–324 (1990). [DOI] [PubMed] [Google Scholar]
- 26.Bara J, Forgue-Lafitte ME, Maurin N, Flejou JF & Zimber A Abnormal expression of gastric mucin in human and rat aberrant crypt foci during colon carcinogenesis. Tumour Biol 24, 109–115 (2003). [DOI] [PubMed] [Google Scholar]
- 27.Sachs N & Clevers H Organoid cultures for the analysis of cancer phenotypes. Curr Opin Genet Dev 24, 68–73 (2014). [DOI] [PubMed] [Google Scholar]
- 28.Podolsky DK, Fournier DA & Lynch KE Human colonic goblet cells. Demonstration of distinct subpopulations defined by mucin-specific monoclonal antibodies. J Clin Invest 77, 1263–1271 (1986). [DOI] [PMC free article] [PubMed] [Google Scholar]
- 29.Yamachika T et al. Establishment and characterization of a human colonic mucinous carcinoma cell line with predominant goblet-cell differentiation from liver metastasis. Pathol Int 55, 550–557 (2005). [DOI] [PubMed] [Google Scholar]
- 30.van Es JH et al. Notch/gamma-secretase inhibition turns proliferative cells in intestinal crypts and adenomas into goblet cells. Nature 435, 959–963 (2005). [DOI] [PubMed] [Google Scholar]
- 31.Hugen N, Brown G, Glynne-Jones R, de Wilt JH & Nagtegaal ID Advances in the care of patients with mucinous colorectal cancer. Nat Rev Clin Oncol 13, 361–369 (2016). [DOI] [PubMed] [Google Scholar]
- 32.Brabletz T et al. Nuclear overexpression of the oncoprotein beta-catenin in colorectal cancer is localized predominantly at the invasion front. Pathol Res Pract 194, 701–704 (1998). [DOI] [PubMed] [Google Scholar]
- 33.Vermeulen L et al. Wnt activity defines colon cancer stem cells and is regulated by the microenvironment. Nat Cell Biol 12, 468–476 (2010). [DOI] [PubMed] [Google Scholar]
- 34.Goentoro L & Kirschner MW Evidence that fold-change, and not absolute level, of beta-catenin dictates Wnt signaling. Mol Cell 36, 872–884 (2009). [DOI] [PMC free article] [PubMed] [Google Scholar]
- 35.Voloshanenko O et al. Wnt secretion is required to maintain high levels of Wnt activity in colon cancer cells. Nat Commun 4, 2610 (2013). [DOI] [PMC free article] [PubMed] [Google Scholar]
- 36.Hulsken J, Birchmeier W & Behrens J E-cadherin and APC compete for the interaction with beta-catenin and the cytoskeleton. J Cell Biol 127, 2061–2069 (1994). [DOI] [PMC free article] [PubMed] [Google Scholar]
- 37.Fagotto F, Funayama N, Gluck U & Gumbiner BM Binding to cadherins antagonizes the signaling activity of beta-catenin during axis formation in Xenopus. J Cell Biol 132, 1105–1114 (1996). [DOI] [PMC free article] [PubMed] [Google Scholar]
- 38.Brannon AR et al. Comparative sequencing analysis reveals high genomic concordance between matched primary and metastatic colorectal cancer lesions. Genome Biol 15, 454 (2014). [DOI] [PMC free article] [PubMed] [Google Scholar]
- 39.Okada K et al. Adenomatous polyposis coli protein nucleates actin assembly and synergizes with the formin mDia1. J Cell Biol 189, 1087–1096 (2010). [DOI] [PMC free article] [PubMed] [Google Scholar]
- 40.Kufe DW Mucins in cancer: function, prognosis and therapy. Nat Rev Cancer 9, 874–885 (2009). [DOI] [PMC free article] [PubMed] [Google Scholar]
Associated Data
This section collects any data citations, data availability statements, or supplementary materials included in this article.


